The Bond County Illinois Land Cover Map set is overwhelmingly agricultural, but the county is not a uniform field pattern. Agriculture accounts for 71.39% of the 2025 summary, while forest covers 17.55%, developed land 8.40%, wetlands 1.74%, and water 0.85%. Greenville forms the clearest built concentration near the center, and a prominent lake just to its north provides an easy landmark for comparing farms, woods, water, and settlement.
This page includes four views: 2025 land cover, forest and farmland, impervious surface and developed land, and a 1985–2025 class-difference comparison. The WebP maps are displayed with the explanations, and the four original 2480 × 1754-pixel JPG files are available together in one ZIP download for presentations, county profiles, classes, and visual reference.
Table of Contents
Greenville and Governor Bond Lake make a useful center point for reading the county
Bond County’s official courthouse address is in Greenville, and the strongest developed cluster on the supplied maps sits near the middle of the county. That makes Greenville the most useful reference point for interpreting the central red developed area. Thin developed traces extend outward in several directions, while smaller clusters appear farther west, northwest, and east. The map contains no municipal boundaries, so these color edges should not be treated as legal city limits.
North of the central cluster, the largest blue water body in the map stands out against surrounding agriculture and forest. The City of Greenville identifies Governor Bond Lake as a roughly 775-acre lake in Greenville. It was built in the late 1960s as a water supply and is also used for recreation. That official description fits the large lake shown just north of the Greenville-area development.
Agriculture covers 71.39%, but forest is concentrated enough to shape the western view
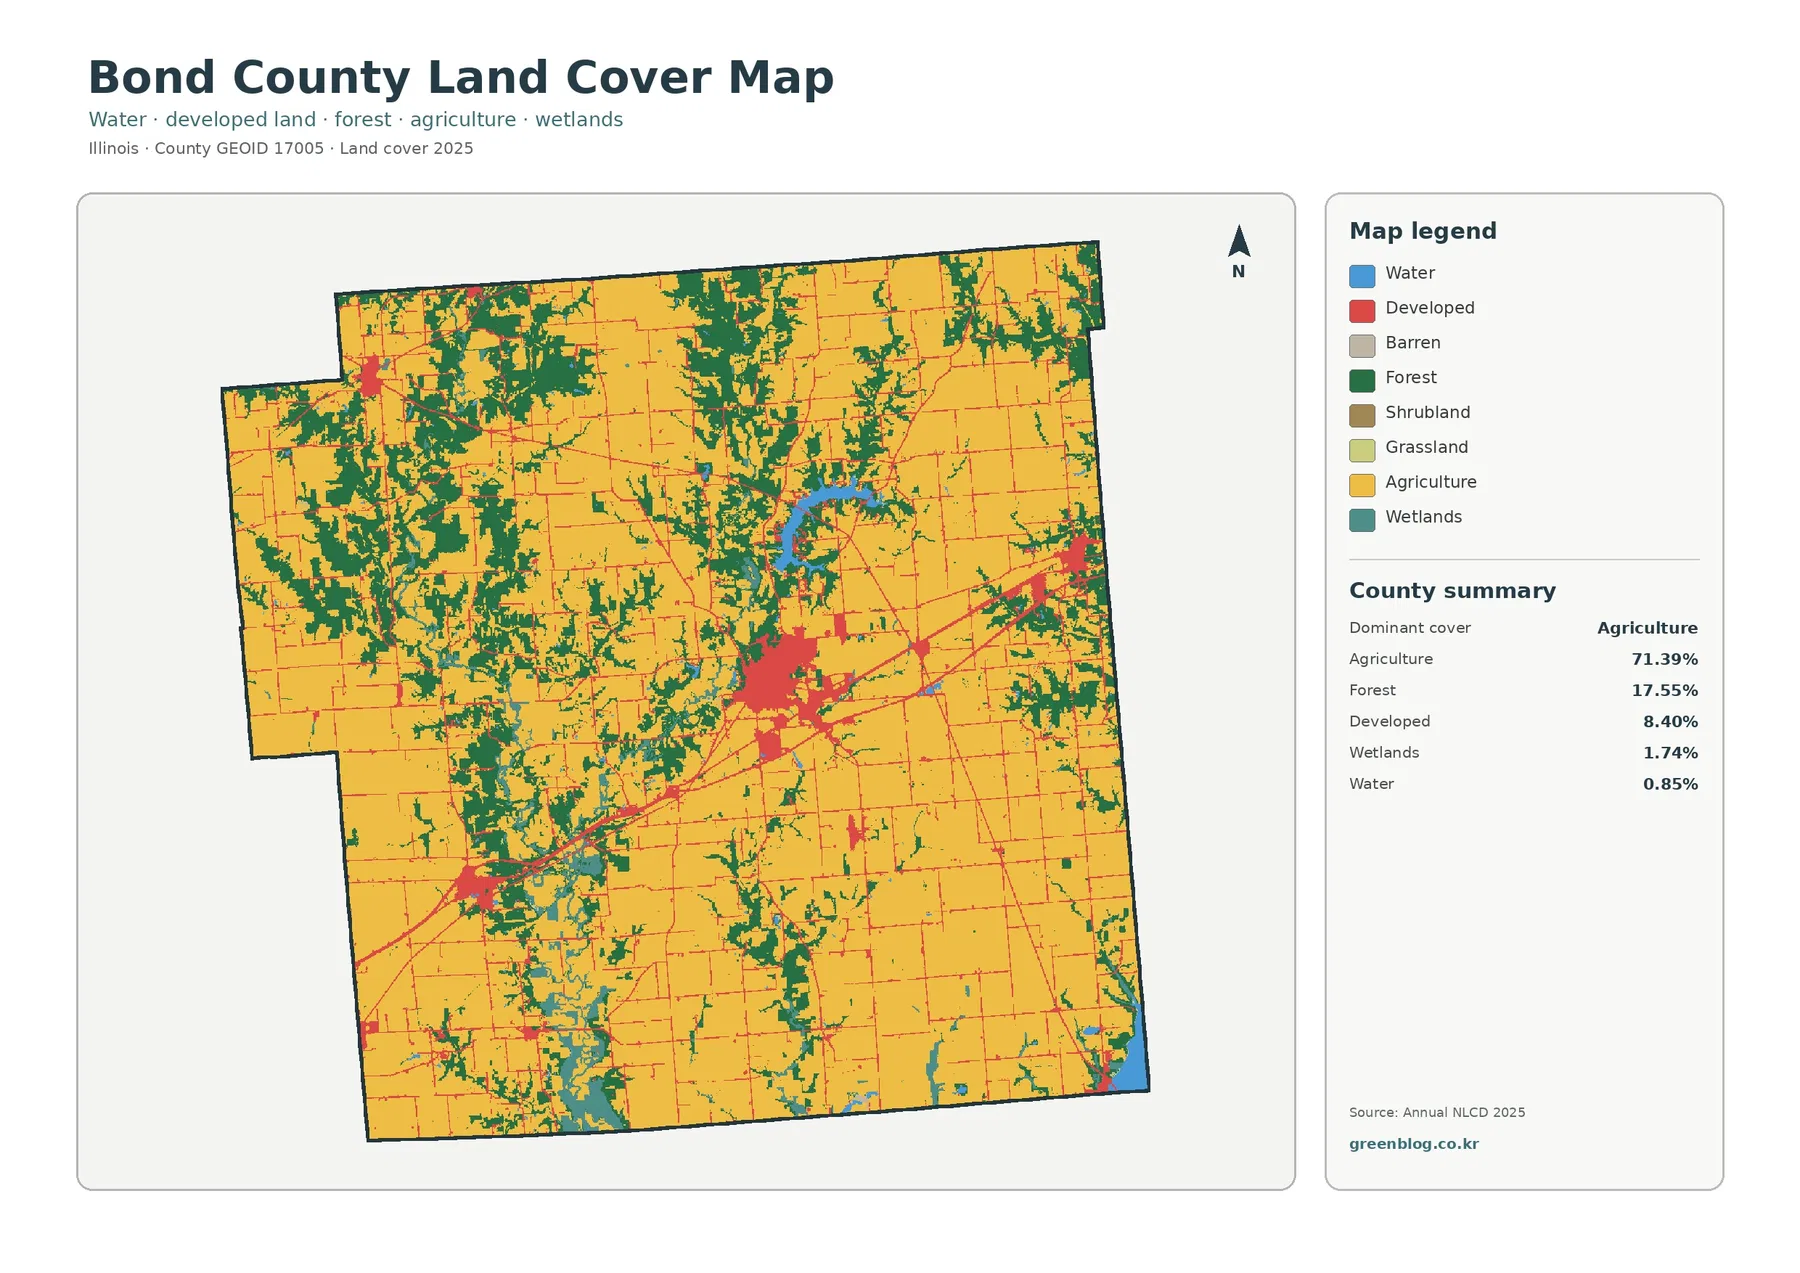
Yellow agriculture fills most of the east and south and also extends across large parts of the north and west. The dominance of agriculture in the 71.39% summary is immediately visible. Dark green forest does not form one continuous block; instead, it is concentrated in the northwest and west and reappears in branching patches through the central and southern portions of the county.
Developed land is only 8.40%, yet the red class is visually important because it is clustered rather than evenly spread. The Greenville-area core is the largest concentration, and thin red lines create a fine network across the agricultural landscape. Those lines can coincide with roads and buildings, but the image does not label routes, so naming a specific highway from the land-cover layer alone would go beyond the supplied evidence.
The forest-and-farmland view makes the northwest-to-east contrast easier to follow
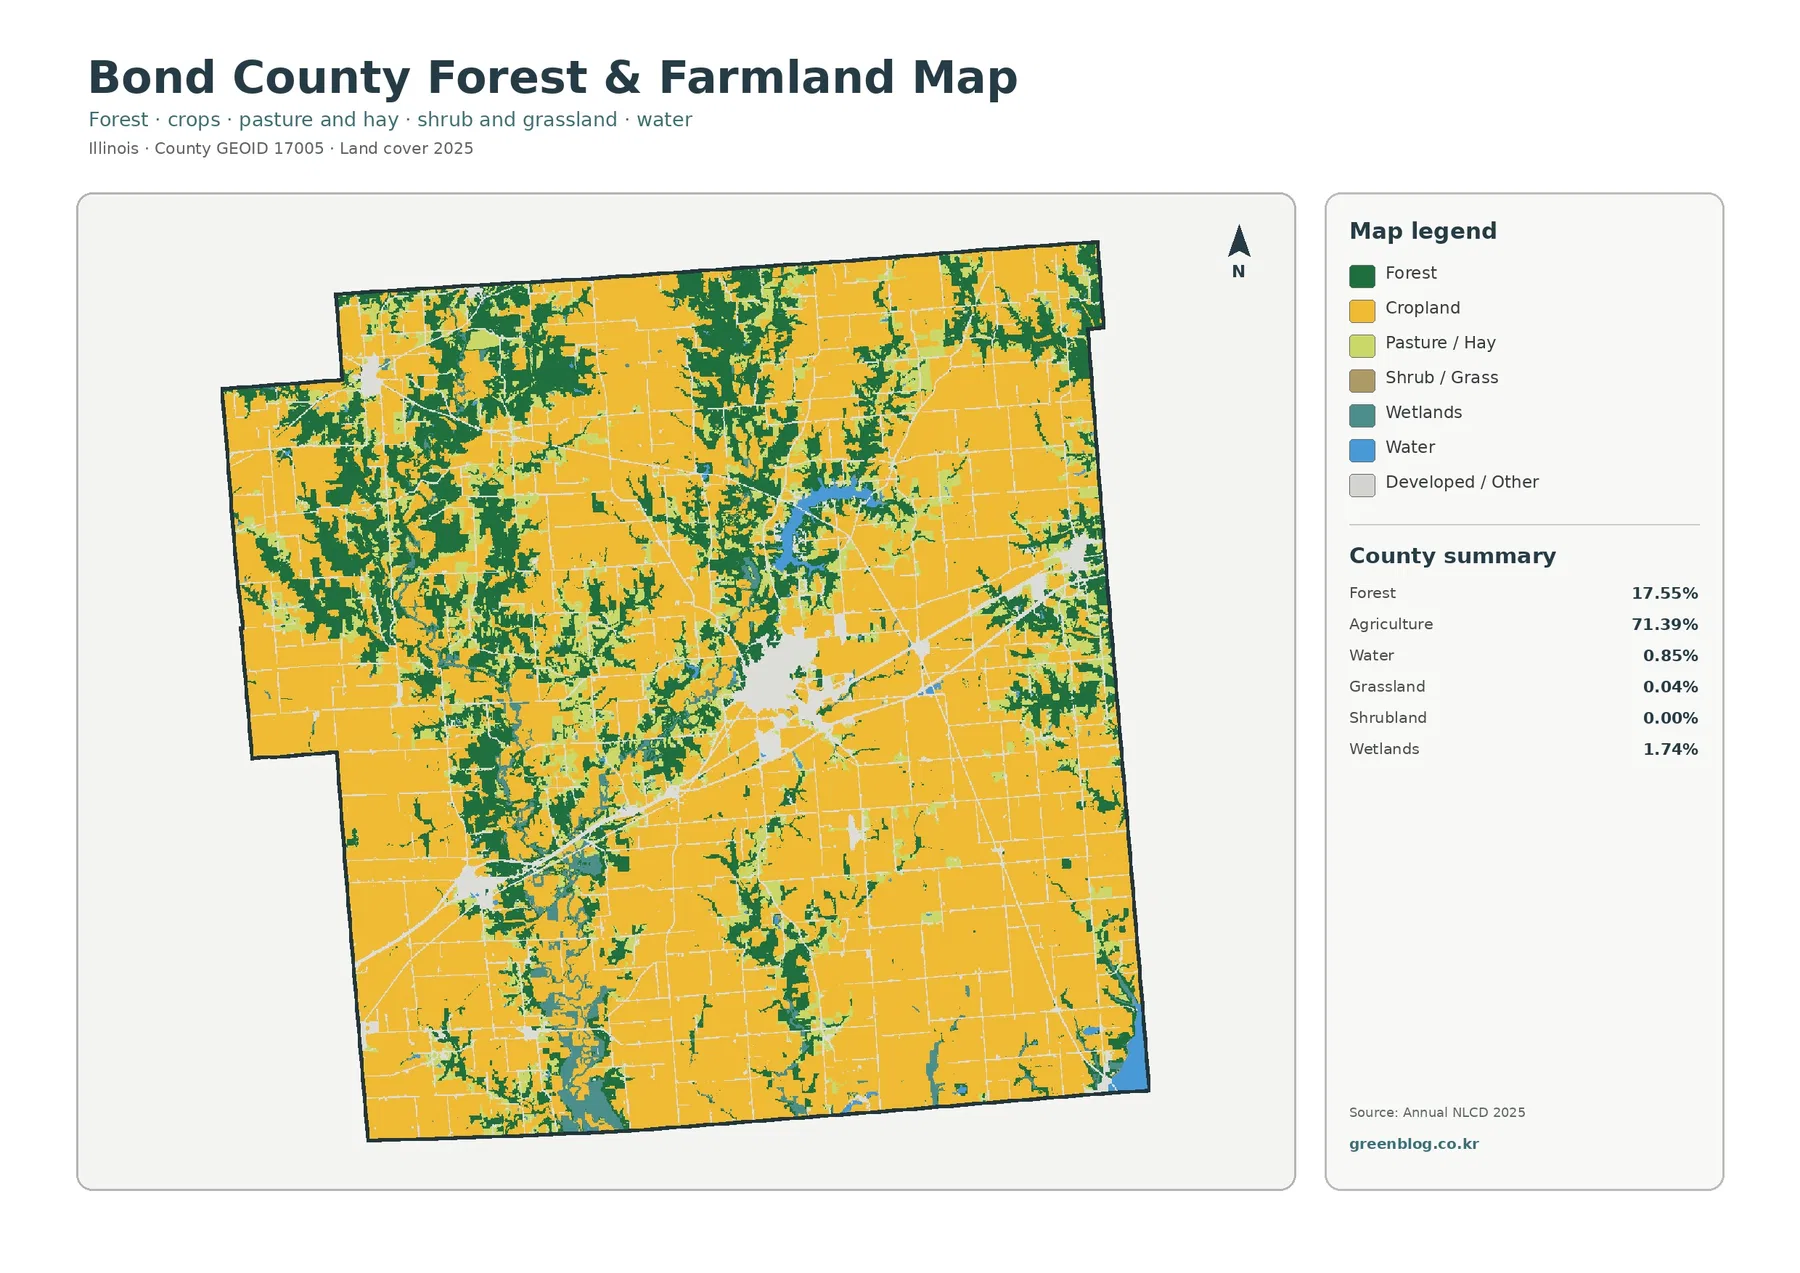
Fading developed and miscellaneous surfaces makes the 71.39% agricultural share even more apparent. Broad cropland blocks occupy the eastern half and much of the south. Forest at 17.55% is concentrated more strongly in the northwest and west, with additional green strips and patches around the county center and toward the south.
Grassland is only 0.04% in the supplied summary, and shrubland rounds to 0.00%. Those classes are not meaningful countywide features here. Bond County is therefore better described through the relationship among cropland, forest, development, wetlands, and water rather than by open grass or shrub cover.
Hard surfaces are strongest in Greenville while most of the county remains lightly impervious
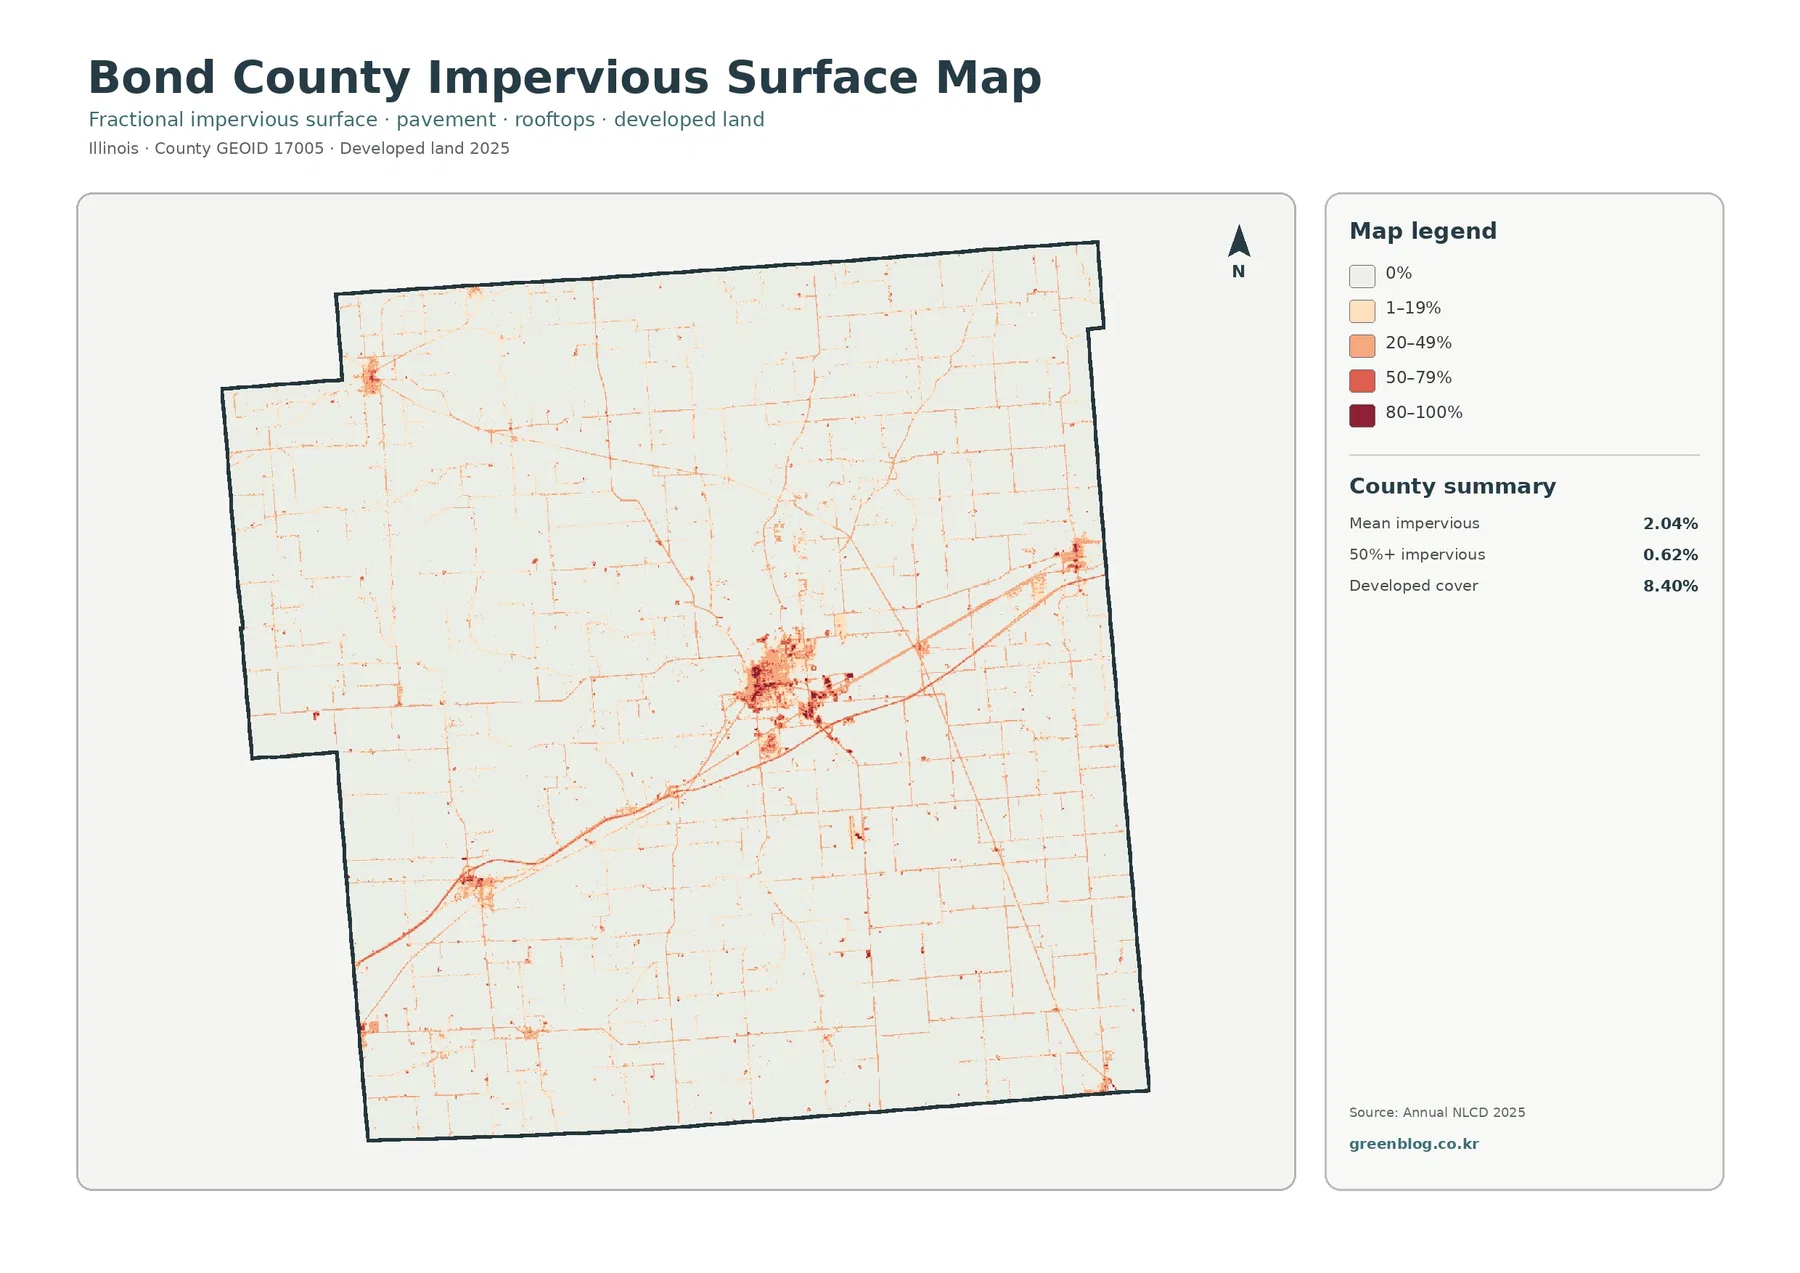
Impervious surface means roofs, pavement, parking areas, and similar hard surfaces that do not readily absorb rainfall. Bond County has a mean impervious value of 2.04%, and 0.62% of the county is mapped at 50% impervious or greater. These figures are lower than the 8.40% developed land-cover share because developed classes can include lawns, trees, and other permeable areas.
The darkest tones collect around Greenville. Smaller concentrated areas occur to the southwest, northwest, east, and near the county edges, while a fine network of low impervious values crosses the farm grid. The countywide mean combines those built locations with very large rural areas near zero, so the location of the dark patches is more informative than the average alone.
Most 1985–2025 endpoint differences fall into the broad ‘other’ category
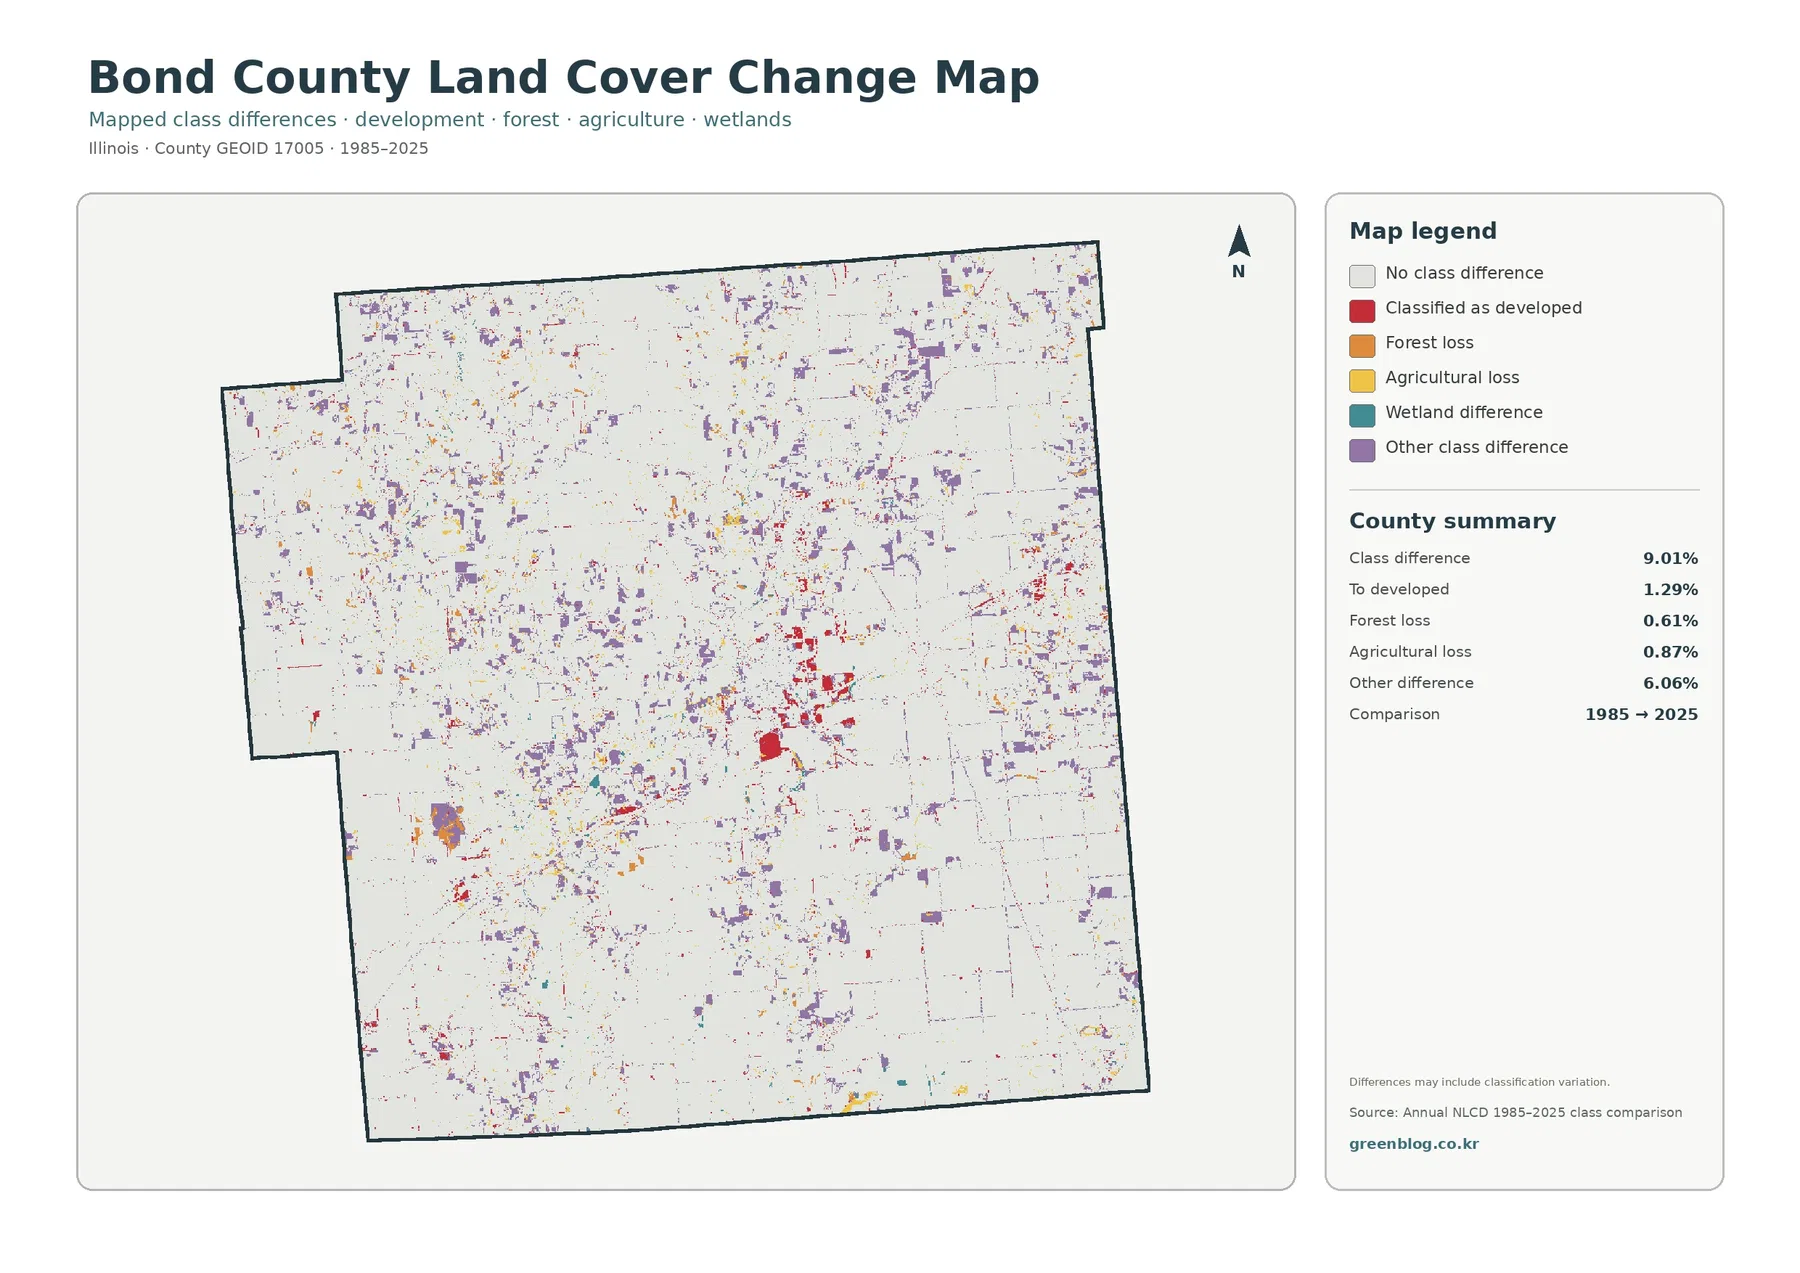
The 1985–2025 comparison reports 9.01% total class difference. The printed components are 1.29% classified as developed, 0.61% forest loss, 0.87% agricultural loss, and 6.06% other difference. Wetland difference appears in the legend without its own printed percentage, so a separate value should not be estimated from the map or created by subtraction.
Red developed-conversion cells are most conspicuous around Greenville and in smaller linear or clustered locations. Purple other-difference cells are scattered through much more of the county, particularly in the north and west. Forest-loss and agricultural-loss colors are present in smaller patches rather than as one large continuous conversion zone.
A loss label describes a difference between endpoint classes, not a cause. A cell that was agricultural in 1985 and another class in 2025 might reflect a real land-surface change, a fallow field, water conditions, vegetation change, or classification variation. Forest loss likewise cannot be equated automatically with logging or damage.
What the 30-meter grid can and cannot tell you
Annual NLCD uses 30-meter square cells. Each cell receives one predominant land-cover class even when a farm edge, tree row, ditch, road, and building share the same space. Straight-looking field boundaries or narrow developed lines may therefore be generalized compared with property records or high-resolution aerial imagery.
Each original JPG measures 2480 × 1754 pixels. The package does not state that the files meet an A3 high-resolution reference, so a test print is sensible before enlarging them for a large poster. They are suitable for documents, screen presentations, classroom material, and county comparisons, but not for surveying, zoning, or regulatory wetland decisions.
Files included in the four-map JPG download
The ZIP contains one JPG each for the 2025 land-cover overview, forest and farmland, impervious surface and developed land, and the 1985–2025 class-difference map. Together they let a reader compare Bond County’s dominant farm landscape, western forest patches, Greenville’s built core, Governor Bond Lake, and endpoint change without switching between unrelated map boundaries.
Frequently Asked Questions
How agricultural is Bond County in the 2025 map?
Agriculture is the dominant class at 71.39%. Forest follows at 17.55% and is concentrated mainly in the west, northwest, and scattered central areas. Developed land, wetlands, and water occupy much smaller shares, but Greenville and Governor Bond Lake remain visually important because they are concentrated.
Is the large lake north of Greenville Governor Bond Lake?
The City of Greenville identifies Governor Bond Lake as a roughly 775-acre lake in Greenville. The large water body shown just north of the Greenville-area developed cluster is consistent with that location. The land-cover map itself does not print lake or municipal boundaries, so the official city page should be used for exact lake information and regulations.
Does 9.01% class difference mean 9.01% of Bond County was damaged between 1985 and 2025?
No. It is the share of cells that received different endpoint classifications. Real surface change can contribute, but classification methods, mixed 30-meter cells, seasonal conditions, and other factors can also affect the result. Intermediate imagery and local records are needed to determine when and why a specific place changed.
Sources and Reference Data
- MRLC Annual NLCD Data – official access point for annual land-cover and comparison products
- USGS Annual NLCD Land Cover Classification – official guidance for the 30-meter land-cover classes
- U.S. Census Bureau TIGER/Line Shapefiles – official county-boundary reference for Bond County
- City of Greenville – Governor Bond Lake – official city information on the lake, its approximate 775-acre size, and public use
- Bond County Zoning – official county GIS Web Map and current zoning or building information
- University of Illinois Extension – Bond County – local Extension programs and Bond County office information
Map File Information
The ZIP contains four original JPG maps for comparing Bond County's agricultural landscape, western forest patches, Greenville hard surfaces, Governor Bond Lake, and 1985–2025 class differences.
- Included Files: Original high-resolution map files shown in this article
- File Type: JPG images packaged in a ZIP archive
- Intended Use: Printing, education, presentations, and map-based projects
Related Maps
- Adams County Illinois Land Cover Map
- Alexander County Illinois Land Cover Map
- From Cook to Alexander: Reading an Illinois County Map
Green Map creates custom-edited map images using open geographic data sources such as geoBoundaries, Natural Earth, OpenStreetMap, and government open data. These maps are edited visual materials, not raw data files, and are provided for education, documents, presentations, and graphic reference.