Lake County, Illinois is dominated by developed cover in the 2025 map, but the western half contains a much more varied mix of water, wetlands, farmland, and forest. Developed land accounts for 61.72% of the county, followed by agriculture at 12.83%, wetlands at 9.71%, forest at 9.62%, and water at 5.12%. The contrast between the heavily built east and the lake-rich, mixed western side is the strongest feature of the map set.
The page includes four map views and one download containing all four original JPG files. Use the general land-cover map for the broad county pattern, the impervious map for hard-surface intensity, the forest-and-farmland view for the remaining natural and agricultural cover, and the 1985–2025 comparison for mapped class differences through time.
Table of Contents
Developed cover is continuous across much of the east and southeast
Red developed cover occupies most of the eastern edge and much of the southeastern half of Lake County. Large built areas connect through the center, leaving only scattered forest, wetland, water, and agricultural patches within the developed background. The northeast is also heavily developed, while a broader mixture begins to appear as the map moves westward.
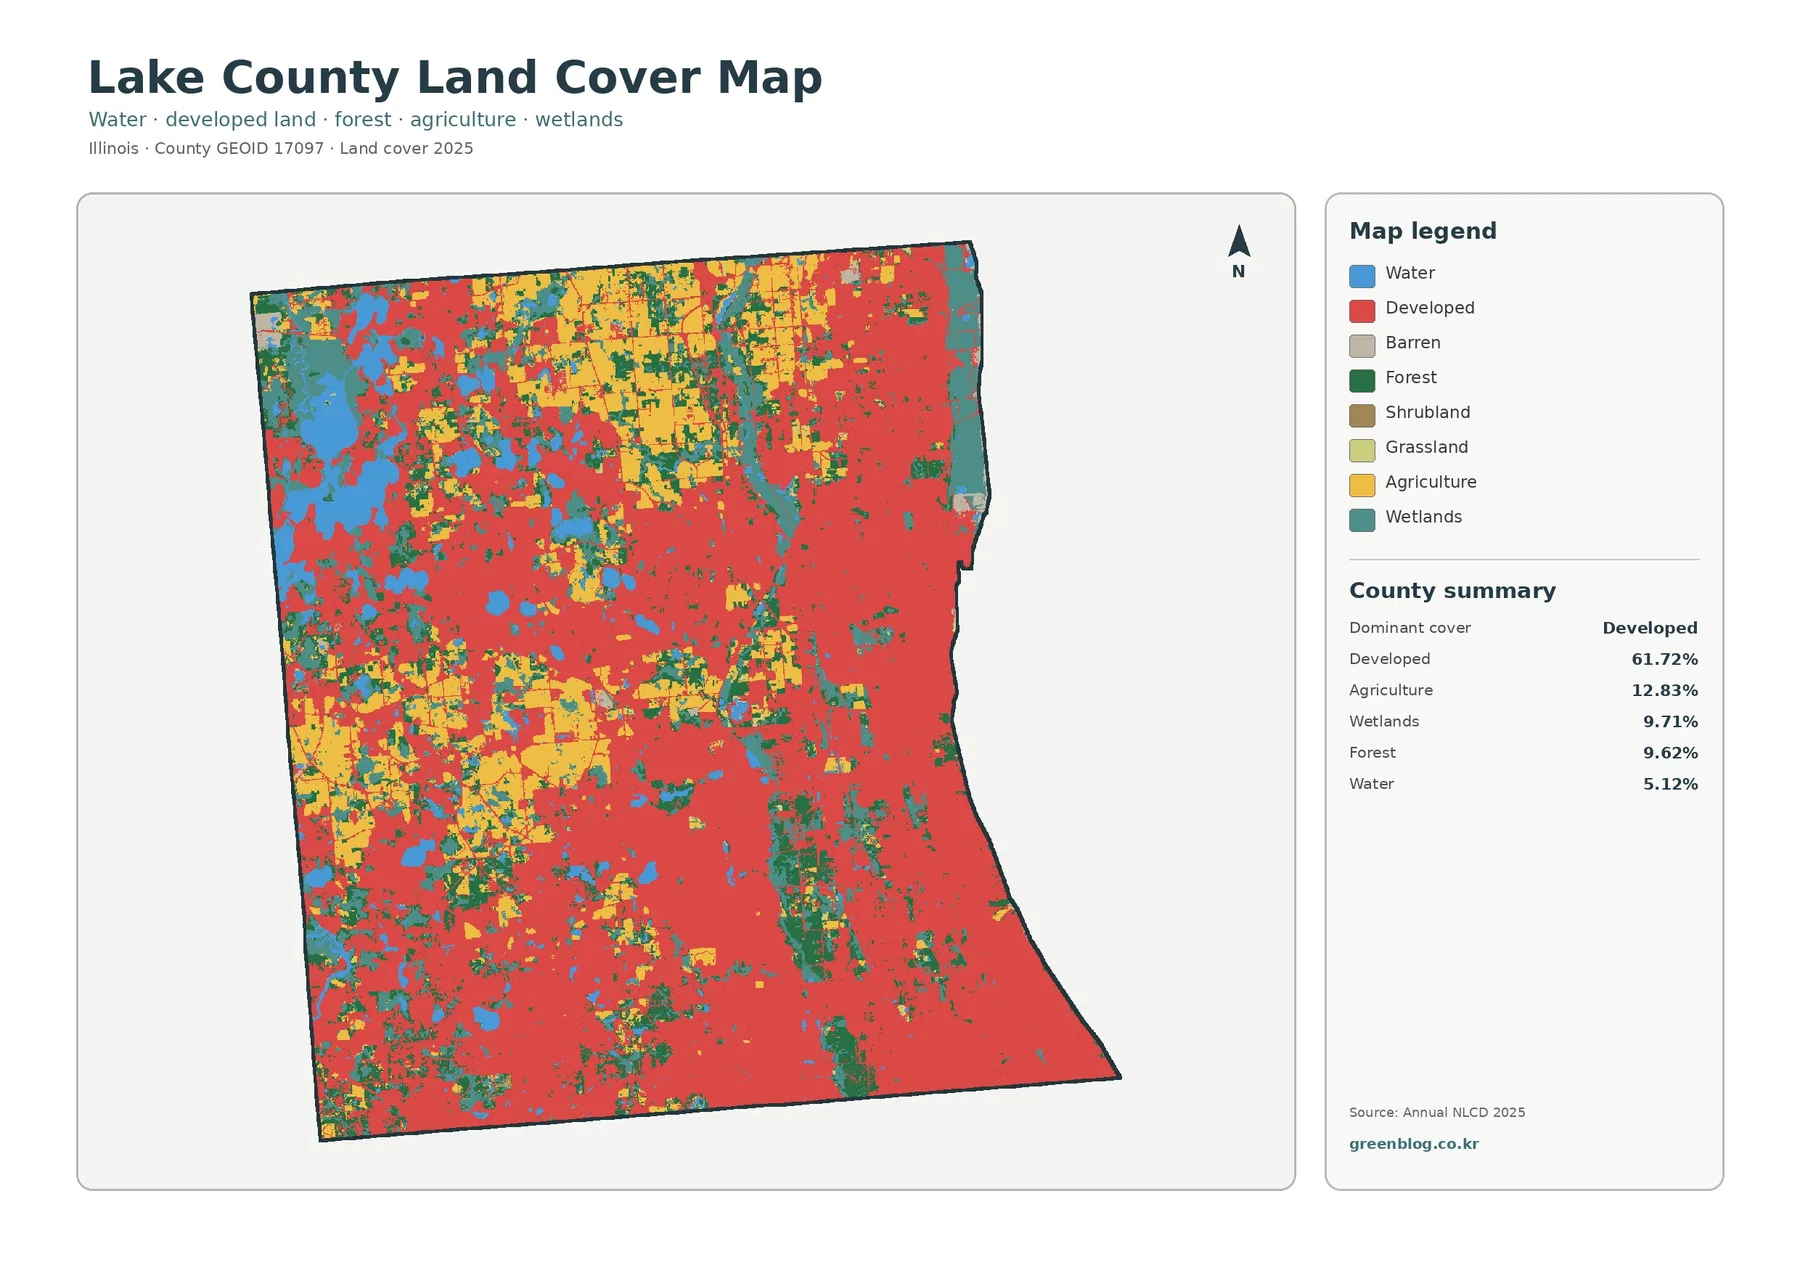
The west and northwest have a very different appearance. Large blue water bodies are surrounded by wetland and forest patches, and agriculture remains visible in broader blocks through the north-central and west-central areas. Development is still common, but it is broken into smaller pieces by water and natural cover. The result is not a clean east-west dividing line; rather, the amount of mixed cover increases noticeably toward the western half.
Wetlands and forest have nearly equal countywide shares, at 9.71% and 9.62%. Their spatial patterns differ. Wetlands appear around many water features, along parts of the northern edge, and in narrow strips through developed areas. Forest occurs beside several water bodies and in scattered patches through the center, south, and west. Looking at both categories separately prevents the similar percentages from hiding their very different shapes.
Water and wetlands form a major western landscape component despite the county’s urban majority
Water covers 5.12% of Lake County and is especially prominent in the northwest and western interior. Several large blue areas sit close together, with additional smaller water bodies farther south and toward the center. Their boundaries are often accompanied by teal wetland cover and green forest, producing a much more complex pattern than the large developed blocks to the east.
Wetlands are not restricted to the immediate edges of open water. Teal areas also occur along the northern boundary, through narrow central corridors, and along parts of the eastern edge. Some wetland patches lie directly against developed cover, while others are associated with forest or agricultural land. That broad distribution makes wetlands one of the county’s main land-cover classes rather than a minor detail.
A 21.88% mean impervious value shows how much hard surface is embedded in the developed area
Impervious surface means pavement, parking lots, rooftops, and other hard materials that water does not readily soak through. Lake County has a mean impervious value of 21.88%, and 17.39% of the county reaches 50% impervious or greater. Those values are lower than the 61.72% developed-land share because developed classes can still contain lawns, trees, soil, and other permeable surfaces.
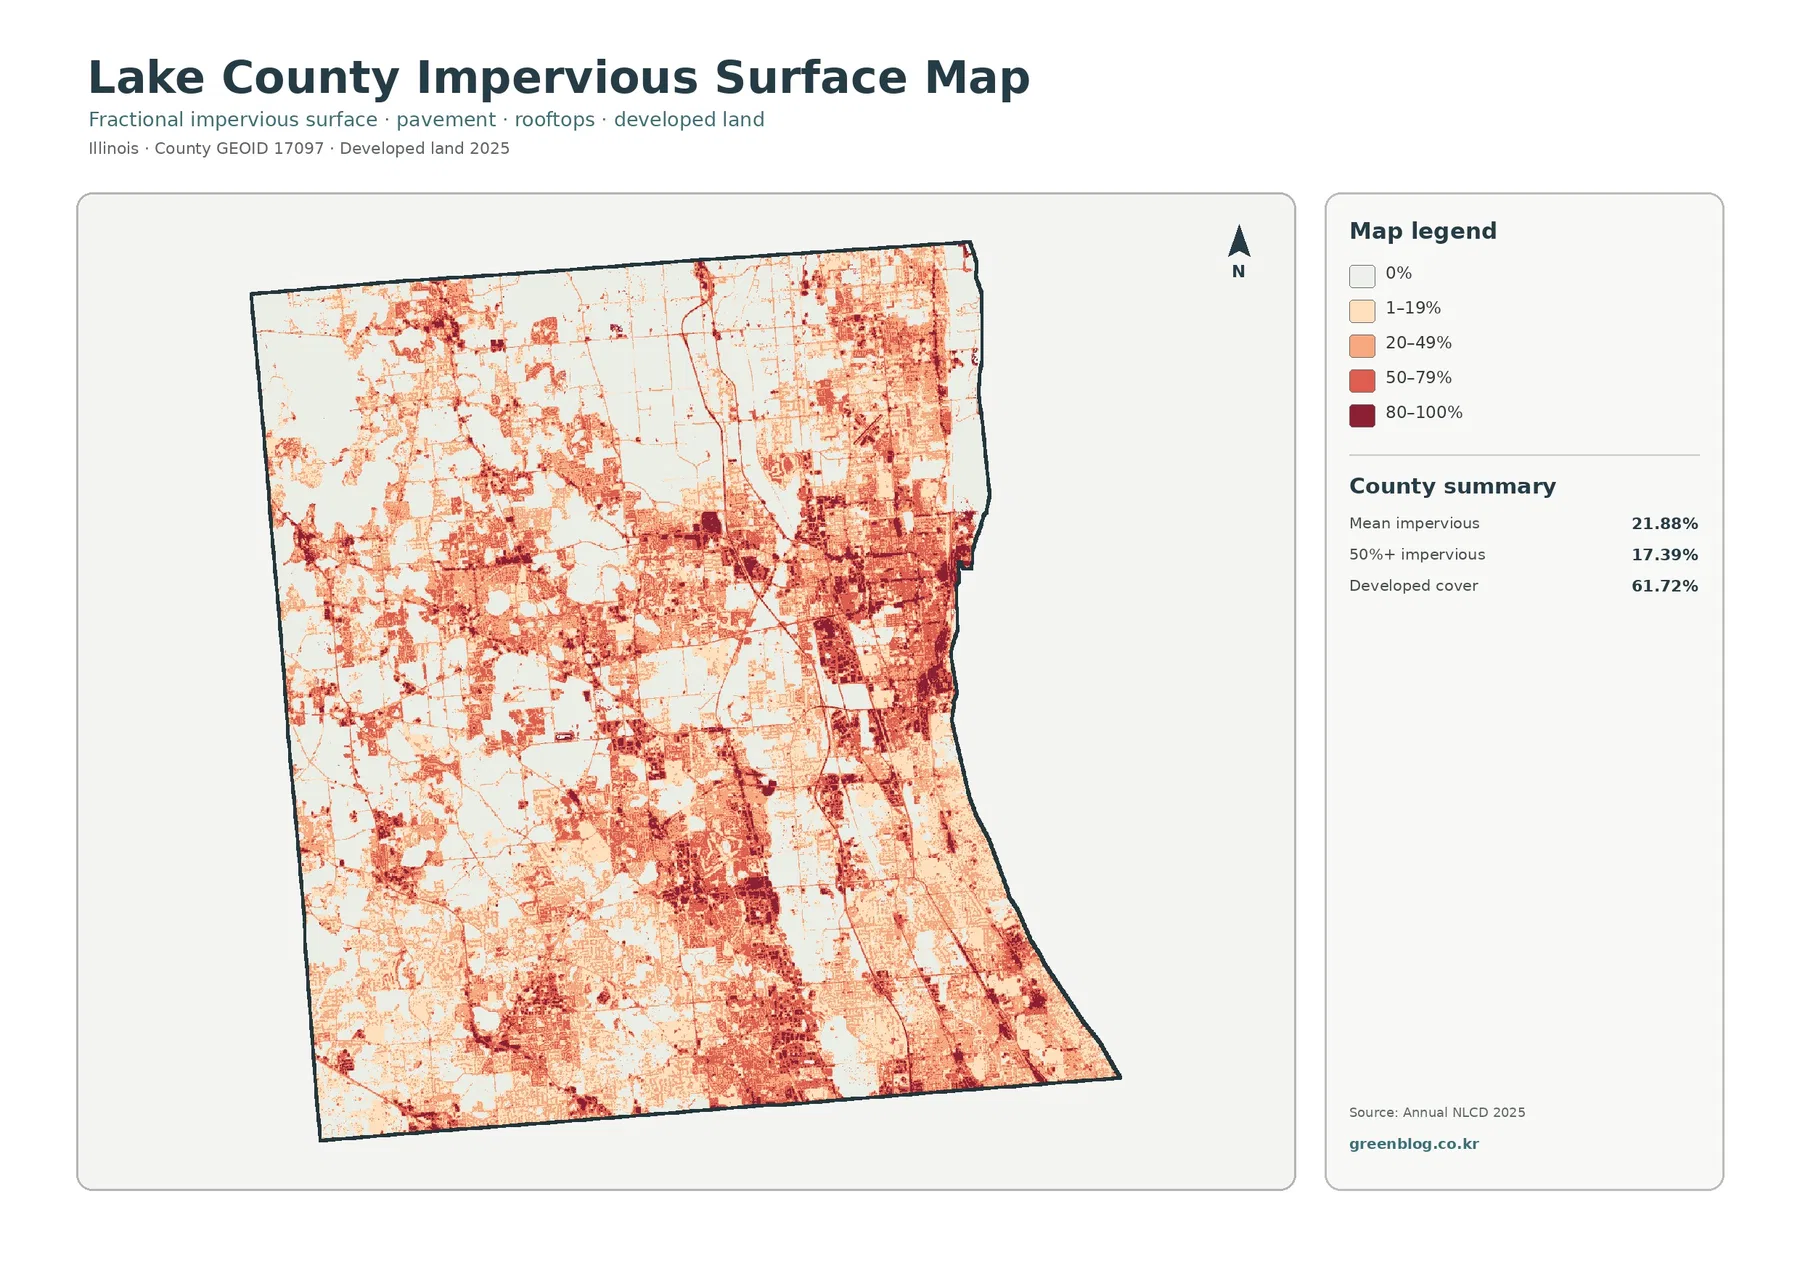
The darkest impervious classes are widespread in the east and southeast. Dense 50–79% and 80–100% patches repeat through major built areas and along road corridors, with additional concentrations in the northeast and center. A broad developed band also continues southward through the county. This is not a map where hard surfaces are limited to a few small settlement dots; they occupy extensive connected areas.
The western side contains more pale areas, especially around large water bodies, agricultural blocks, forest, and wetlands. Even there, however, developed roads and built clusters remain common. Comparing the impervious and general land-cover maps is useful because the first shows intensity inside developed land while the second simply identifies the broader developed class.
Forest and farmland stand out more clearly when the developed majority is muted
On the forest-and-farmland map, developed and other cover is shown in a pale neutral tone. This makes the remaining 12.83% agriculture and 9.62% forest easier to locate. The largest agricultural blocks are concentrated in the north-central and western portions of the county, with additional farm areas in the southwest. The eastern side contains much less continuous agricultural cover.
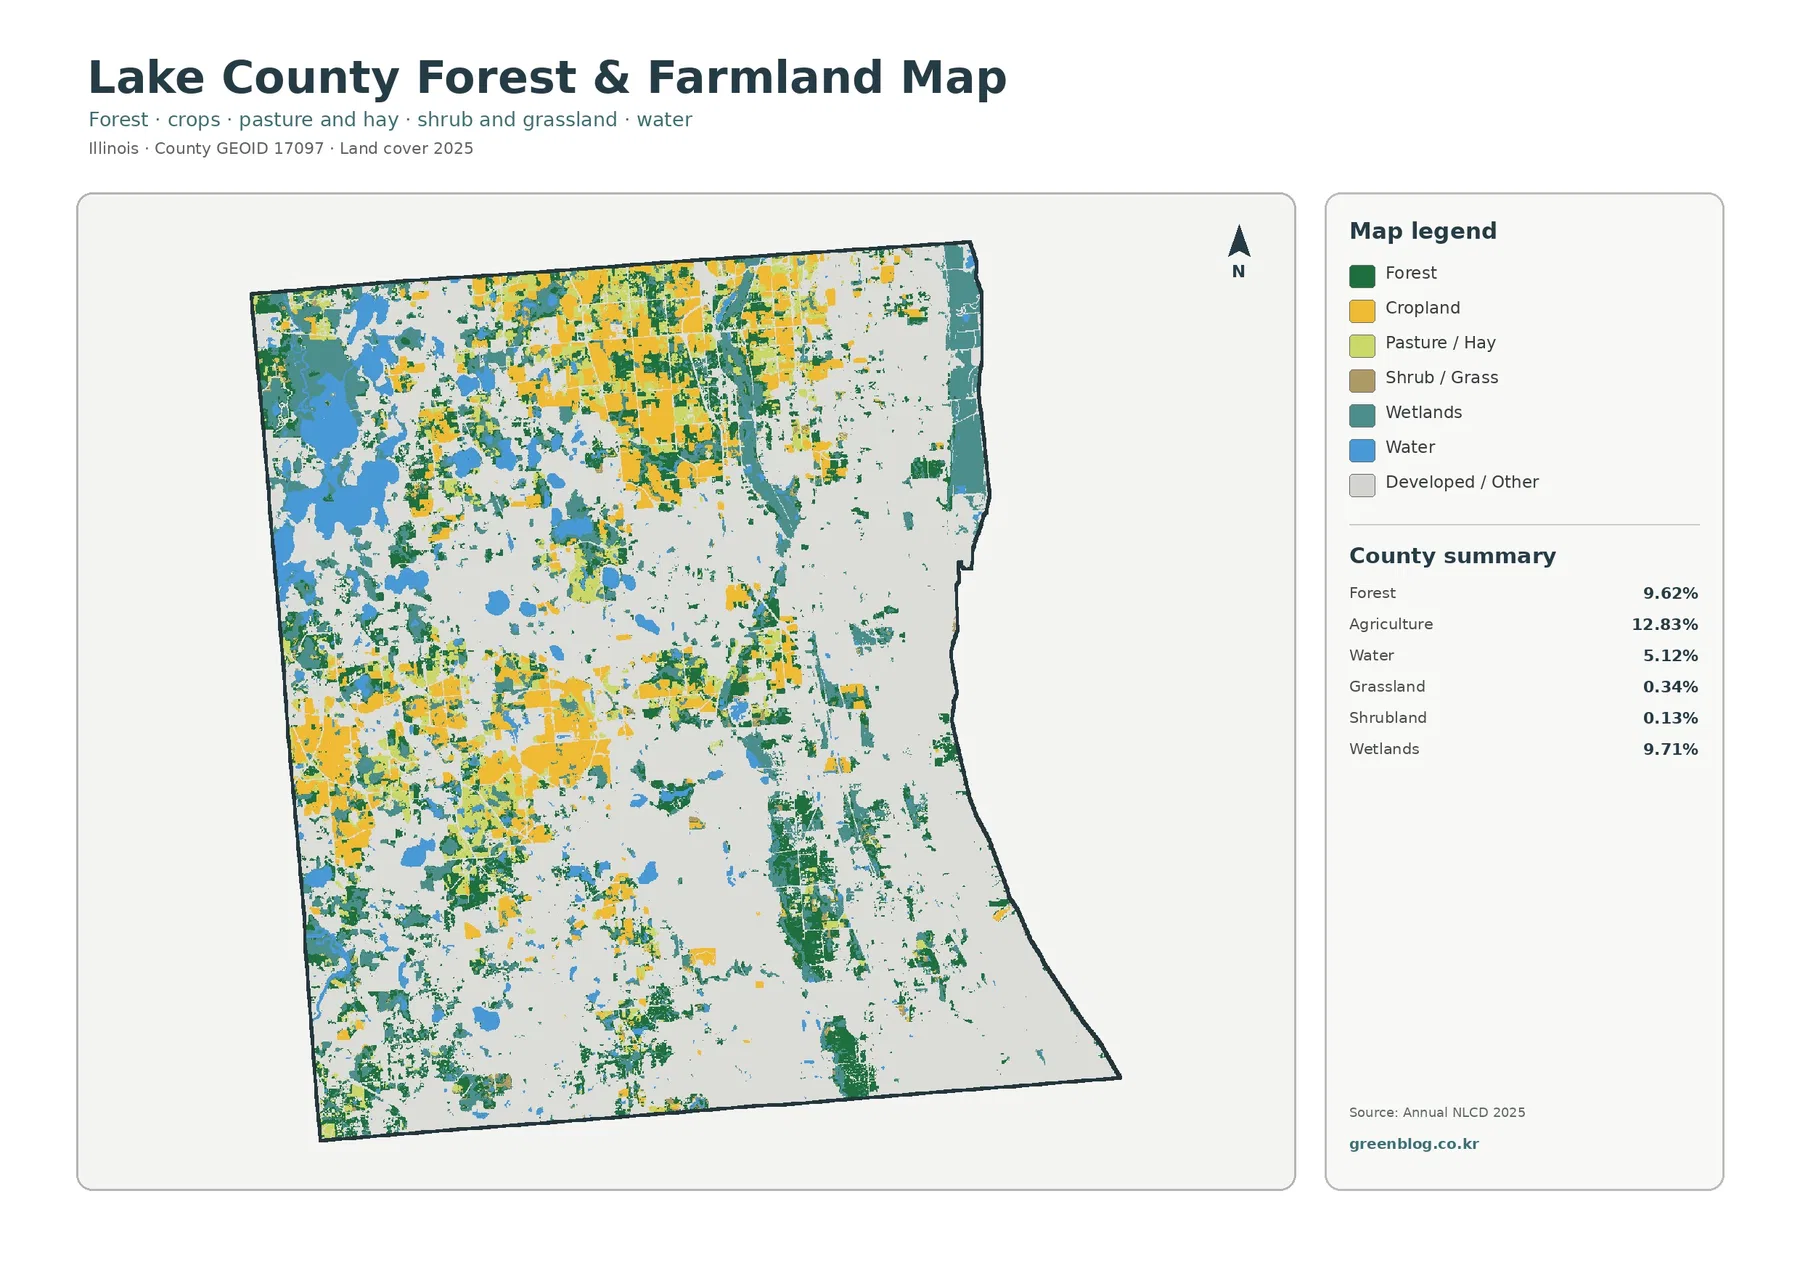
Forest is closely associated with many of the western water bodies and also appears as scattered patches through the central and southern parts of the county. A narrow, more continuous green area is visible south of center, while smaller wooded pieces fill gaps between developed areas elsewhere. Because forest is not arranged as one large block, the map is most useful for identifying where wooded cover persists within a highly developed county.
The 1985–2025 comparison contains a large developed-class component
The change map reports 28.27% of Lake County with a different mapped class between 1985 and 2025. Cells classified as developed in 2025 account for 15.30%, while forest loss is 0.23%, agricultural loss is 0.95%, and other class difference is 11.31%. The developed and other categories together make up most of the summarized difference.
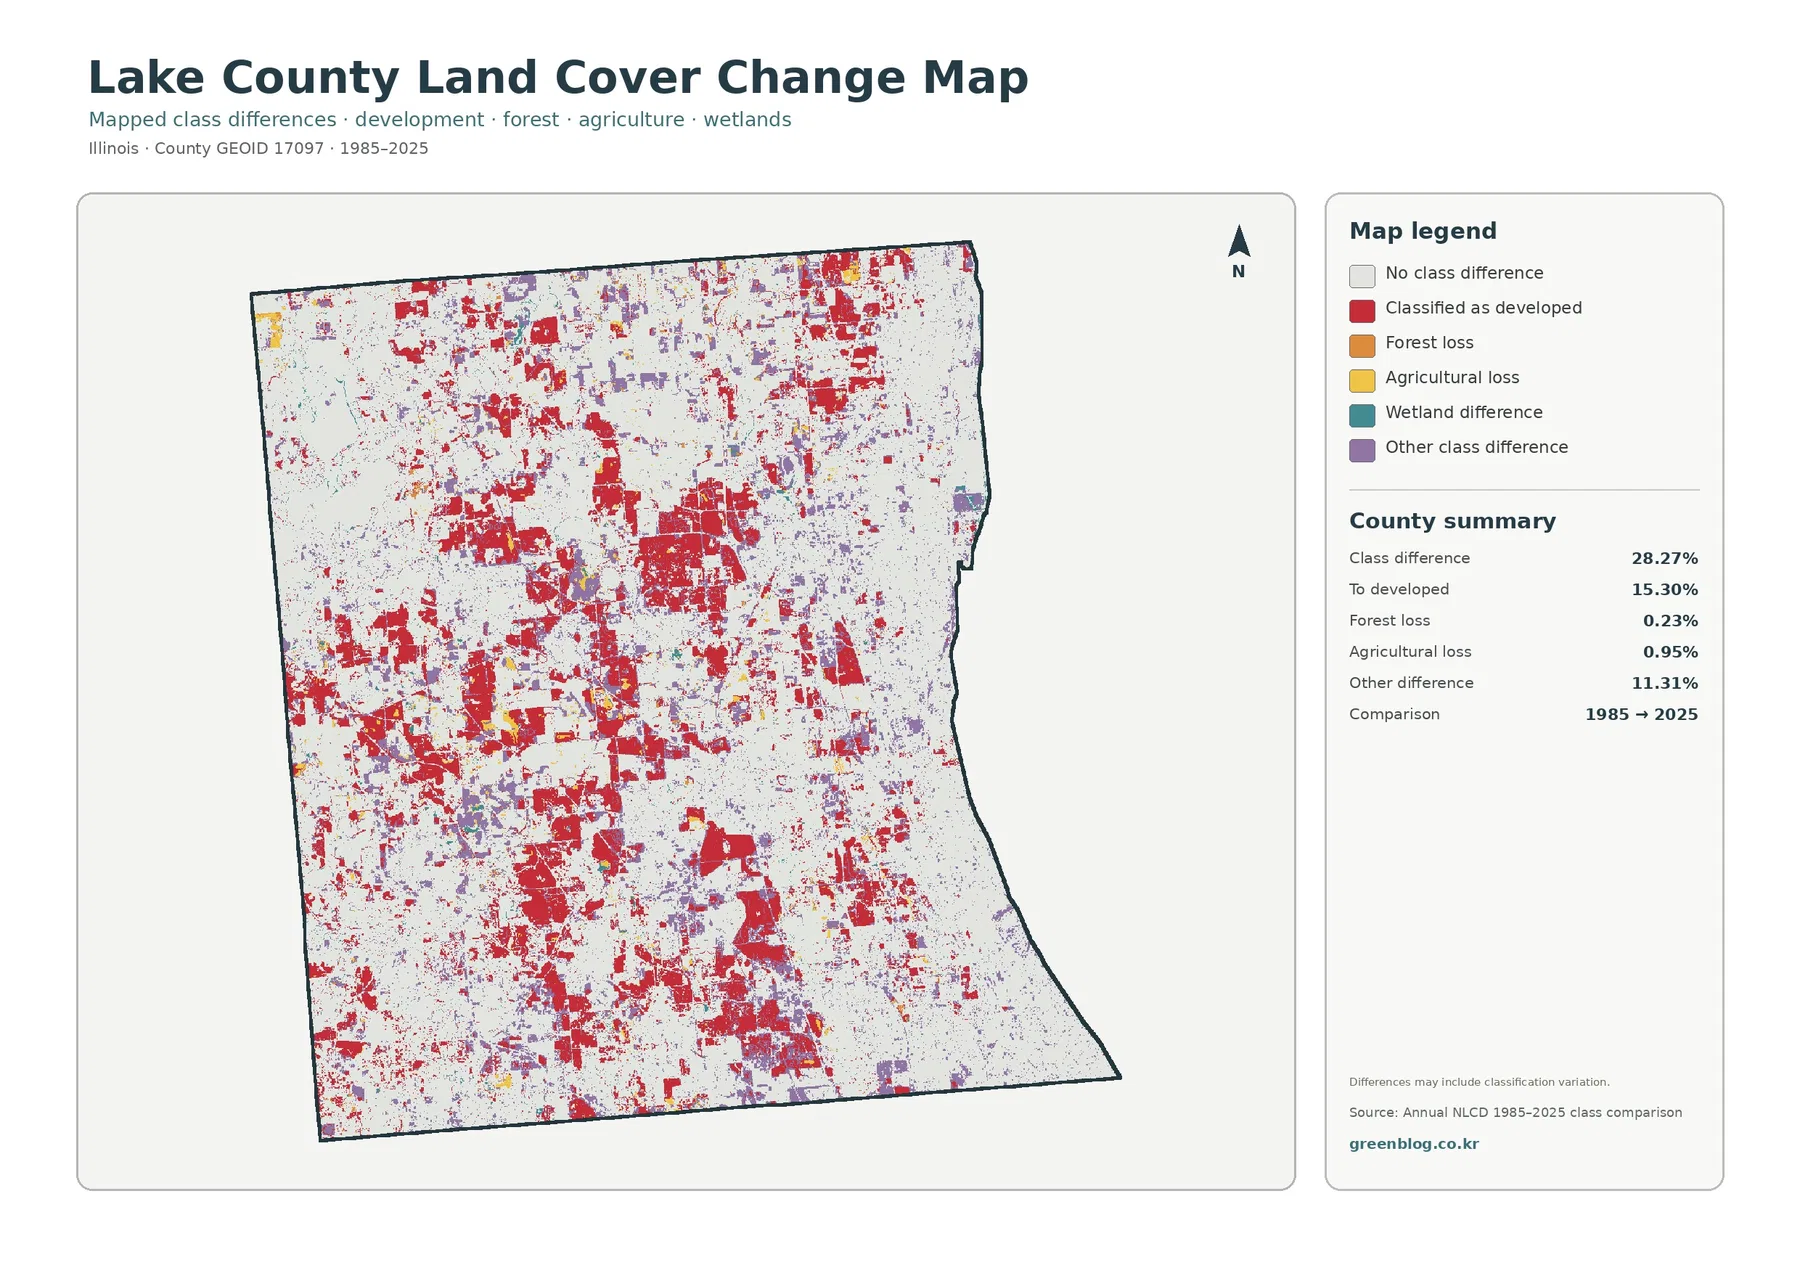
Red developed differences appear across many parts of the county, including broad central, southwestern, northern, and northeastern clusters. Purple other-class differences fill numerous gaps between those red areas and occur as both small cells and larger patches. The map therefore looks substantially more active than many rural counties where most of the surface remains in the no-difference class.
Forest-loss and agricultural-loss colors occupy much smaller shares. Their patches are scattered rather than forming one broad conversion front. A class difference can represent real surface change, but imagery conditions, vegetation, moisture, classification methods, and mixed pixels can also affect the comparison. The map itself notes that classification variation may be included, so site-specific conclusions need supporting imagery or local records.
Each map answers a different question about a heavily developed county
Thirty-meter raster cells simplify small lakes, wetland edges, roads, and mixed developed surfaces
Annual NLCD products are commonly represented with roughly 30-meter raster cells. A raster divides the ground into a grid and assigns each cell a representative class or value. Where a cell contains several surfaces—such as water beside wetland vegetation, a road through trees, or buildings beside lawns—the mapped result may simplify that mixture into one class or impervious value.
This limitation matters in Lake County because many water bodies and wetland boundaries are irregular, while the developed east contains a dense mix of roads, buildings, trees, lawns, and small open areas. The map is not a parcel survey. Developed classes do not define zoning or building rights, forest colors do not identify ownership, and wetland colors do not establish legal wetland limits.
Frequently Asked Questions
What is the largest 2025 land-cover class in Lake County?
Developed land is the largest at 61.72%. Agriculture is 12.83%, wetlands 9.71%, forest 9.62%, and water 5.12%. The west and northwest contain a more varied mix than the heavily developed east.
What does a 21.88% mean impervious value indicate?
It means hard surfaces such as pavement, parking lots, and rooftops occupy a substantial share of the county on average. Areas at 50% impervious or greater cover 17.39%, with the strongest concentrations in the east and southeast.
Does the 28.27% 1985–2025 class difference equal physical land-use change?
Not necessarily. Real surface change may be included, but imagery, vegetation, moisture, classification methods, and mixed pixels can also affect the comparison. Developed-class difference is 15.30% and other difference is 11.31%.
Map File Information
The download combines four original JPG maps for Lake County: 2025 land cover, forest and farmland, impervious/developed land, and the 1985–2025 land-cover class comparison.
- Included Versions: Land Cover Map, Forest & Farmland Map, Impervious/Developed Land Map, and 1985–2025 Land Cover Change Map
- File Type: One ZIP containing four JPG files
- Intended Use: developed/natural-cover comparison, water and wetland review, impervious-surface analysis, class-change reference, printing, teaching, and presentations
Related Maps
- Adams County Illinois Land Cover Map
- Alexander County Illinois Land Cover Map
- Bond County Illinois Land Cover Map
Sources and references
- MRLC Annual NLCD Data – official access point for Annual NLCD land-cover and impervious-surface products.
- USGS Annual NLCD Land Cover Classification – official documentation for land-cover classes and raster interpretation.
- U.S. Census Bureau TIGER/Line Shapefiles – official geographic boundary source for Lake County.
Green Map creates custom-edited map images using open geographic data sources such as geoBoundaries, Natural Earth, OpenStreetMap, and government open data. These maps are edited visual materials, not raw data files, and are provided for education, documents, presentations, and graphic reference.