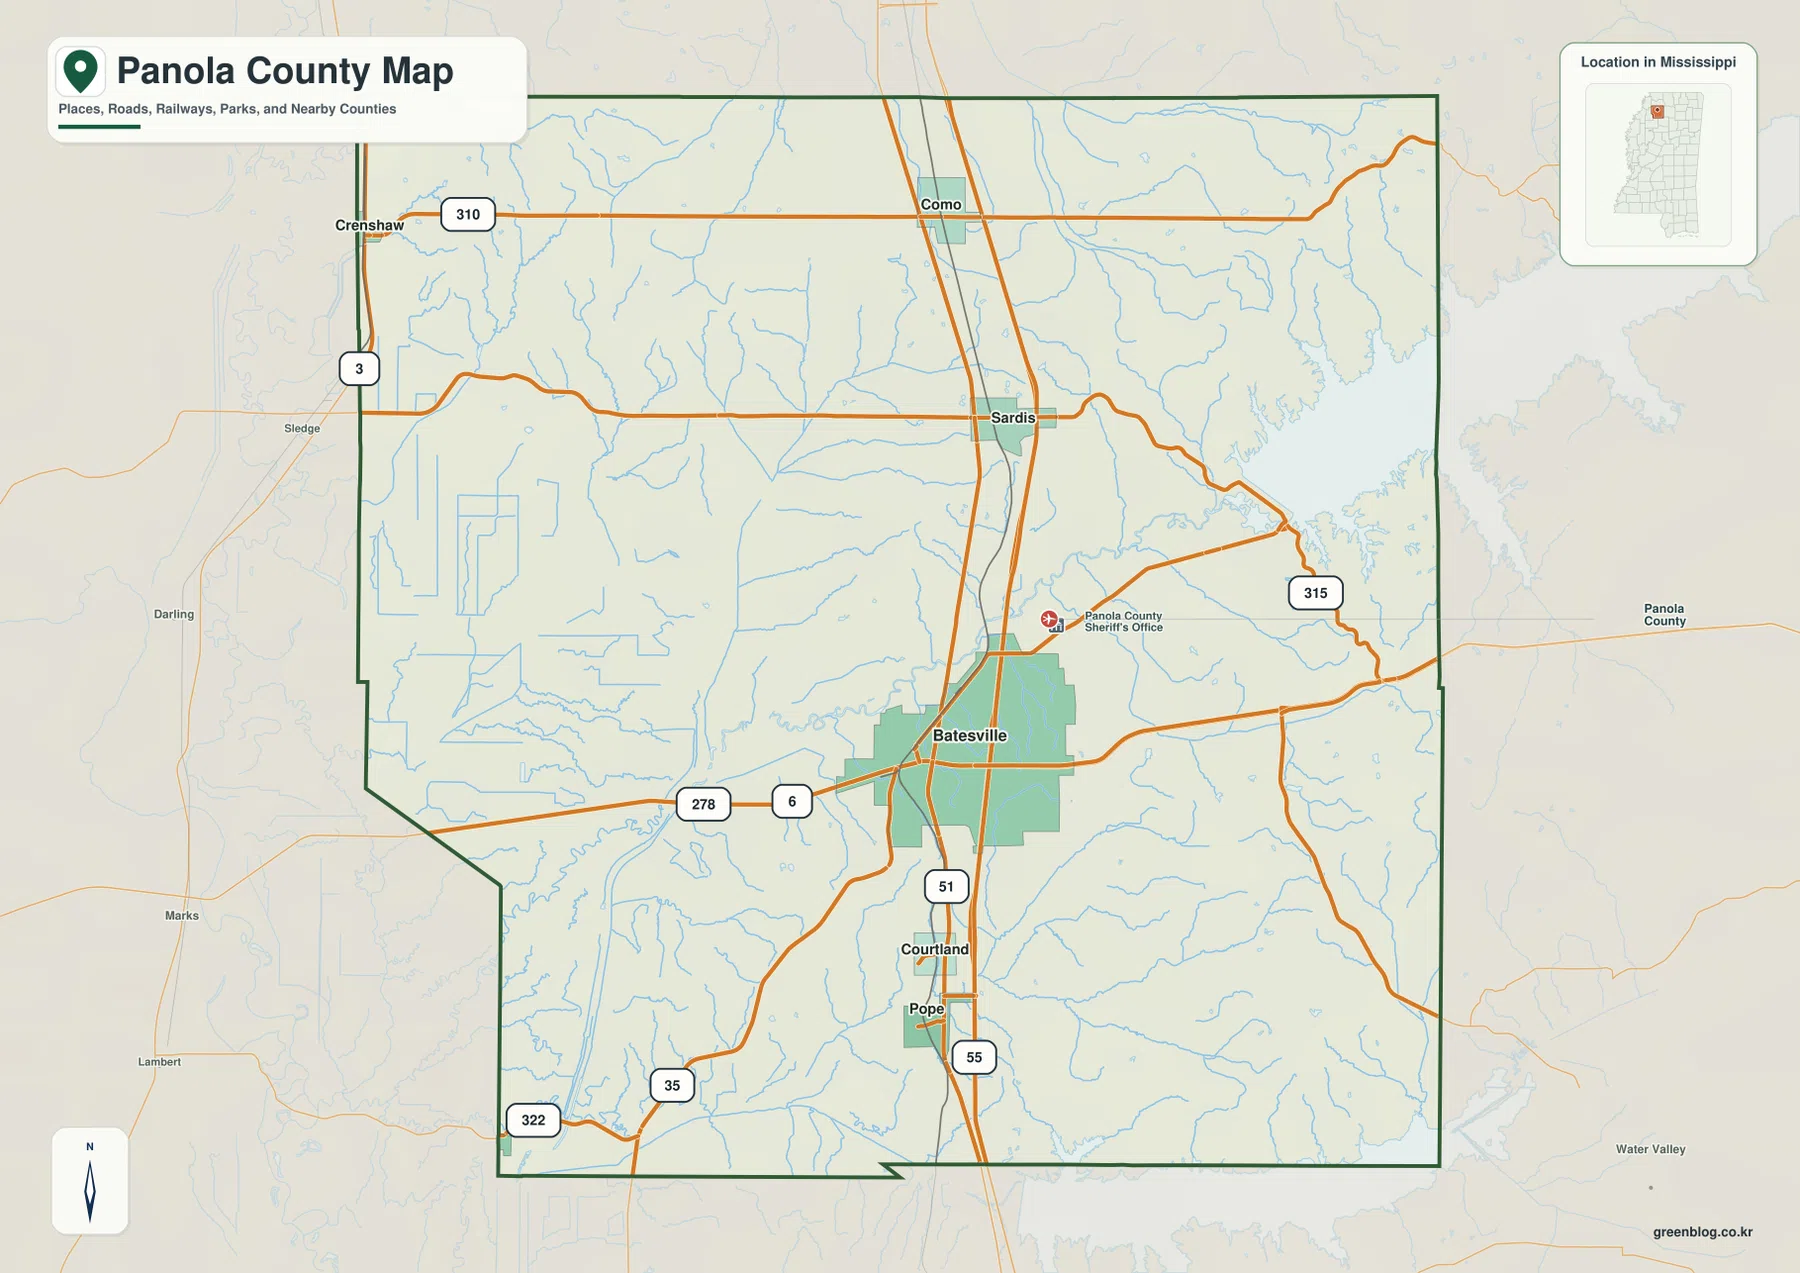
You can download the high-resolution JPG map files for Panola County, Mississippi, from this page, but the maps are most useful when the county is viewed as a meeting place between several different landscapes. Batesville and Sardis sit along the I-55 and US 51 corridor, Sardis Lake occupies a large area toward the east, and the western side opens into much lower, flatter ground. The four supplied maps separate those features into county orientation, city distribution, waterways, and elevation so that roads, settlements, lakes, streams, and terrain can be compared without crowding everything into one image.
A good way to begin is with Batesville in the central-southern part of the county and Sardis farther north. Both are identified as county seats in the supplied material, and both lie close to the same north-south transport corridor. From there, Como extends the corridor toward the northern boundary, while Courtland and Pope provide reference points to the south. The eastern side changes character around Sardis Lake and the Little Tallahatchie River, while the elevation map shows broad low country in the west and more dissected hills in the east and southeast. That combination gives Panola County a map pattern that is quite different from a county with one dominant town and a nearly uniform landscape.
Table of Contents
Batesville and Sardis organize the county around one north-south corridor
Batesville is the easiest place to use as an internal reference. On the county map it sits near I-55 and US 51, while US 278 and MS 6 cross the area from west to east. That makes it a useful point for comparing the western and eastern halves of the county as well as the routes toward neighboring counties. Sardis lies north of Batesville, also near I-55 and US 51, with roads extending east toward the Sardis Lake area. Como is farther north on the same general axis. Together, these three places create a clear sequence through the northern and central part of Panola County.
South of Batesville, Courtland and Pope are placed close to the main corridor, while MS 35 and MS 322 help define the southwestern part of the county. Crenshaw is different: it lies near the northwestern boundary, separated from the tighter chain of places near I-55. MS 310 runs across the north near Crenshaw and Como, and MS 315 appears on the eastern side near the lake approaches. The map does not attempt to show every farm road, driveway, or small local street. Its strength is the larger pattern—where the principal communities sit, how the main routes cross the county, and how the road network changes as it approaches the lake and lower western country.
The six mapped communities form a long, uneven settlement pattern
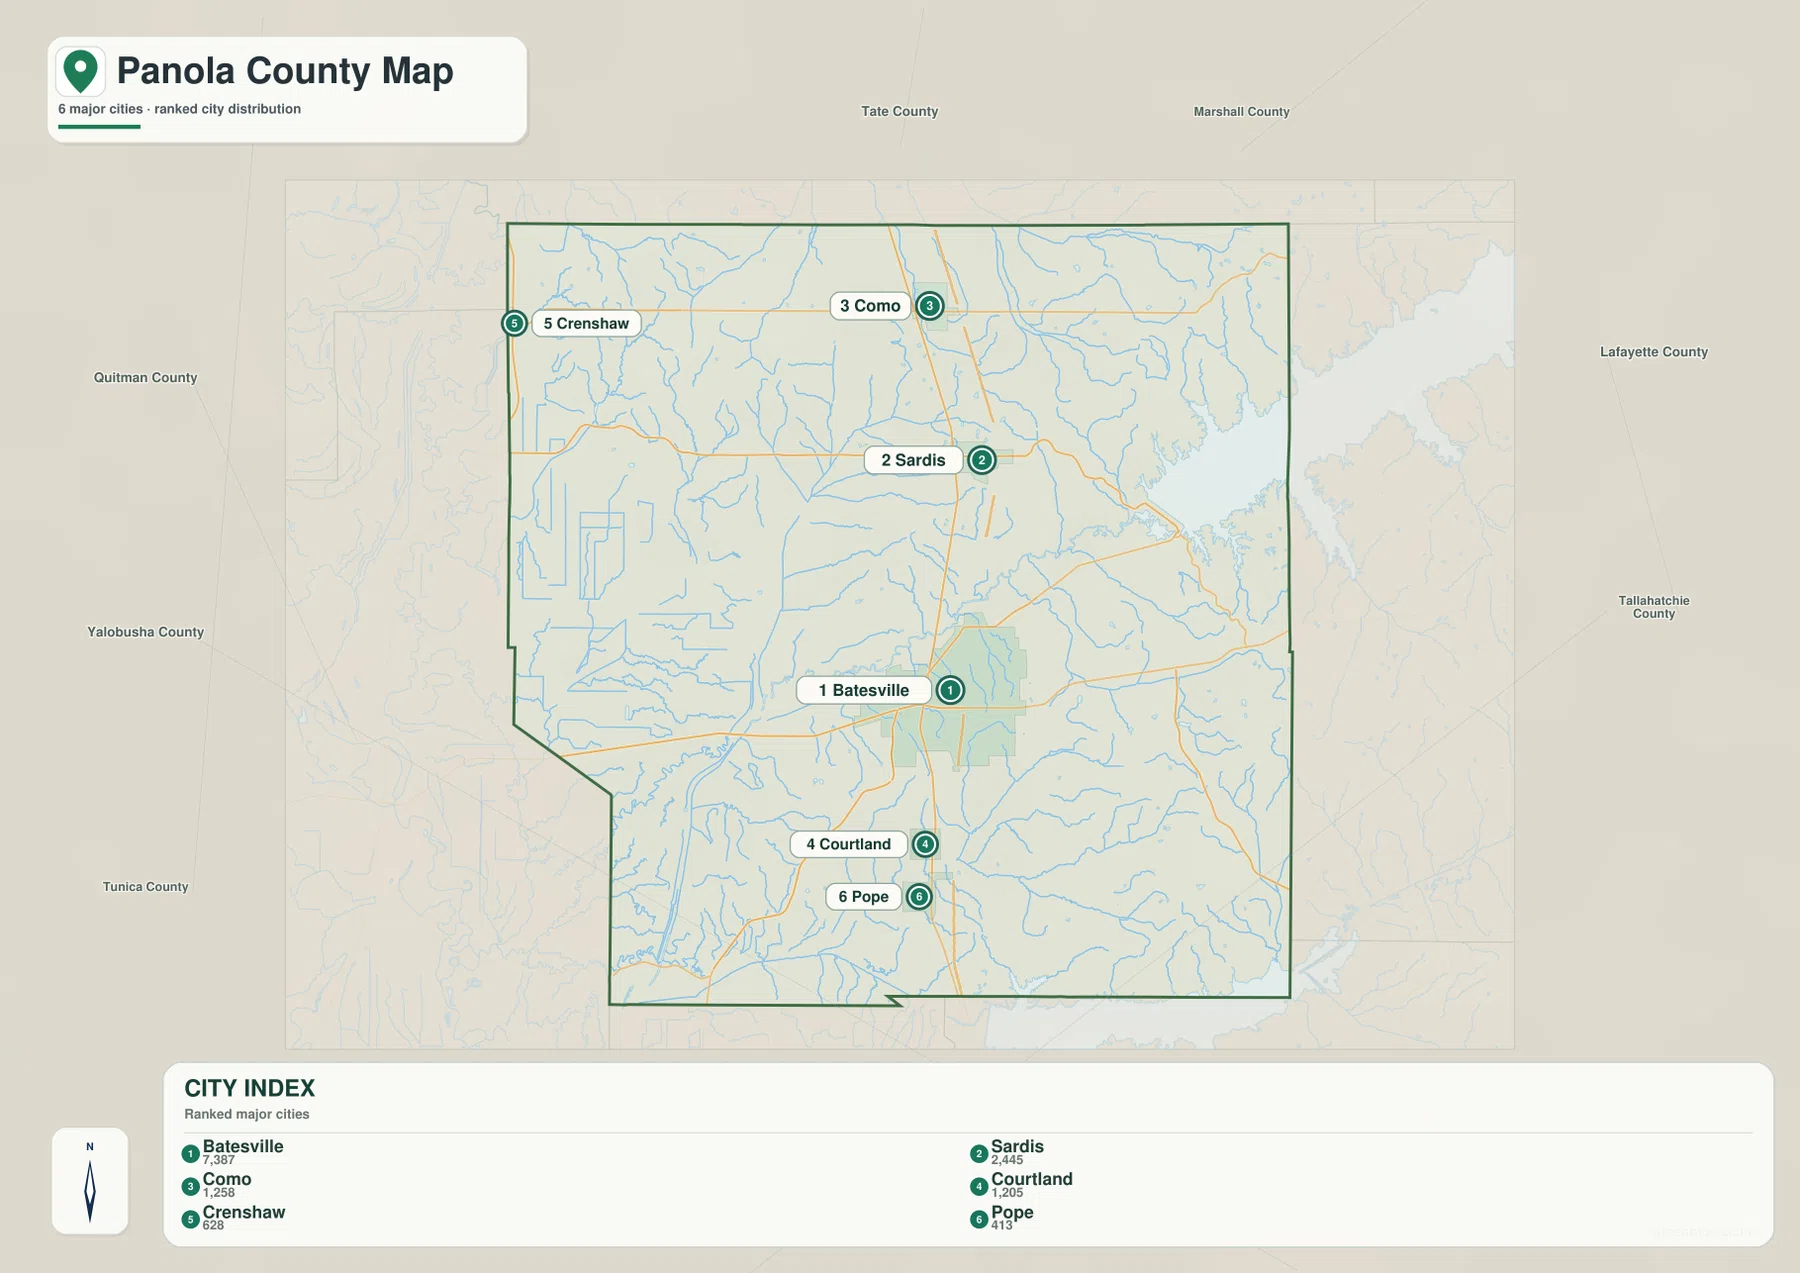
The city distribution map ranks six major places and makes their spacing easier to compare than the general county map. Batesville is listed at 7,387, making it the largest of the six mapped communities. Sardis follows at 2,445, Como at 1,258, Courtland at 1,055, Crenshaw at 628, and Pope at 413. These figures are map labels for the selected communities, not a replacement for countywide population statistics. What matters most here is the pattern: five of the six places are positioned relatively close to the central north-south corridor, while Crenshaw stands apart near the northwestern edge.
The surrounding county labels also help orient the distribution. Tate County lies to the north, Marshall County toward the northeast, and Lafayette County to the east. Tallahatchie and Yalobusha counties appear along the southeastern and southern side, while Quitman and Tunica counties frame much of the west and southwest. This makes Como and Sardis useful for understanding the northern approach, Batesville the strongest central reference, and Courtland and Pope useful for the southern half. The city map is best read as a relative-location graphic; any connector or spacing shown should be treated as straight-line geographic relationship rather than driving distance or travel time.
Sardis Lake feeds into a wider network of rivers, creeks, and low channels
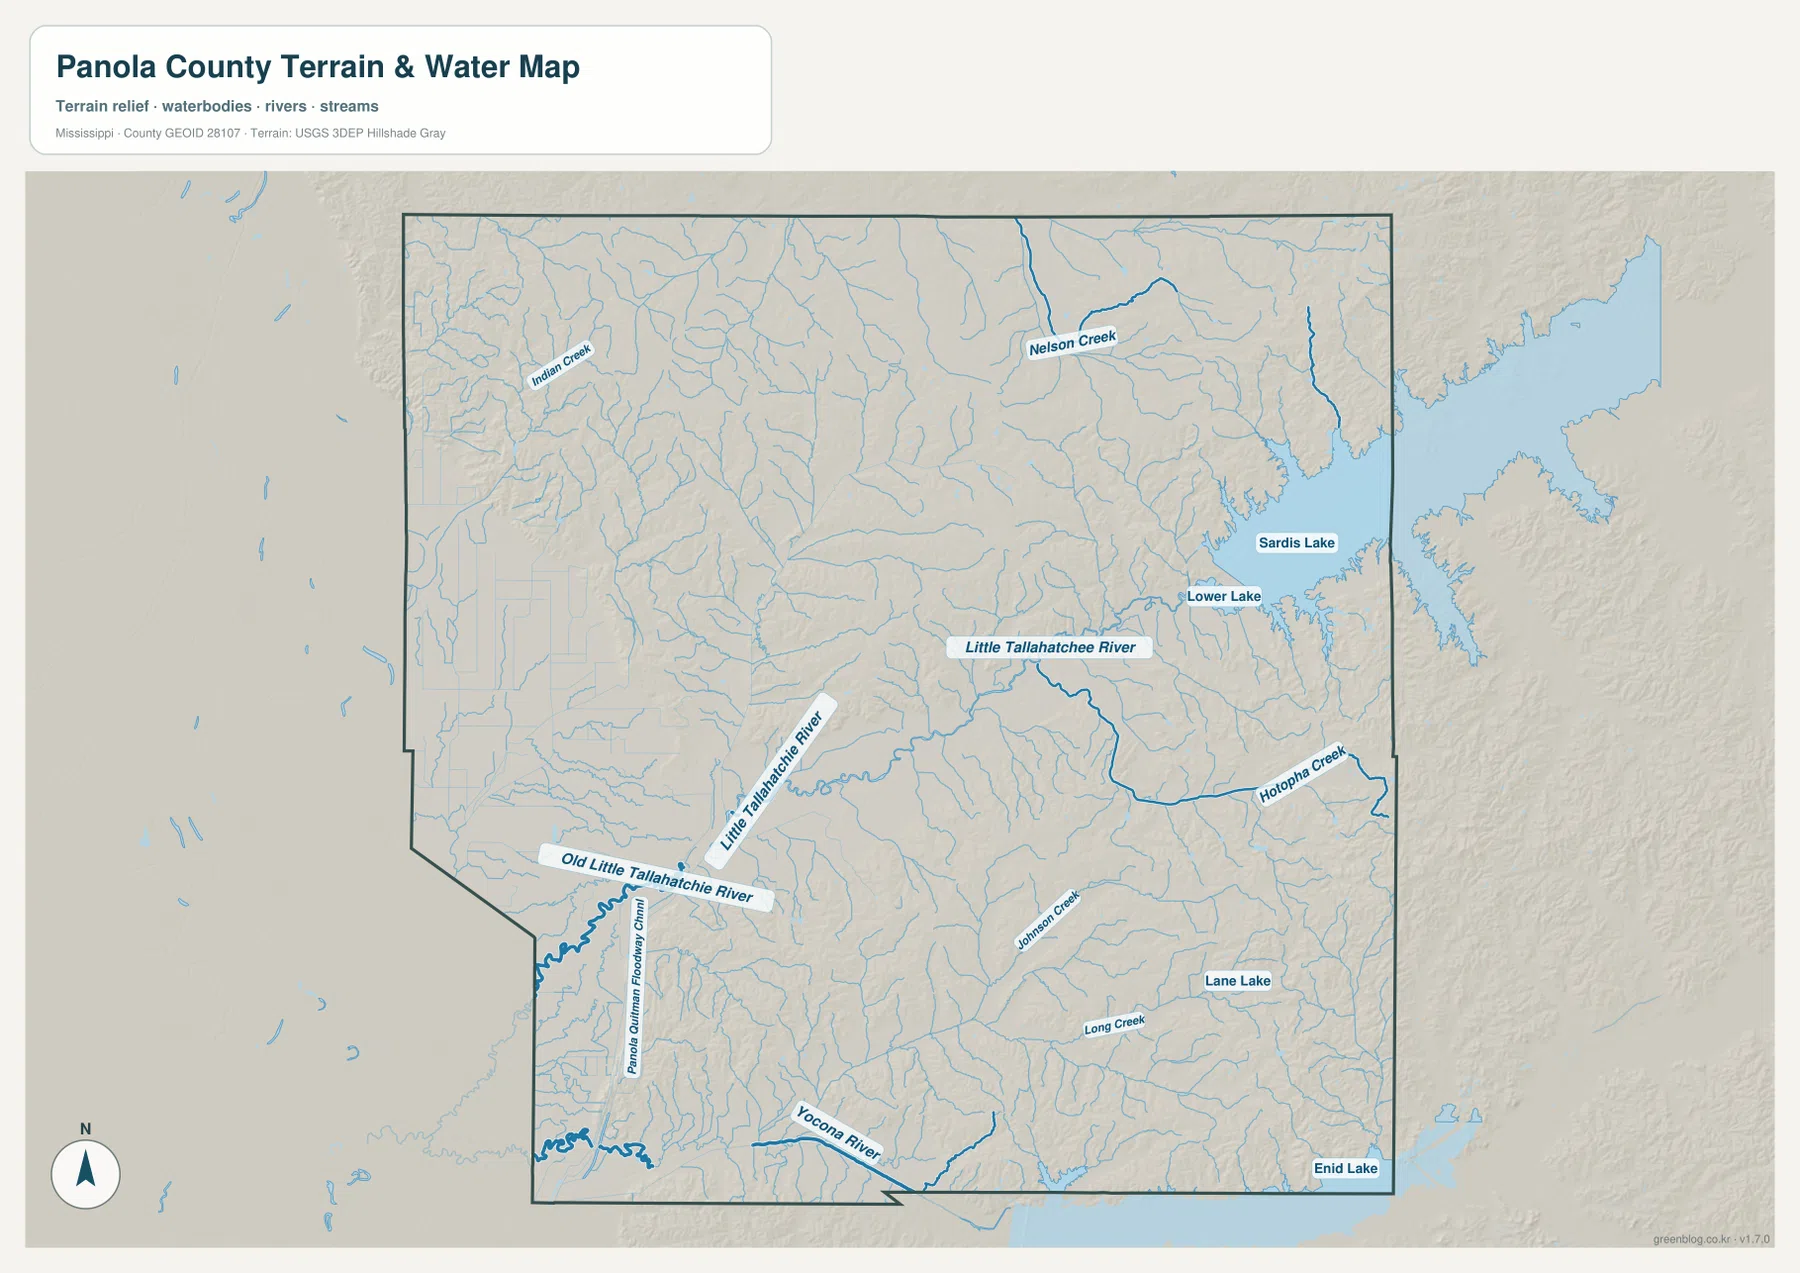
Sardis Lake is the most visually prominent water body in the supplied terrain and water map. It occupies a broad area on the eastern side, with Lower Lake labeled just to its southwest. The Little Tallahatchie River then continues westward through the county, becoming a strong geographic guide across the middle. Farther southwest, the Old Little Tallahatchie River and the Panola Quitman Floodway Channel appear in the lower, flatter part of the county. Seen together, these features show that the large lake and the western lowlands are connected by a broader drainage system rather than existing as isolated blue areas on the map.
Several smaller named waters add detail without changing that main pattern. Indian Creek and Nelson Creek are labeled in the north. Hotopha Creek appears east of the central river corridor, while Johnson Creek and Long Creek are farther south. Lane Lake is shown in the southeastern interior, and the Yocona River and Enid Lake appear close to the southern edge of the mapped area. These labels are useful for comparing where channels become denser and how the streams line up with lower terrain. The water map is not a flood-risk product, a parcel map, a navigation chart, or a statement about legal water boundaries. It is a geographic reference for the location and relationship of lakes, rivers, and selected streams.
Elevation changes sharply from the western lowlands to the eastern hills
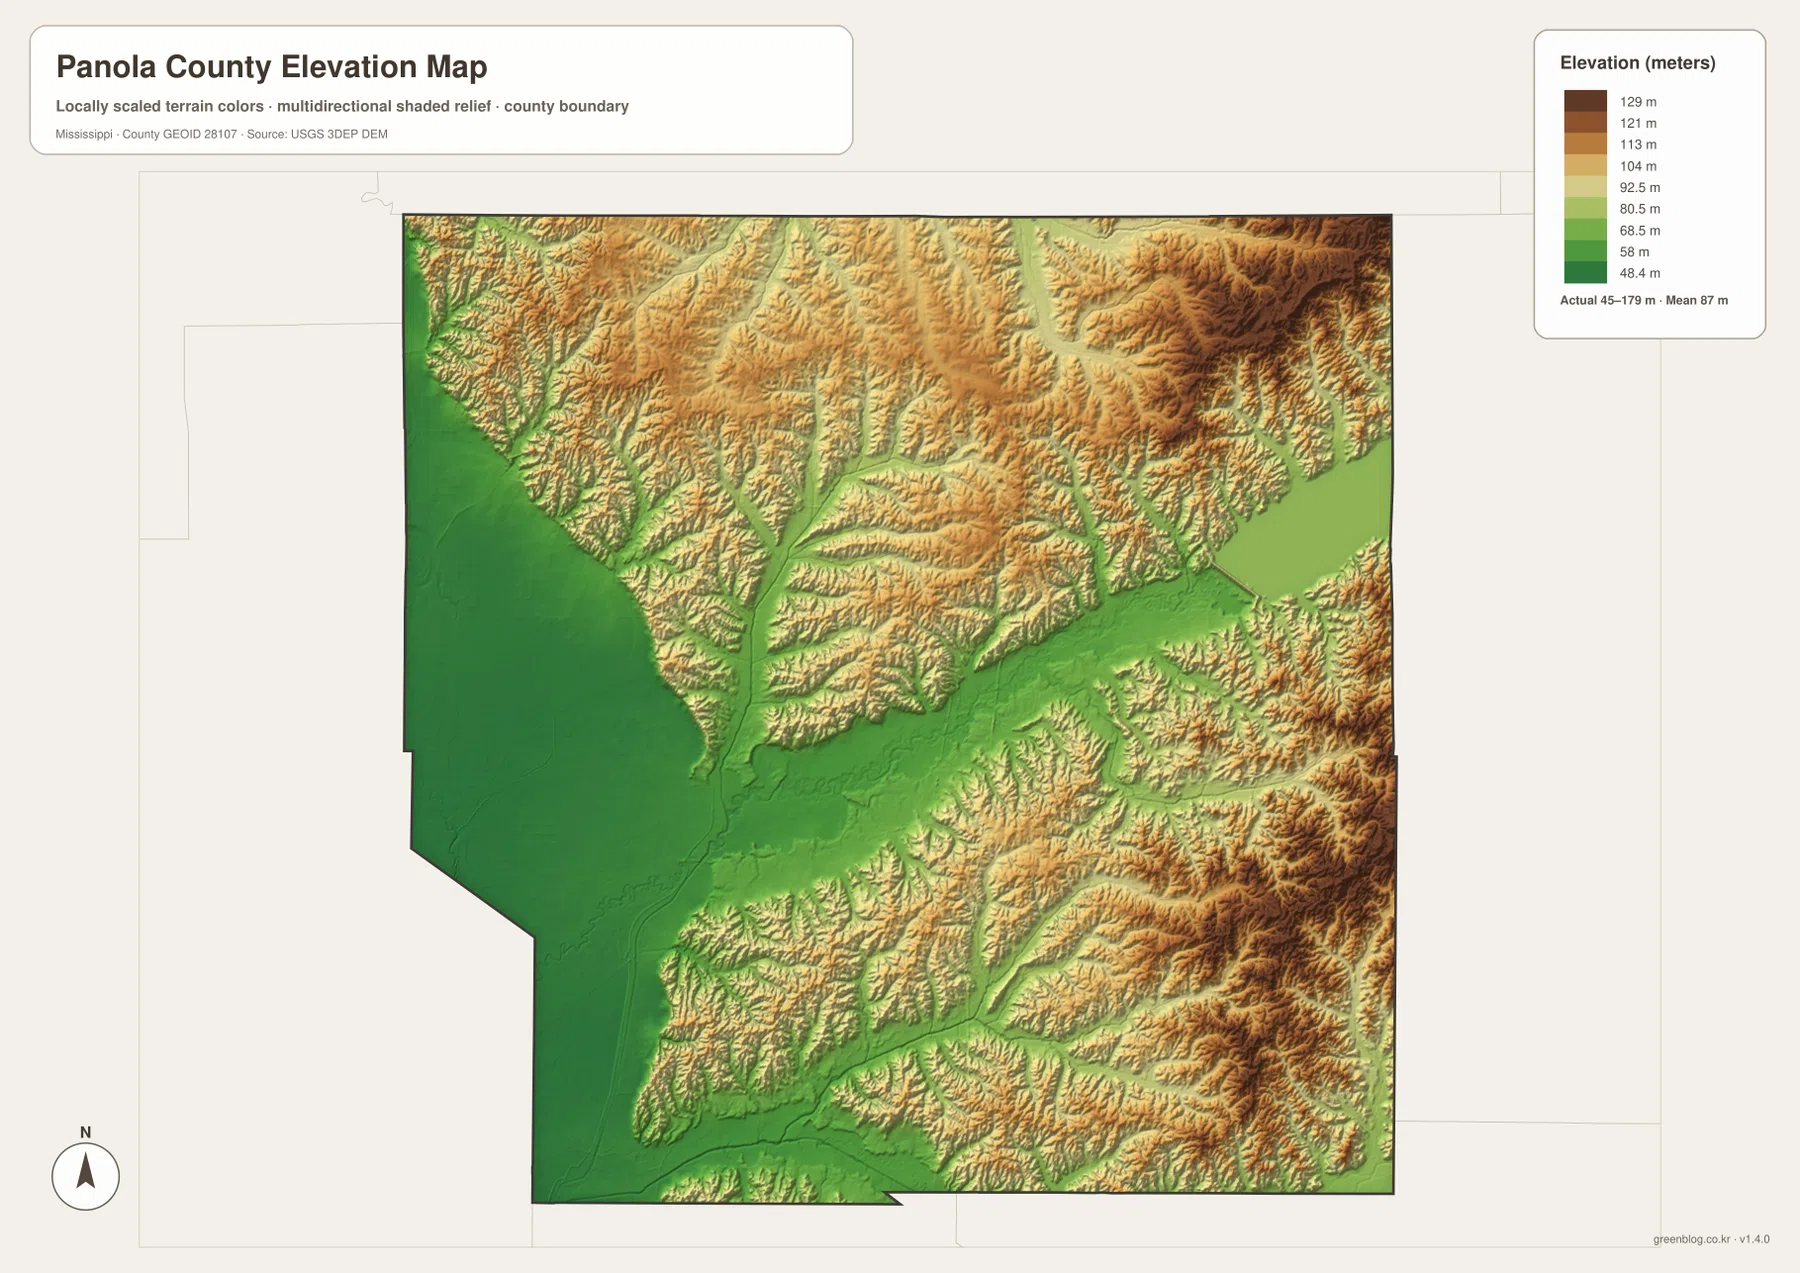
The elevation map gives the clearest explanation for the county’s east-west contrast. The map reports an actual elevation range of about 45 to 179 meters, with a mean of 87 meters. Large areas in the west and southwest are shaded in the lowest colors and appear relatively smooth. Moving east, the surface becomes more broken by ridges and valleys, with higher ground especially visible in the northeast, east, and southeast. This is not a subtle change: the western side reads as broad low country, while the eastern side contains repeated narrow hills and drainage cuts.
The central Little Tallahatchie River corridor forms a lower path through that higher terrain. Around Sardis Lake, low ground associated with the water extends into areas bordered by more elevated ridges. Farther south, several green valley corridors cut through warmer-colored hills before reaching the lower western and southern areas. Comparing the elevation map with the water map explains why so many named streams bend through these lower corridors. The elevation surface is generalized for countywide comparison; it should not be treated as survey-grade or engineering-grade elevation for a specific property or construction site.
Population and area figures add scale without replacing the map pattern
The supplied county statistics list a 2020 census population of 33,208 and a July 2025 estimate of 32,691. Those figures come from different reference dates, so they should not be read as if they were two results from the same survey cycle. The 2025 Gazetteer figures list 685.180 square miles of land and 19.952 square miles of water. Using the 2020 population with the 2025 land area produces a countywide density of about 48.5 residents per square mile. FIPS 28107 is the supplied identifier for Panola County.
The density number is useful for broad comparison, but the city and terrain maps show why an average can hide local differences. Batesville is clearly the largest mapped community, and several other towns follow the I-55/US 51 corridor. At the same time, the county includes extensive low ground in the west, a large water body in the east, and more rugged hills along the eastern side. Reading the population figure together with the maps gives a more realistic picture than assuming people are evenly spread across all 685 square miles of land.
Choose the map that matches the question you need to answer
For a quick orientation, begin with the county reference map. It is the most direct way to locate Batesville, Sardis, Como, Courtland, Pope, and Crenshaw in relation to I-55, US 51, US 278/MS 6, and the county boundary. If your question is about settlement rather than roads, the city distribution map removes much of the extra detail and makes the six labeled communities easier to compare. That is especially helpful for seeing how Crenshaw differs from the places aligned closer to the main central corridor.
Use the water map when Sardis Lake, the Little Tallahatchie River, or the smaller tributaries are the main subject. Pair it with the elevation map when you want to understand why the western side looks flatter or why stream valleys stand out in the eastern hills. For classroom work, presentations, or personal reference, the four maps can be used together, but there is no need to show all of them when one answers the question more clearly. The downloadable JPG files retain the full supplied image dimensions of 3638 by 2572 pixels, while the WebP versions in the article are optimized for on-page viewing.
Frequently Asked Questions
Why are both Batesville and Sardis important on a Panola County map?
The supplied material identifies Batesville and Sardis as county seats serving separate judicial districts. Their map positions also make them useful geographic anchors. Batesville sits at a major central road junction, while Sardis lies farther north on the I-55 and US 51 corridor and provides a reference for the approach toward Sardis Lake. Looking at both places gives a clearer picture of the county than treating only one as the administrative center.
Is the city of Sardis in the same place as Sardis Lake?
No. Sardis is shown near the I-55 and US 51 corridor in the northern-central part of the county, while the large body of Sardis Lake extends well to the east. Comparing the county map with the water map makes the separation clear and also shows how roads from the Sardis area lead toward the lake.
What does the 45–179 meter elevation range tell me about Panola County?
It shows that the county has a substantial internal terrain contrast. The broad western side is low and relatively smooth, while the east and southeast contain higher, more closely spaced ridges and valleys. The Little Tallahatchie River follows one of the lower corridors through the middle, which is why the water and elevation maps make more sense when viewed together.
Map File Information
Download the original high-resolution JPG versions of all four Panola County maps in one ZIP file. The archive contains the county reference, city distribution, water, and elevation maps used in this article.
- Included Files: County map, city map, water map, elevation map
- File Type: ZIP containing four JPG files
Related Maps
Sources and References
- U.S. Census Bureau QuickFacts — county population reference
- U.S. Census Bureau 2025 Gazetteer Files — land and water area reference
- Mississippi Department of Transportation official highway map — principal route reference
- U.S. Army Corps of Engineers Sardis Lake — Sardis Lake regional reference
Green Map creates custom-edited map images using open geographic data sources such as geoBoundaries, Natural Earth, OpenStreetMap, and government open data. These maps are edited visual materials, not raw data files, and are provided for education, documents, presentations, and graphic reference.