An Attala County Map is easiest to read when Kosciusko is treated as the anchor rather than just another label. The county seat sits near the center of the mapped road pattern, Sallis lies to the west, and Ethel and McCool extend the settlement pattern toward the northeast. From that starting point, the county’s geography becomes more coherent: roads radiate away from Kosciusko, a dense web of creeks occupies the lower ground, and the terrain becomes noticeably higher and more broken toward the east.
Attala covers roughly 735 square miles of land, yet its population is spread across a broad rural area rather than one continuous urban footprint. That scale is important when reading the maps on this page. The distance between labeled communities, the branching waterways, and the contrast between western low ground and eastern hills all make more sense when they are viewed as parts of the same county landscape. High-resolution A3 JPG originals are available in the download box below for printing or offline use.
Table of Contents
Start with the roads that fan out from Kosciusko
On the county reference map, Kosciusko sits close to the center of a network of orange road lines. MS 12 gives a clear westward reference toward Sallis, while MS 35 and MS 43 extend south from the central area. MS 19 and MS 25 help orient the eastern and southeastern side, and the northeastern pattern leads toward Ethel and McCool. The point is not to memorize every shield at once. Instead, using Kosciusko as a hub makes it much easier to understand how different parts of the county relate to one another.
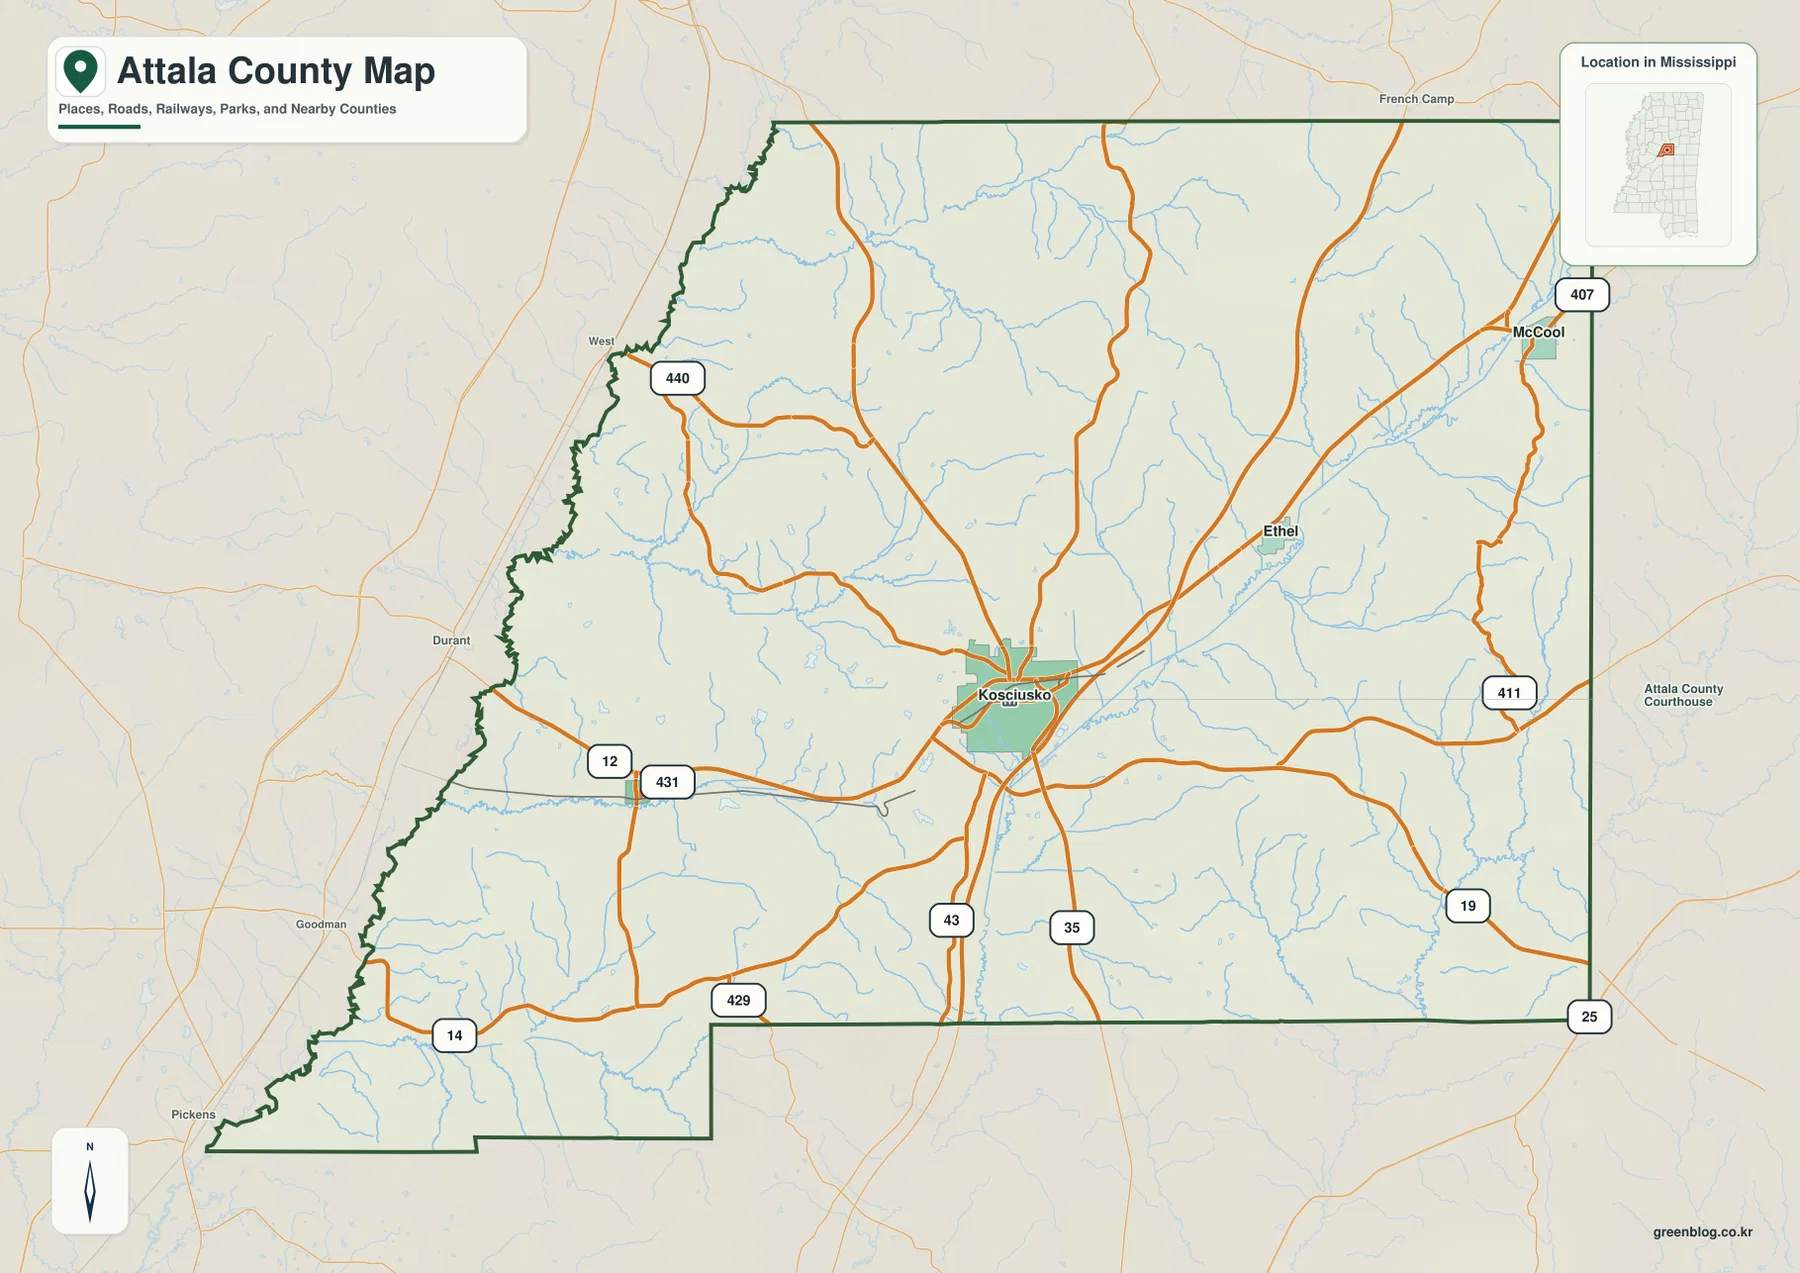
Several labels outside the boundary provide useful regional context. Durant and Goodman appear beyond the western side, Pickens lies to the southwest, and French Camp is shown north of the county. These are not destinations inside Attala, but they help a reader understand where the county sits within central Mississippi without relying only on the outline. When a route leaves Kosciusko and approaches the edge of the map, those nearby place names make the direction of travel easier to explain.
The road density also changes visibly as you move away from Kosciusko. The central junction is compact, but large outer areas contain wider gaps between major roads and far fewer settlement labels. That contrast is one reason the county should not be pictured as a single built-up area centered on the seat. Kosciusko is the strongest civic and transportation reference point on the map, while much of Attala remains rural land divided by smaller roads, stream valleys, and rolling hills.
Sallis pulls west while Ethel and McCool form a northeastern sequence
The city-connections map simplifies the county so the relationship among four labeled communities is easier to see. Sallis is west of Kosciusko and is marked at about 11 miles. Ethel lies northeast of the hub at roughly 8 miles, while McCool is farther along the same general northeastern direction at about 17 miles. Those numbers are straight-line distances between the mapped points, not driving distances along roads, so they should be used for spatial comparison rather than trip planning.
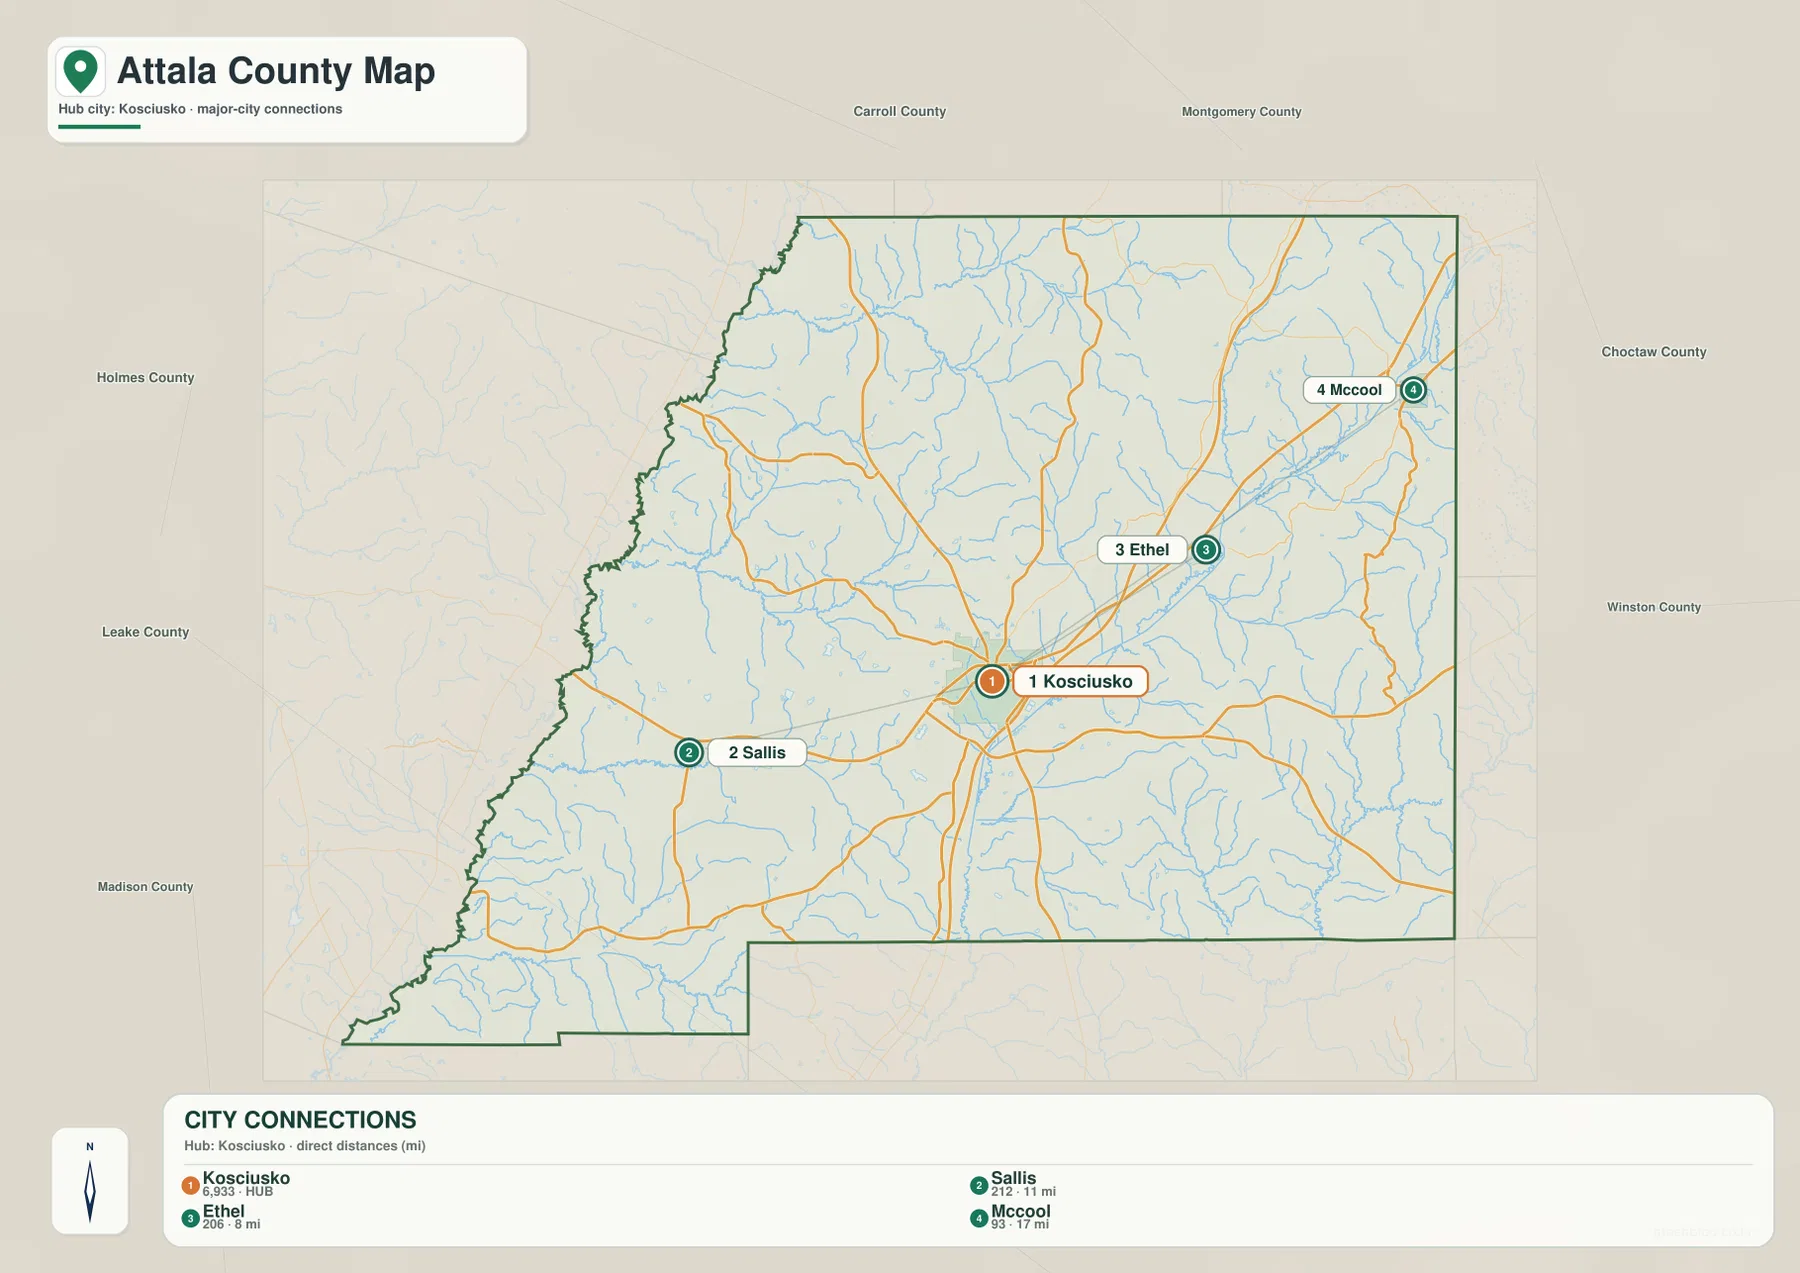
The placement of Ethel and McCool is particularly useful because a list of town names can make them sound unrelated. On the map, Ethel appears first as you move northeast from Kosciusko, and McCool sits farther out in the same broad direction. Sallis creates the opposite reference on the western side. Together, the three communities show that settlement in Attala is not concentrated against one county line; smaller places are dispersed in different directions around the central seat.
The surrounding-county labels add another layer of orientation. Carroll and Montgomery counties are shown along the northern side, Choctaw and Winston are to the east, Leake and Madison appear toward the south and southwest, and Holmes County lies west of Attala. These names matter because roads leaving Kosciusko are not merely local connectors. They lead toward different neighboring counties, giving the central road junction a broader regional role than the town-to-town map alone might suggest.
The Yockanookany and Big Black are only part of Attala’s water story
The terrain-and-water map shows why reducing Attala to one major river would be misleading. The Big Black River is an important feature near the southwestern edge, but it does not trace the entire western boundary in the supplied map. Zilpha Creek crosses the northern area, Apooka Creek is prominent in the west-central portion, and Long Creek runs across the southwest. In the northeast, the Yockanookany River becomes one of the strongest named waterways, giving the eastern half of the county a very different drainage reference from the Big Black system in the southwest.
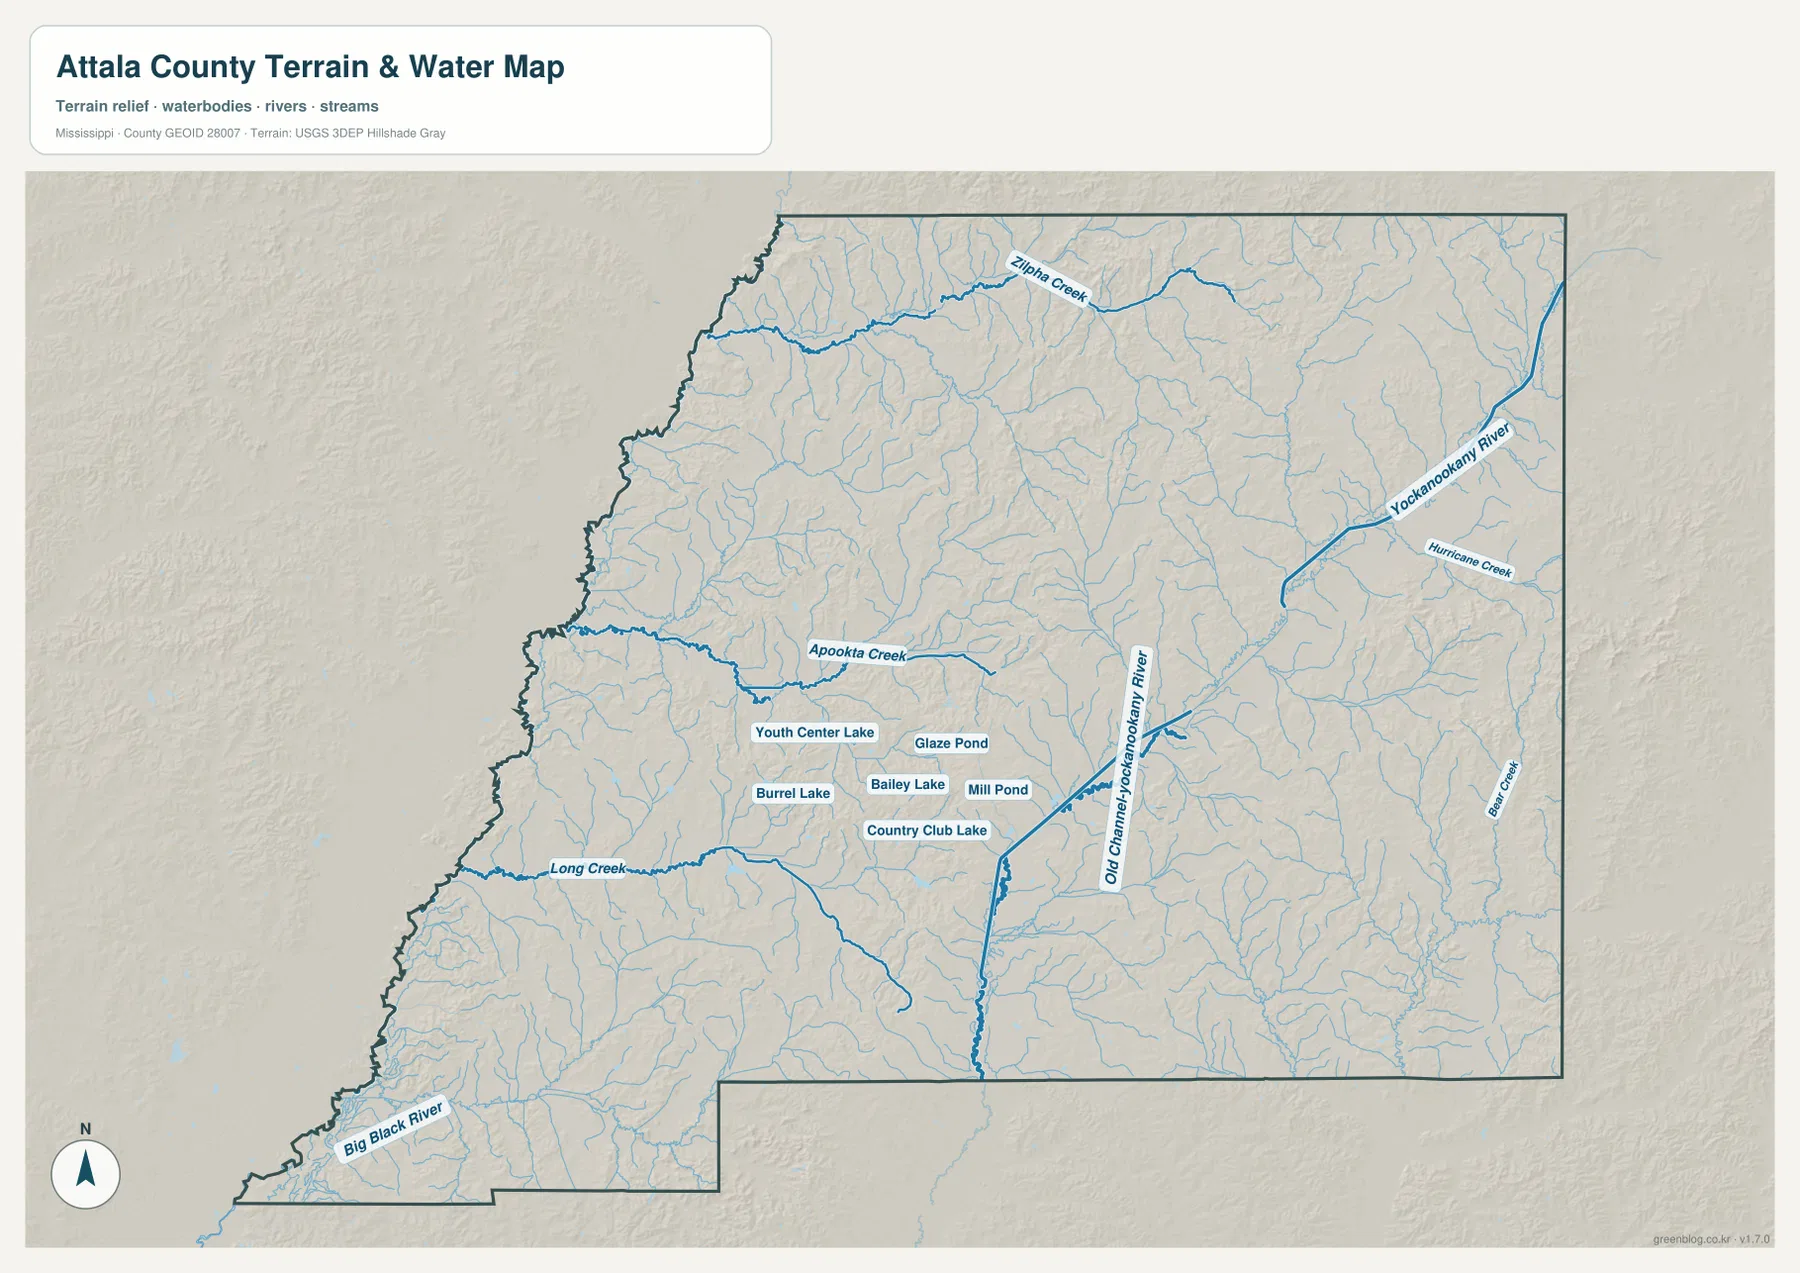
A labeled Old Channel–Yockanookany River feature runs through the central-eastern part of the map, while Hurricane Creek and Beal Creek appear farther east. Around Kosciusko, several much smaller water bodies are identified as well, including Youth Center Lake, Burrel Lake, Bailey Lake, Glaze Pond, Mill Pond, and Country Club Lake. They are not comparable in size to the named rivers, but their concentration near the central area adds detail that is easy to miss on a general road map.
This layer is best used as a location and terrain reference. It is not a flood-hazard map, parcel map, navigation chart, or statement of water rights. Its value comes from showing how numerous streams occupy lower corridors between hills. When placed beside the road map, the contrast is clear: roads are designed to connect communities and tend to form more direct routes, while natural channels branch repeatedly and bend through valleys. That difference helps explain why the county’s physical geography looks much more intricate than its basic settlement pattern.
Western low ground gives way to a much rougher eastern landscape
The elevation map provides the physical background that ties the road and water layers together. The supplied elevation surface spans about 62 to 218 meters and lists a mean of 123 meters. Lower green tones cover much of the western and southwestern side, while tan and brown terrain becomes increasingly common toward the east. The eastern and northeastern sections contain repeated narrow ridges and valleys, creating a visibly rougher surface than the broader lower terrain in the west.
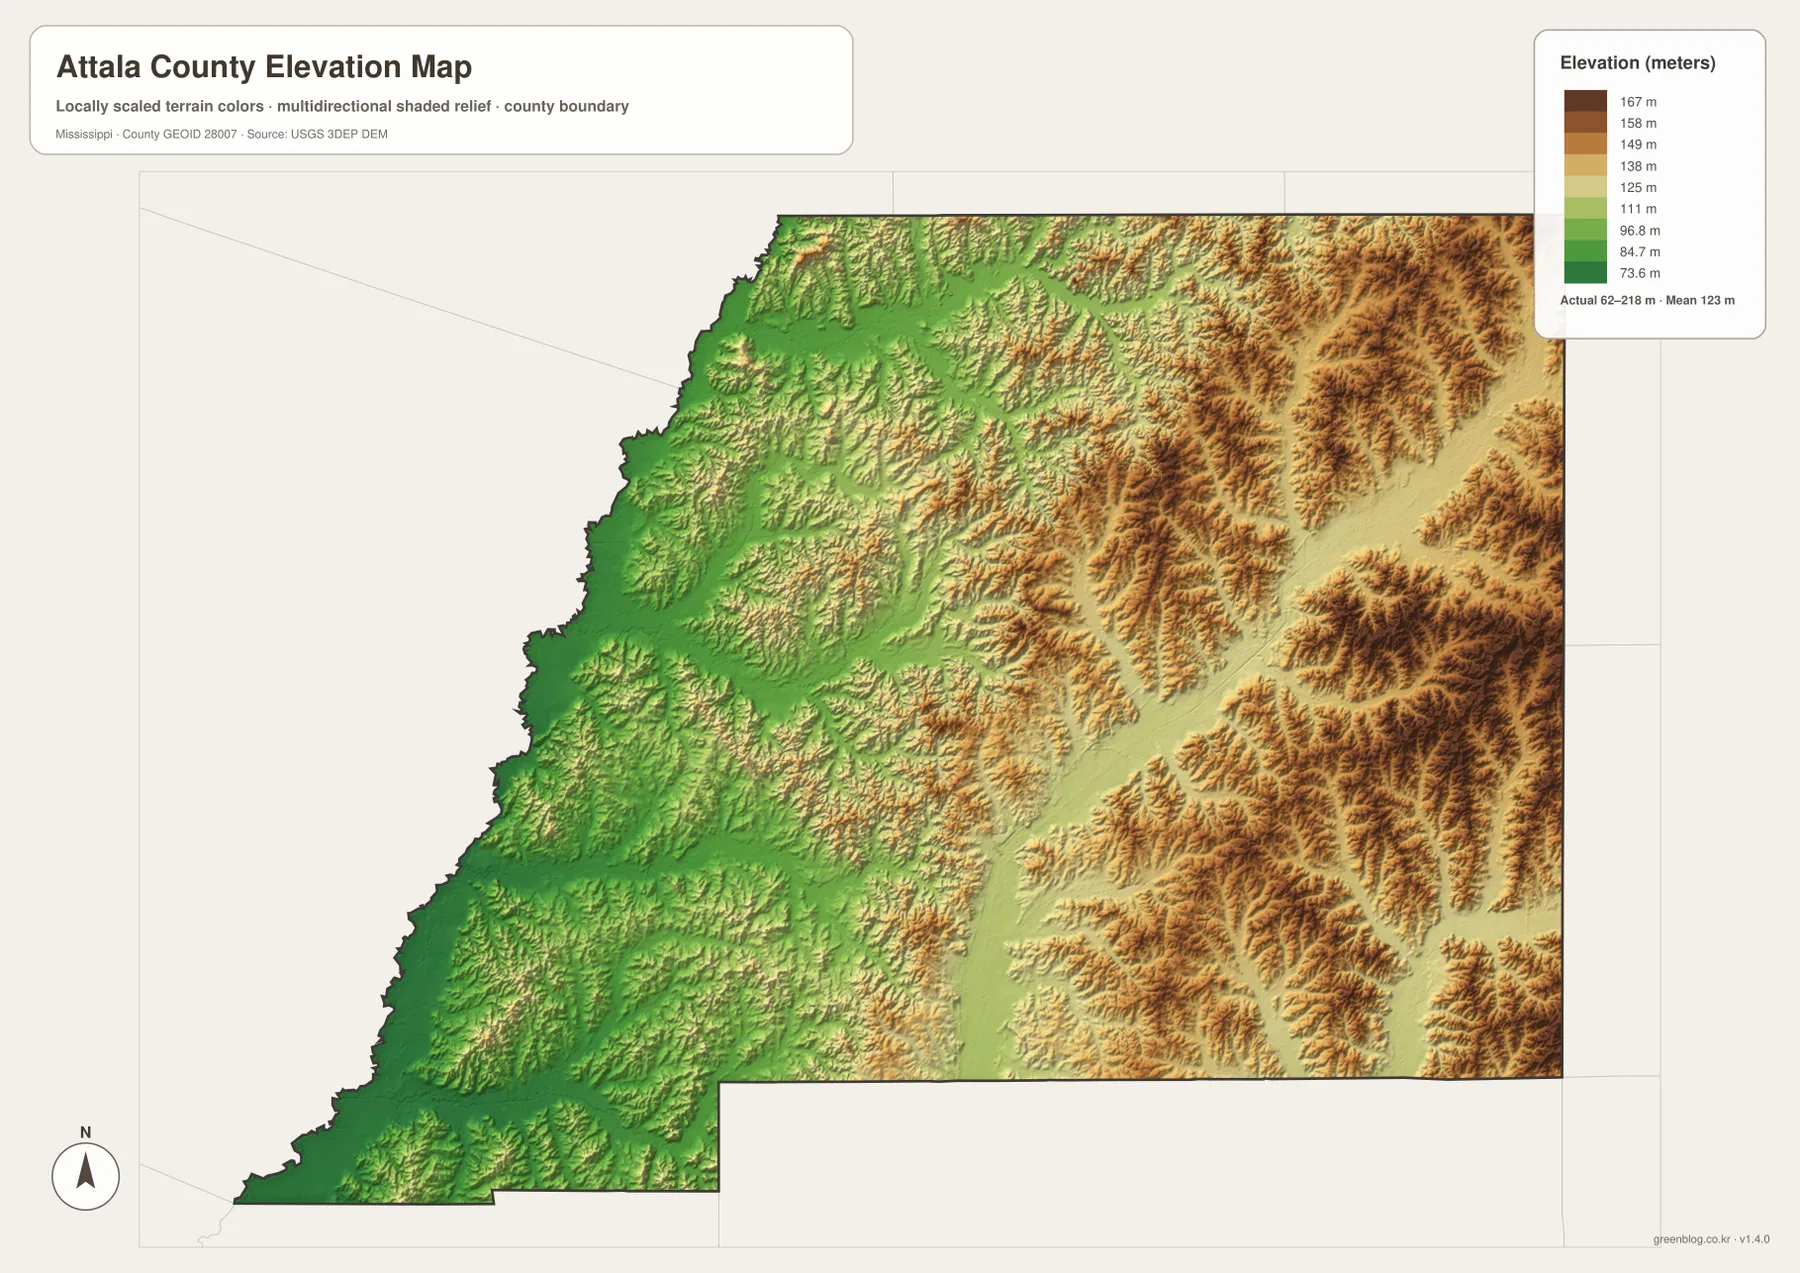
That east-west difference makes the hydrography map easier to interpret. Many of the smaller creeks occupy lower passages between ridges, and the Yockanookany system follows a larger low corridor through the eastern half. The Big Black River area in the southwest also sits within comparatively low terrain. In other words, the water network is not randomly scattered across the county; much of it follows the shape of the land.
The colors should be read against the legend printed on this specific map. A similar shade on an elevation map for another county may represent a different height because the scale is locally adjusted. The layer is also a generalized terrain surface rather than survey-grade measurement, so it should not be used to estimate road grades, engineering elevations, or property-level conditions. For ordinary geographic reading, however, it clearly shows where Attala becomes higher and more dissected and where the broad lower areas are concentrated.
Population and land area help explain the large rural spaces on the map
U.S. Census Bureau QuickFacts lists 17,889 residents in the 2020 census and a July 2025 estimate of 17,100 for Attala County. The 2020 land area is about 734.96 square miles, and the same source reports a 2020 population density of 24.3 people per square mile. Those figures fit the visual impression of the maps: Kosciusko is clearly the strongest center, but the county around it contains long rural stretches with comparatively few labeled settlements.
| Reference | Value or mapped feature |
|---|---|
| County seat | Kosciusko |
| FIPS code | 28007 |
| 2020 census population | 17,889 |
| July 2025 population estimate | 17,100 |
| Land area | About 734.96 sq mi |
| 2020 population density | 24.3 people per sq mi |
| Elevation layer | About 62–218 m; mean 123 m |
The table works best as context for the maps rather than as a substitute for them. Census figures show a large county with a relatively sparse population, while the elevation values show why the eastern half looks much rougher than the west. Kosciusko stands out because roads converge there, but that prominence should not be mistaken for countywide urban development. Likewise, the lower western colors still contain local rises and drainage features that are easier to see on the detailed maps.
Choose the map according to the point you need to make
For a classroom handout or presentation, the best starting question is not “which map has the most information?” but “what should the reader notice first?” If the topic is regional orientation, Kosciusko and the road network provide a clear frame. If the focus is the relationship among smaller communities, the direct-distance city view removes distracting detail. A discussion of rivers, creeks, or eastern hill country is clearer when the corresponding natural feature is allowed to dominate the page rather than being buried under every available label.
The downloadable JPG files are better suited to larger printing than the smaller WebP previews embedded in the article. Keep the original aspect ratio when placing a map on an A3 page or in a slide, and avoid cropping off elements that carry meaning. The elevation legend is essential for interpreting its colors, while the straight-line distance panel on the city-connections map explains what the mileage labels represent. Preserving those elements is more useful than enlarging only the center of the map.
Frequently Asked Questions
Where are Sallis, Ethel, and McCool in relation to Kosciusko?
Sallis is west of Kosciusko, while Ethel and McCool are to the northeast. The city-connections map labels them at about 11, 8, and 17 miles from Kosciusko respectively. Those values are straight-line distances between mapped points, not driving distances.
Is the Big Black River the main water feature everywhere in Attala County?
No. The Big Black River is important on the southwestern side, but the Yockanookany River, Zilpha Creek, Apooka Creek, Long Creek, and several other channels are major parts of the supplied water map. The county is better understood as a network of separate stream corridors than as a place organized around one river alone.
Which side of Attala County has the higher and rougher terrain?
The eastern and northeastern parts contain more of the higher, closely spaced ridges and valleys, while the west and southwest are generally lower. The supplied elevation layer ranges from about 62 to 218 meters with a mean of 123 meters. Use those legend values rather than comparing colors directly with another county’s map.
Map File Information
The download package contains high-resolution A3 JPG versions of the Attala County reference, city-connections, terrain-and-water, and elevation maps. Use the ZIP when you need larger originals for printing, classroom materials, presentations, or offline reference.
- Included Files: 4 high-resolution JPG maps
Related Maps
Sources and References
- U.S. Census Bureau QuickFacts – Attala County – population, land area, and density
- U.S. Census Bureau TIGER/Line Shapefiles – county boundary and geographic reference data
- Mississippi Encyclopedia – Attala County – county background and history
- Mississippi Department of Transportation official highway map – state-road reference
- USGS National Hydrography – river and stream reference data
- USGS 3D Elevation Program – elevation reference data
Green Map creates custom-edited map images using open geographic data sources such as geoBoundaries, Natural Earth, OpenStreetMap, and government open data. These maps are edited visual materials, not raw data files, and are provided for education, documents, presentations, and graphic reference.