Fulton County, Indiana is overwhelmingly agricultural in the 2025 land-cover summary, but the county is not visually uniform. Agriculture accounts for 78.07% of the mapped area, while Rochester forms the largest developed concentration and Lake Manitou introduces a compact area of open water, wetlands, and nearby forest. The four maps on this page separate those patterns so that farmland, natural cover, impervious surfaces, and long-term class differences can be examined without treating them as the same type of information.
The WebP maps below are sized for on-page viewing. The four original JPG files—general land cover, forest and farmland, impervious surface, and 1985–2025 land-cover change—are also available together in one ZIP. They can be useful for classroom work, county comparisons, watershed context, presentations, or any project that needs a clean county-scale view rather than parcel-level detail.
Table of Contents
A farm-dominated county with several important exceptions
The 2025 county summary puts agriculture at 78.07%, far ahead of every other mapped cover. Developed land represents 9.45%, forest 6.93%, wetlands 4.48%, and water 0.77%. That ranking is easy to recognize in the map itself: broad yellow agricultural areas fill most of Fulton County, while developed, forested, wetland, and water classes appear as smaller concentrations or irregular corridors. The remaining legend classes occupy only a small share of the county and do not change the overall agricultural character.
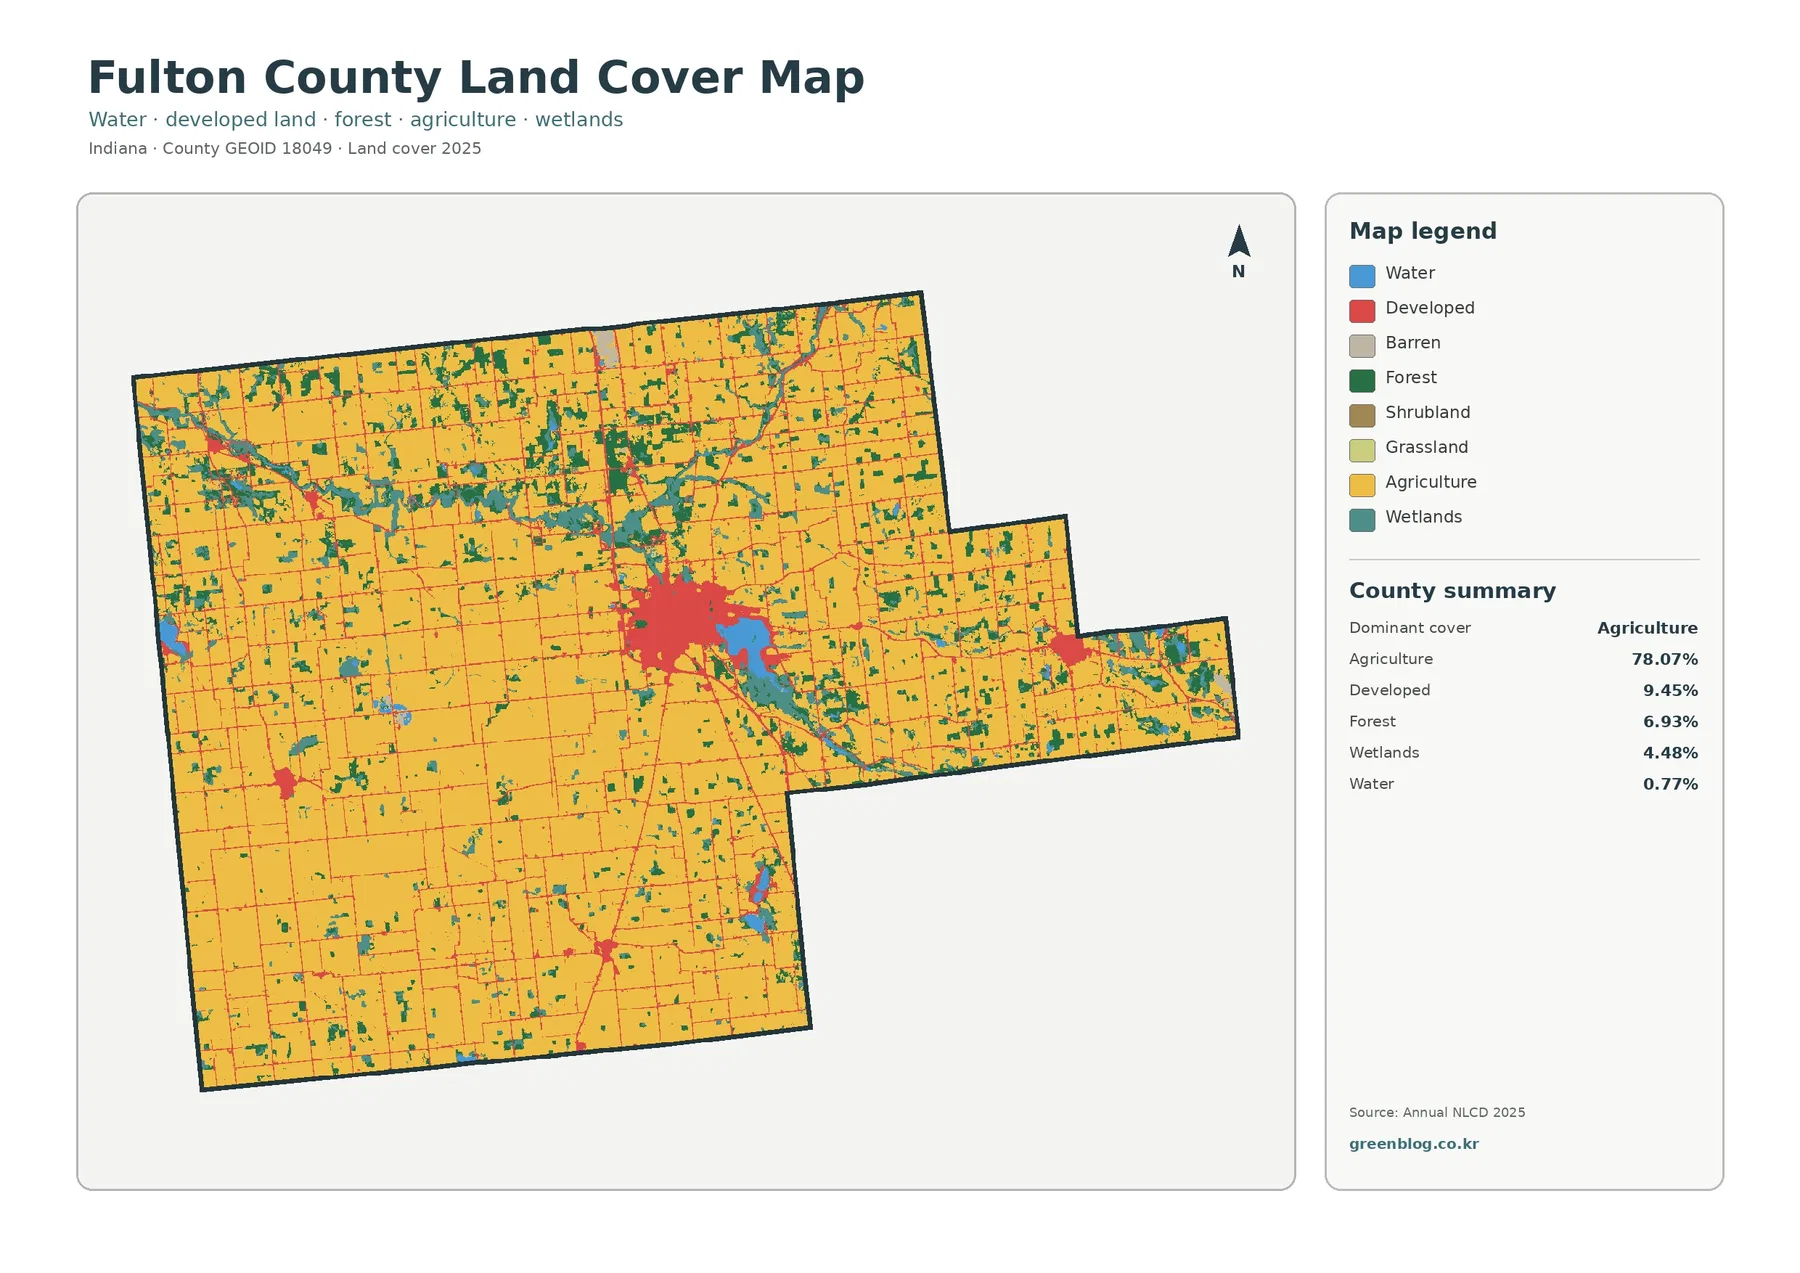
Rochester, the county seat, is the most prominent developed concentration in the image. Indiana’s county information page also lists Akron, Fulton, Kewanna, and Rochester among the county’s cities and towns. Those names provide useful local context, but the colored developed class should not be read as a municipal boundary. Annual NLCD classifies the physical surface; it does not show city limits, zoning districts, ownership, or parcel boundaries.
Water and wetlands stand out around Lake Manitou
A relatively small countywide water percentage can still represent locally important features. Water is only 0.77% of Fulton County in the 2025 summary, yet the lake east and southeast of Rochester is visually prominent because it sits beside the county’s largest developed area and a broad wetland complex. Indiana Department of Natural Resources material identifies Lake Manitou as an approximately 775-acre Fulton County lake, while Indiana’s environmental agency places its watershed southeast of Rochester across parts of Fulton and Miami counties.
The Lake Manitou watershed is described by Indiana IDEM as roughly 27,700 acres, with Rain Creek and Graham Ditch among the primary tributaries. That official watershed context helps explain why the water feature should be viewed together with nearby wetland cover instead of as an isolated blue shape. On the county map, teal wetland classes cluster around the lake and also extend outward in narrower bands. Agriculture comes very close to many of these wet areas, so the map is particularly useful for showing where farm cover and water-related cover occupy neighboring parts of the landscape.
Forest and farmland are easier to compare when development is muted
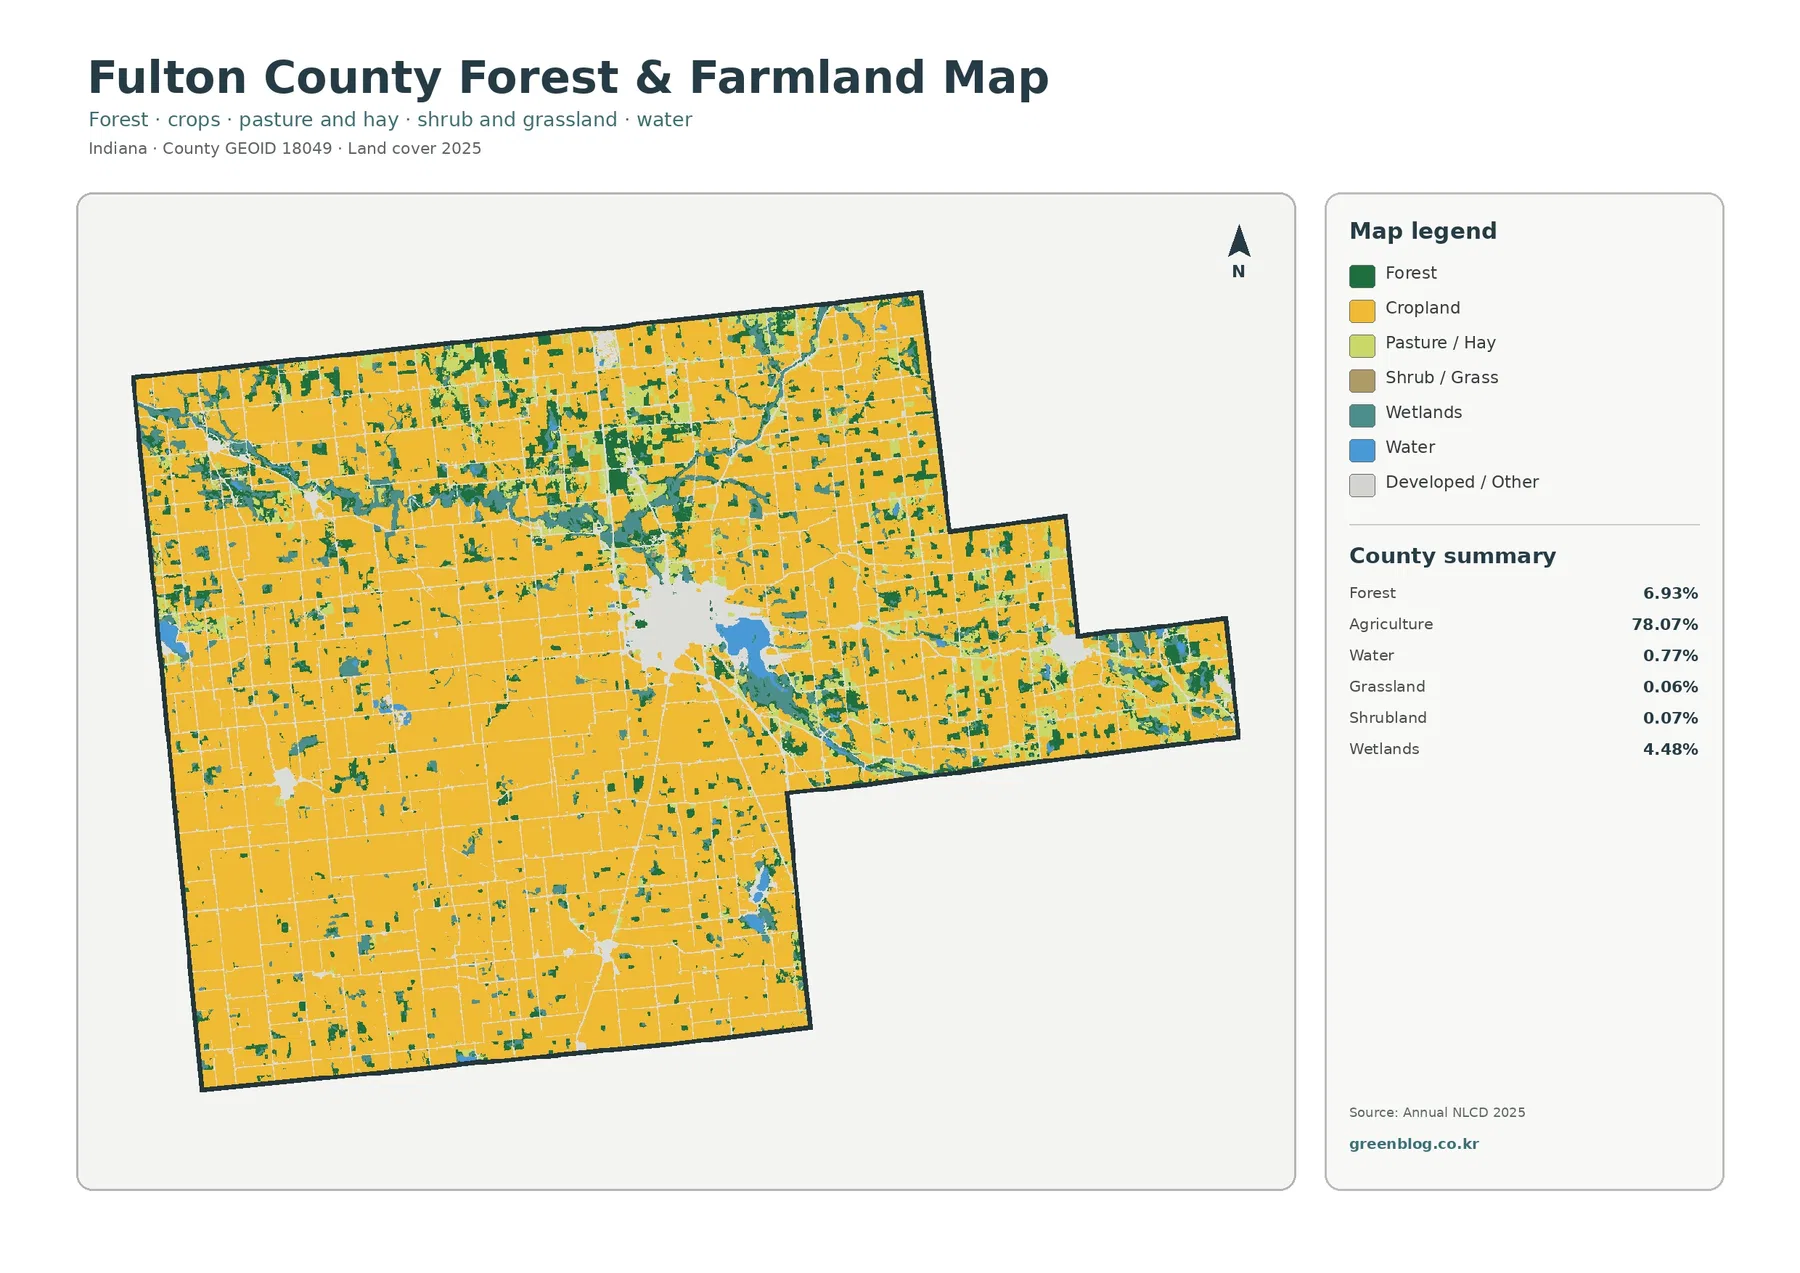
The forest-and-farmland view removes much of the visual competition from developed classes and makes the contrast between working agricultural land and natural cover more apparent. Agriculture remains the dominant category at 78.07%, while forest accounts for 6.93%. Forest is not concentrated in one continuous block. Instead, green patches are scattered through the agricultural matrix, with more irregular groupings near wetland corridors, around water, and in several northern, central, and eastern parts of the county.
This view also separates small grassland and shrubland categories. The summary reports grassland at 0.06% and shrubland at 0.07%, so neither is a major countywide component. Their presence in the legend is still useful because it prevents small non-crop open areas from being mistaken for forest or wetland. The agriculture summary is broader than a single crop class, while the detailed legend distinguishes cropland and pasture/hay. For that reason, the 78.07% figure should be treated as the package’s overall agricultural summary, with the finer map colors used to understand what is inside that broad category.
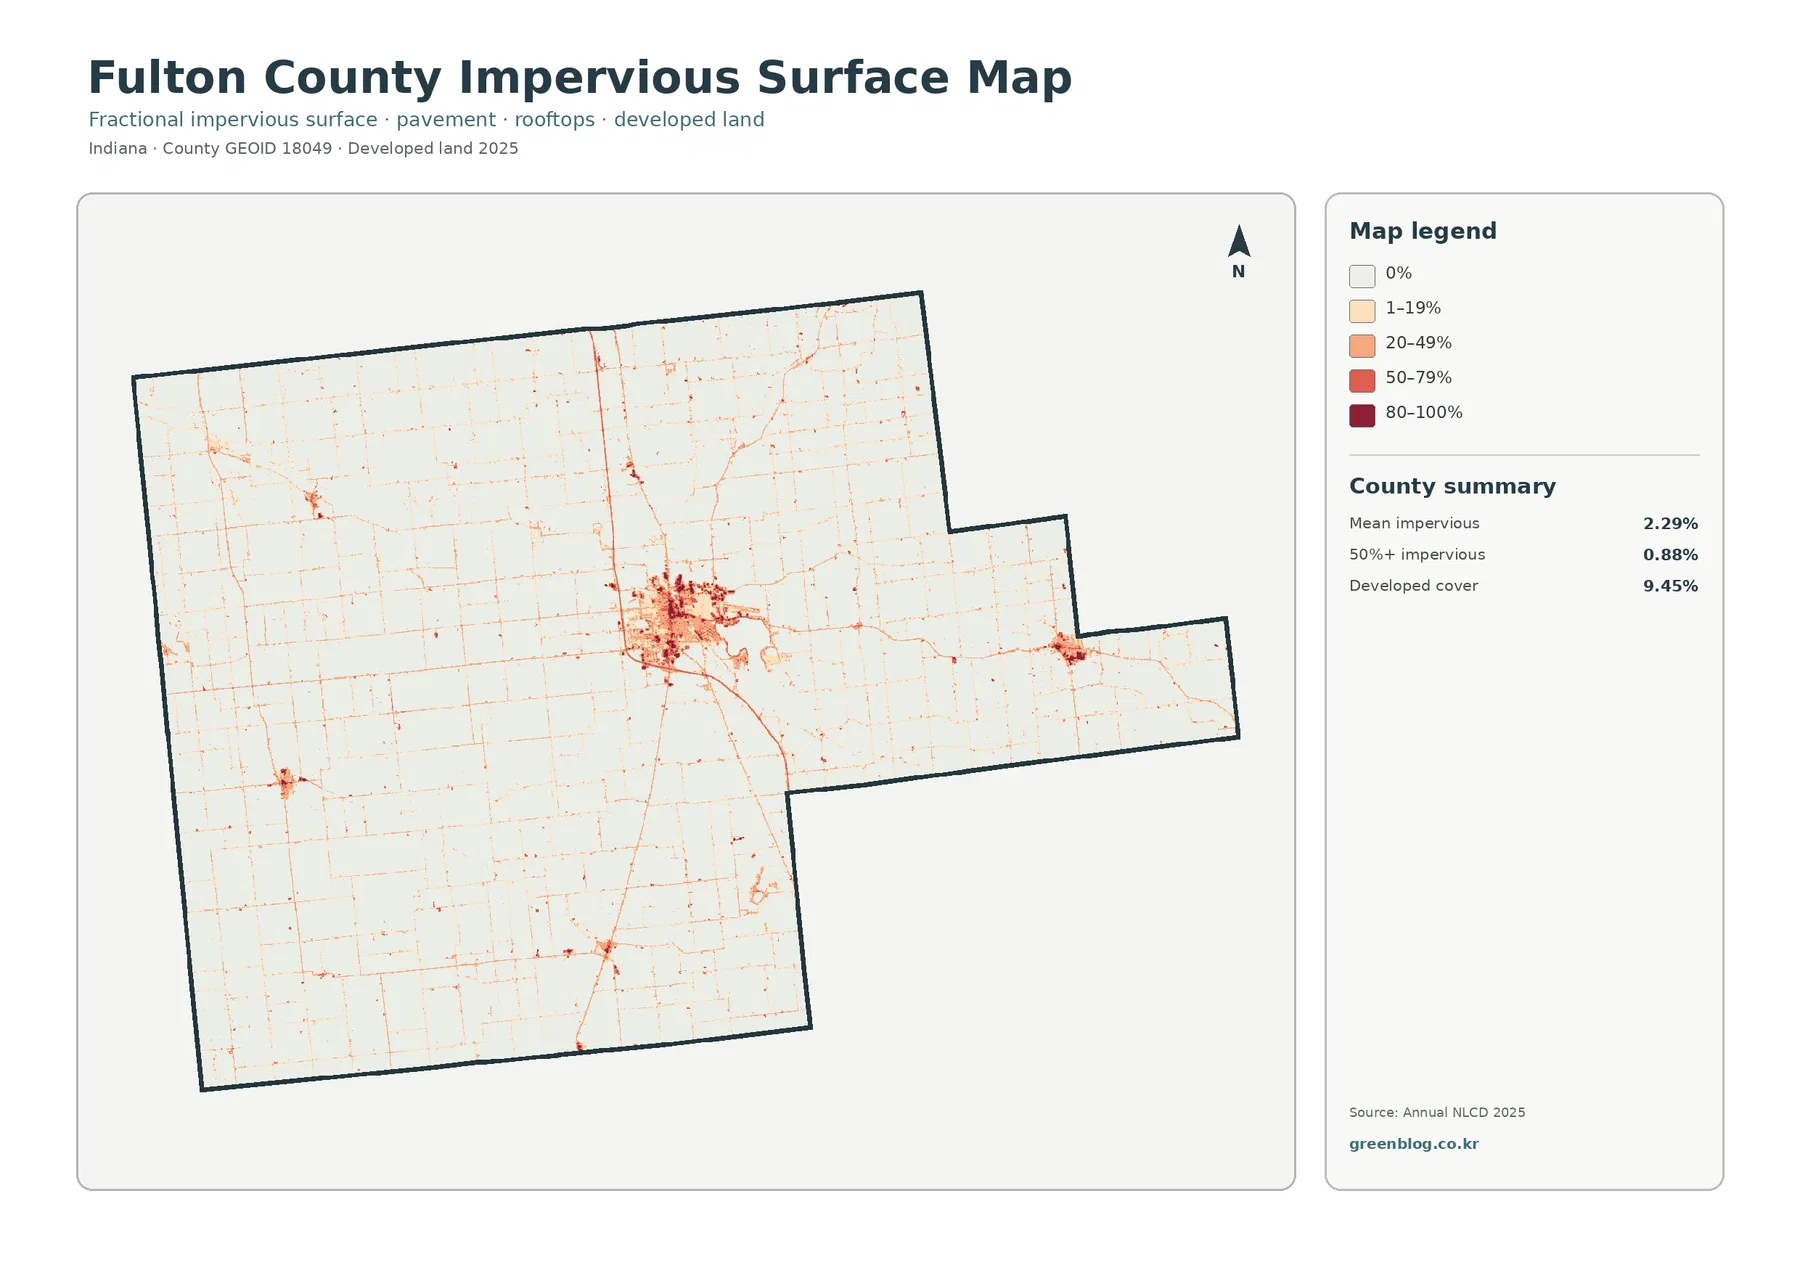
Impervious surfaces reveal Rochester and the road network
Developed land and impervious surface are related, but they are not interchangeable measurements. The 2025 map reports developed cover at 9.45%, mean impervious surface at 2.29%, and only 0.88% of the county at 50% or greater imperviousness. An impervious surface is pavement, a rooftop, or another hard surface that allows little water to soak into the ground. A developed land-cover class can also include lawns, trees, soil, and other permeable areas, which is why the two percentages should not be expected to match.
Rochester produces the largest dark and medium-toned cluster on the impervious map. Outside that concentration, roads appear as thin lines across otherwise light agricultural areas, and smaller built clusters interrupt the farm grid in several places. The map therefore gives a clearer picture of where hard surfaces are concentrated than the general land-cover view does. For transportation or runoff context, the contrast between the Rochester area, smaller settlements, and the surrounding agricultural landscape is more informative than a single countywide average.
What changed between 1985 and 2025
The change map compares classified land cover in 1985 and 2025. Its summary reports a total class difference of 8.10%. Within that total, 1.39% is mapped as change to developed, 0.43% as forest loss, 1.13% as agricultural loss, and 4.70% as other class difference. Wetland differences are also shown in the legend, although this package does not provide a separate countywide percentage for that category. The largest named summary value is therefore the broad ‘other difference’ group, not development.
Most of Fulton County remains uncolored in the change view, indicating no difference in the broad class between the two comparison years. Colored cells are scattered across the county, with a more noticeable developed-change concentration around Rochester and many smaller differences near the edges of agricultural, wetland, and forest cover. That pattern is useful for locating areas to investigate, but it is not a history of every land-use decision made over forty years.
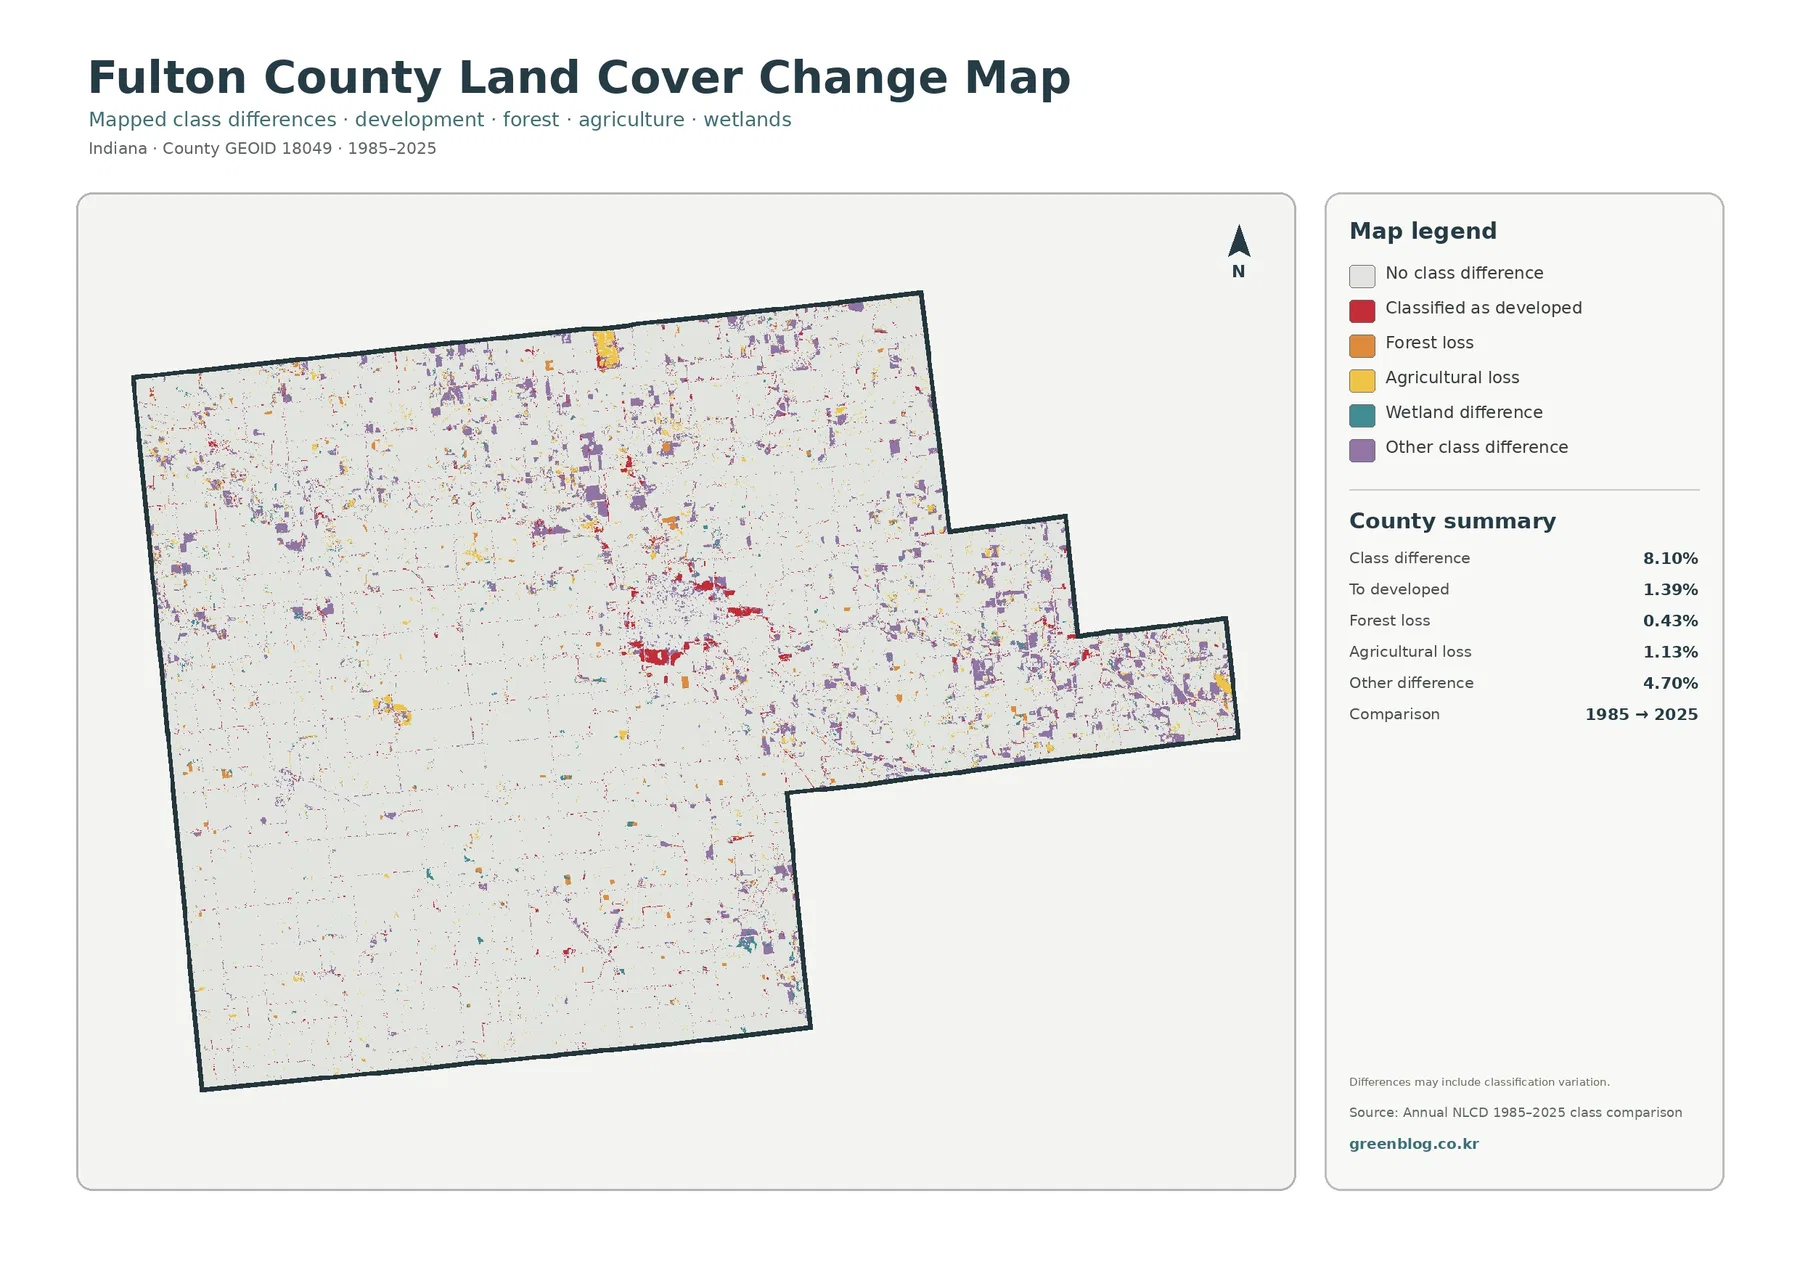
Annual NLCD Collection 1.2 extends the conterminous U.S. annual record through 2025 and uses 30-meter raster products. A raster divides the ground into square cells, and each cell is assigned or summarized using the dataset’s classification rules. Small roads, narrow tree lines, shoreline edges, and mixed rural development can occupy only part of a cell. A change in classification may also reflect classification variation, especially near boundaries between cover types. For those reasons, the colored differences should be treated as mapped evidence for broader comparison rather than proof of a specific parcel-level conversion.
Frequently Asked Questions
What is the dominant land cover in Fulton County?
Agriculture is the dominant 2025 cover at 78.07% of the county. Developed land is 9.45%, forest 6.93%, wetlands 4.48%, and water 0.77%. The general map reflects the same ranking visually, with agricultural colors covering most of the county and the other classes appearing in smaller concentrations.
Why is mean imperviousness only 2.29% when developed land is 9.45%?
The figures describe different things. Developed land is a land-cover category, while mean imperviousness measures the share of hard, water-resistant surface such as pavement and rooftops across the mapped cells. Developed areas can contain lawns, trees, soil, and other permeable surfaces, so the countywide developed percentage can be much larger than the average impervious percentage.
Does every colored cell on the 1985–2025 map represent new development?
No. The change legend includes change to developed, forest loss, agricultural loss, wetland difference, and other class difference. The countywide total class difference is 8.10%, while the portion mapped as change to developed is 1.39%. Classification variation can also contribute to differences, so parcel-level history should be verified with other records.
Important limits before using the maps for local decisions
These maps describe land cover, not legal land use. A cell classified as agriculture does not prove that the parcel is zoned for agriculture, and a forest class does not establish public ownership, conservation status, or a protected boundary. Likewise, the developed class does not reproduce the corporate limits of Rochester, Akron, Fulton, or Kewanna. Property, zoning, permitting, drainage, and ownership questions require the appropriate county or state records.
The 2025 values are a snapshot of the classification represented in the package. Construction, vegetation removal, crop rotation, wetland conditions, or other changes after the observation period will not appear automatically in these images. At 30-meter resolution, narrow or small features can also be generalized. Mixed pixels are especially important along field edges, roads, shorelines, and small wooded strips because more than one real surface may exist inside a single cell.
Map File Information
The ZIP contains all four original Fulton County JPG maps: general land cover, forest and farmland, impervious surface/developed land, and 1985–2025 land-cover change.
- Printable Size: 2480 × 1754 px each
- File Type: ZIP containing four JPG images
- Intended Use: classes, reports, presentations, county comparisons, and watershed context
Related Maps
- Adams County Indiana Land Cover Map
- Allen County Indiana Land Cover Map
- Bartholomew County Indiana Land Cover Map
Sources and reference material
- MRLC Annual NLCD Data – access to Annual NLCD products through 2025
- USGS Annual NLCD Land Cover Classification – classification and product guidance
- U.S. Census Bureau TIGER/Line Shapefiles – county boundary reference
- Purdue Extension – Fulton County Agriculture & Natural Resources – county-specific agricultural and natural-resource information
- Indiana IDEM – Lake Manitou Watershed Management Plan – Lake Manitou watershed location and tributary context
Green Map creates custom-edited map images using open geographic data sources such as geoBoundaries, Natural Earth, OpenStreetMap, and government open data. These maps are edited visual materials, not raw data files, and are provided for education, documents, presentations, and graphic reference.