Maryland’s population is concentrated in a broad central band rather than spread evenly across the state. The supplied 2024 ACS 5-year estimates place the statewide population at 6,206,011. The detailed tract map shows the strongest concentrations around Baltimore and through the suburban counties bordering Washington, D.C., while the western panhandle and large parts of the Eastern Shore are much lighter.
The county-density map reports roughly 9,711 square miles of land and a statewide average near 639 people per square mile, but that average masks an enormous gap between Baltimore city and the state’s sparsest counties.
These maps answer several different questions, so the symbols need to be read carefully. Proportional circles compare total population, not density. Choropleth colors on the tract and county-density maps show people per square mile. The current population maps use 2024 ACS estimates, while the change map compares the 2010 and 2020 Decennial Census counts.
Maryland also has one important administrative detail: the data contain 23 counties plus Baltimore city, an independent city treated as a county equivalent by the Census Bureau. That is why the county-level dataset contains 24 units even though one of them is not a county.
Table of Contents
Census tracts reveal a dense central Maryland network that county averages cannot show
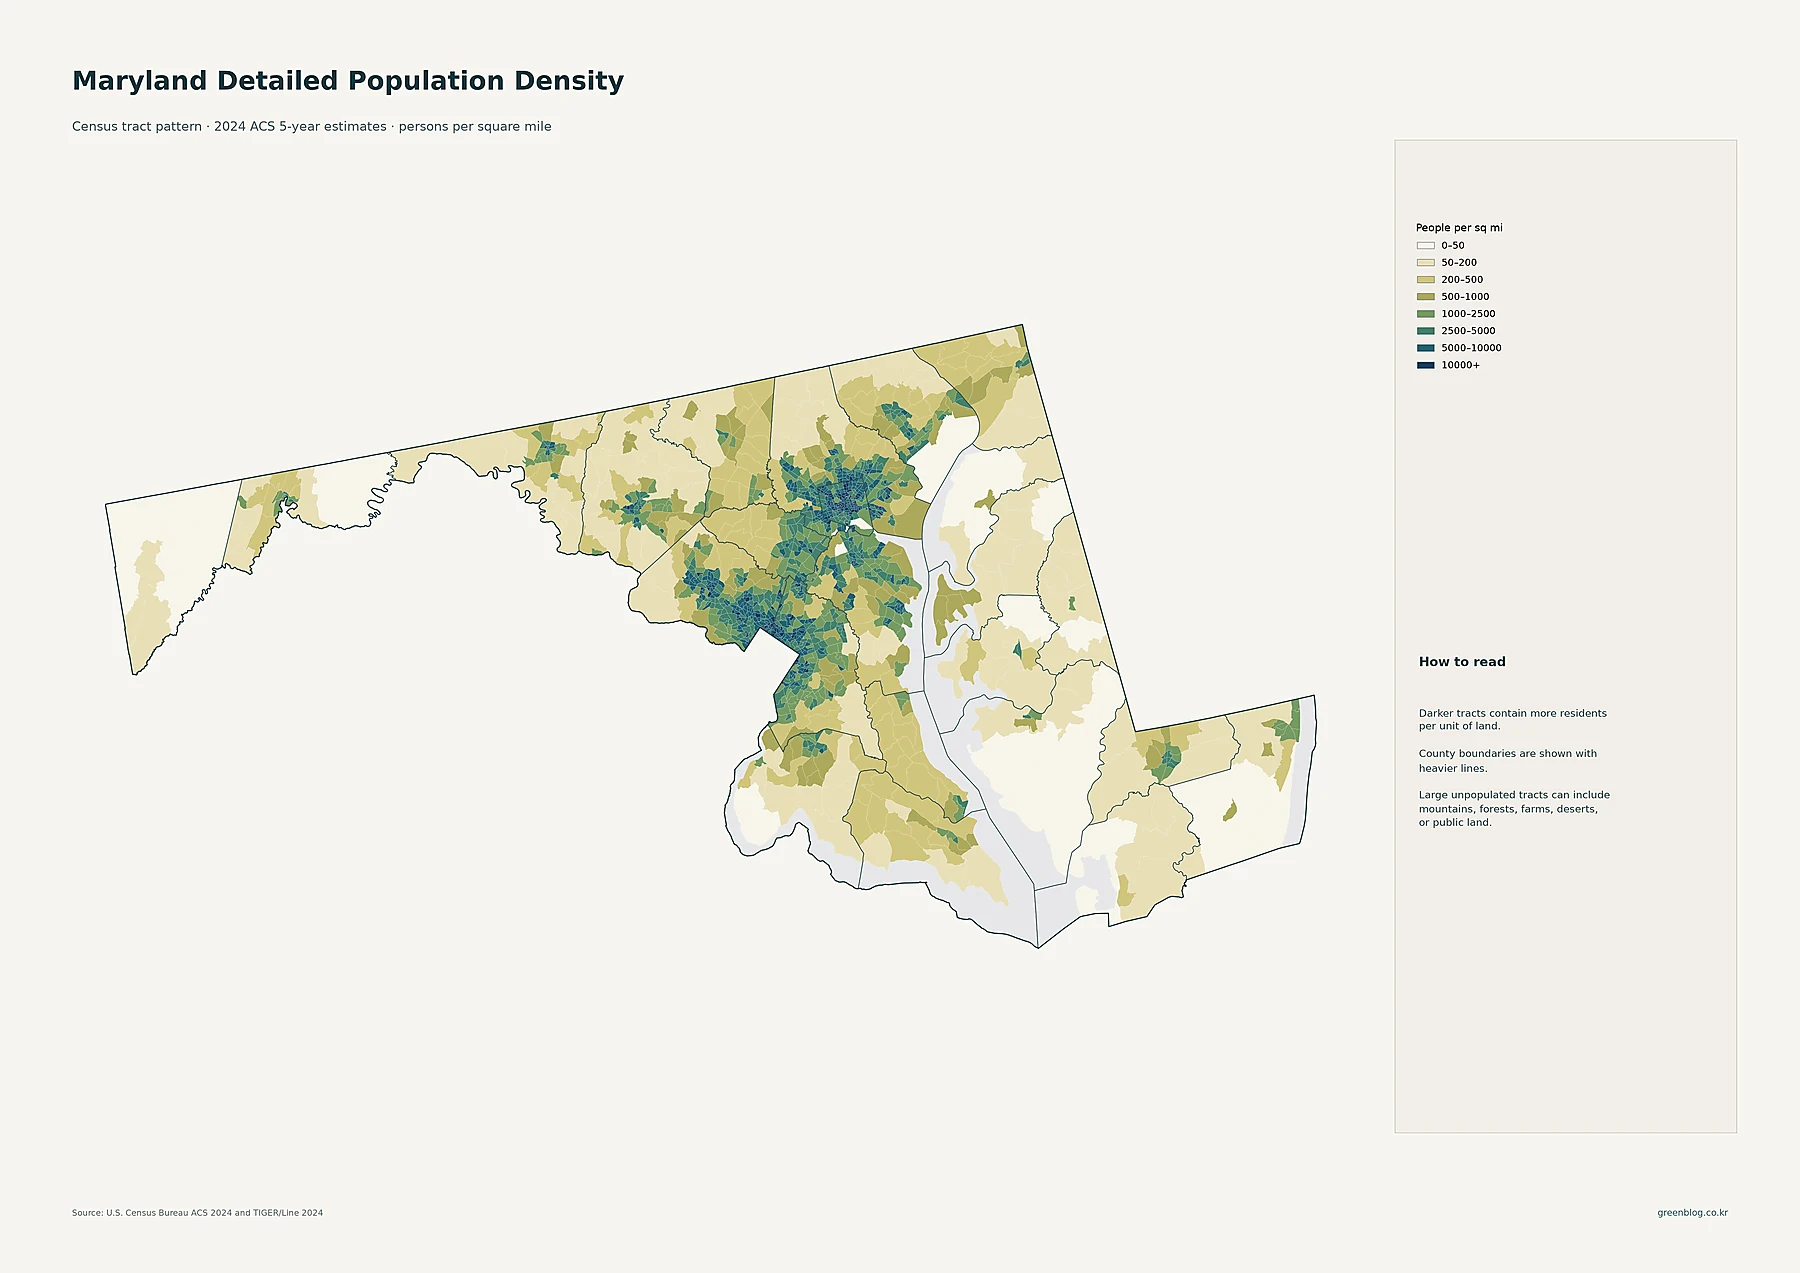
The darkest tract cluster is centered on Baltimore city and extends into the surrounding Baltimore-area communities. Another broad concentration appears to the southwest in Montgomery and Prince George’s counties, where many suburban tracts fall into the higher density classes. Between those two large population centers, dense and medium-density tracts continue through Howard and Anne Arundel counties.
The map therefore shows a connected central pattern that is much more detailed than a simple county ranking. A county can average a moderate value overall while containing several intensely populated tracts.
Frederick appears as a separate concentration farther west, and Hagerstown stands out as a smaller local center in Washington County. On the Eastern Shore, darker tracts are less continuous, although places such as the Salisbury area create visible local pockets within otherwise lighter territory.
Garrett County and much of the far west remain in low-density classes across broad areas. The tract map is especially useful here because it separates compact settlement from the large rural spaces surrounding it instead of assigning one average color to an entire county.
Baltimore is the largest census place, but the map is filled with sizable suburban centers
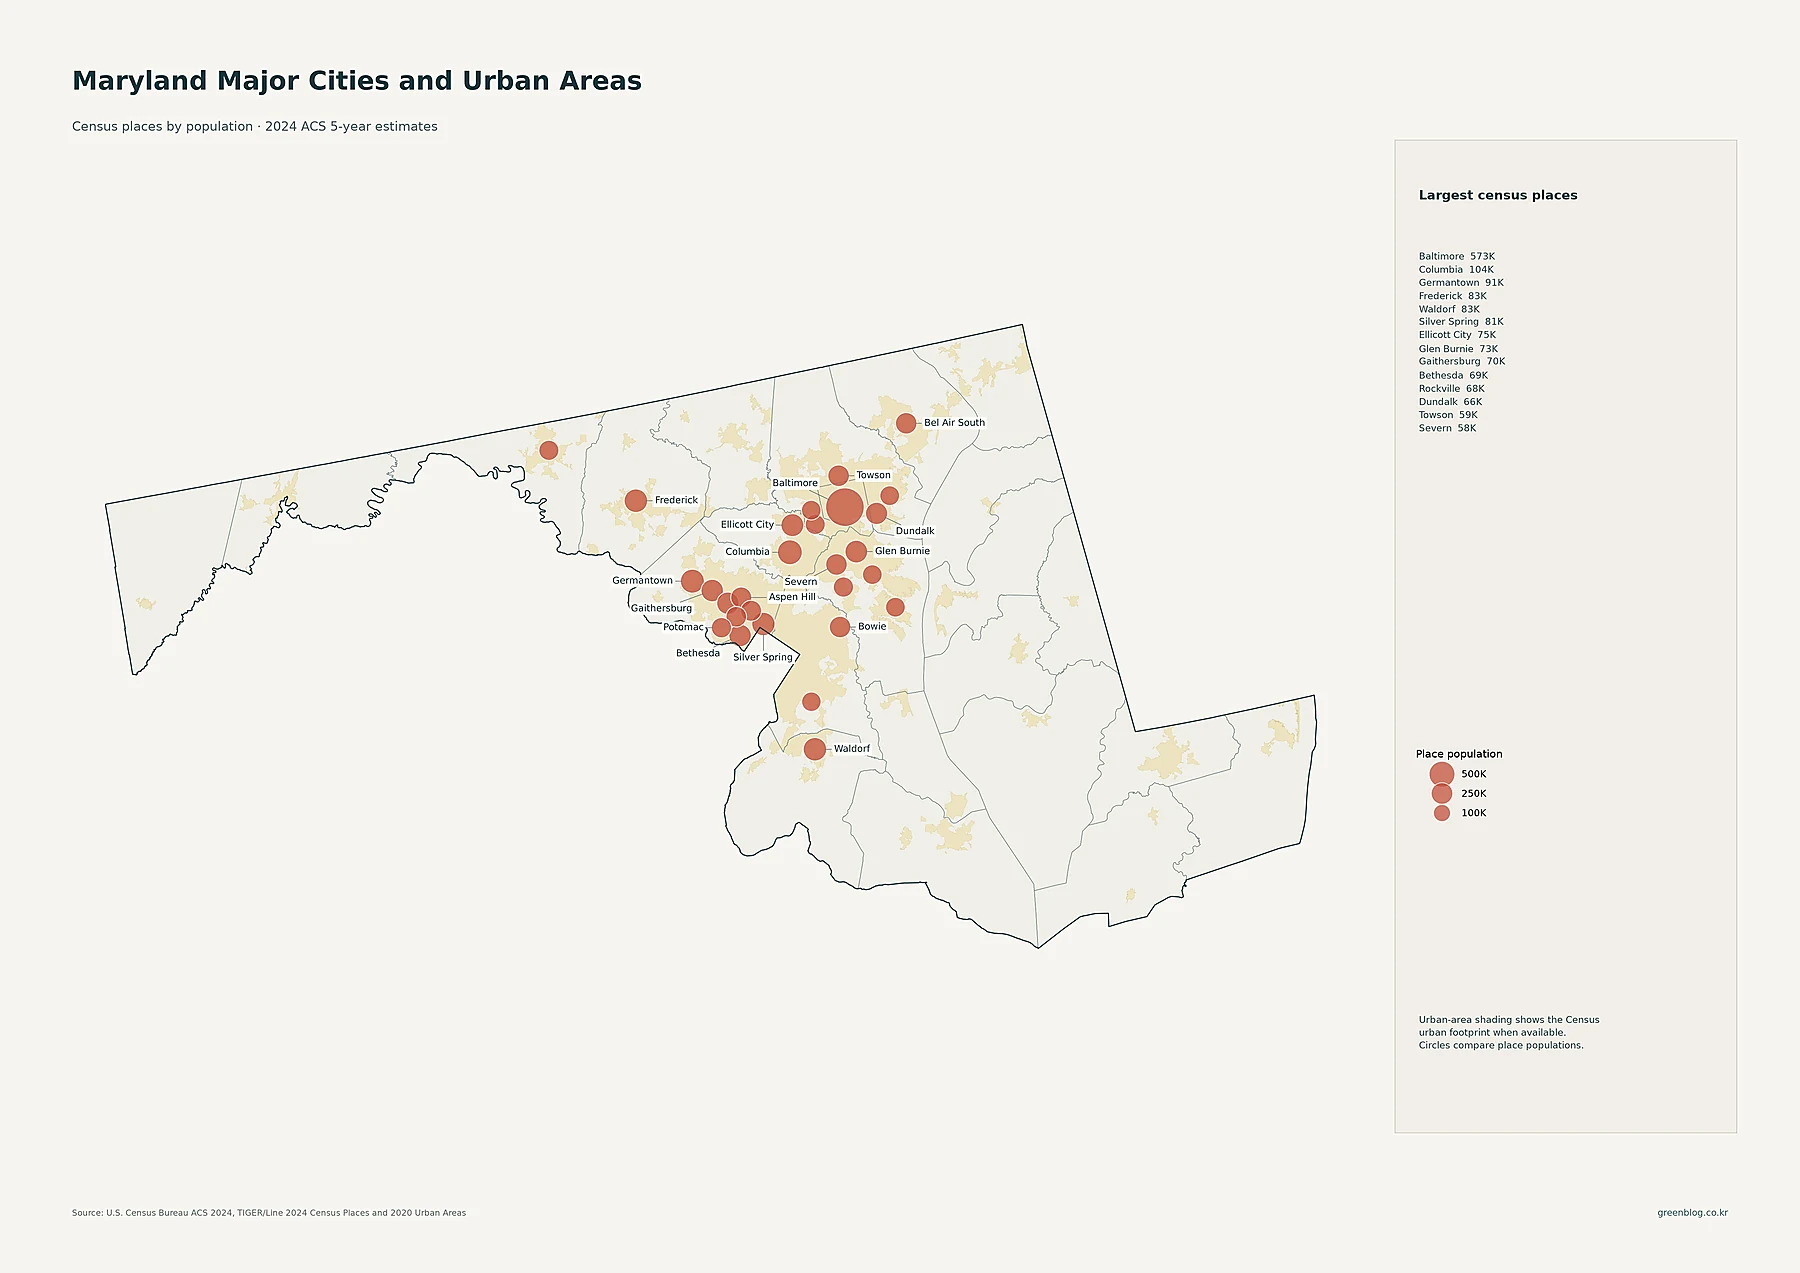
Baltimore is the largest census place in the supplied data at 573,243 residents. Columbia is next at 104,338, followed by Germantown at 90,719, Frederick at 83,395, Waldorf at 82,943, and Silver Spring at 81,462. Ellicott City has 75,257 residents, Glen Burnie 72,590, Gaithersburg 69,825, Bethesda 69,397, Rockville 67,671, and Dundalk 65,969. Towson, Severn, Bel Air South, and Bowie are also shown among the larger places.
The pattern is notable because the second tier is not scattered randomly across the state. Many of the largest circles form a tight Baltimore–Washington suburban network, with Frederick and Waldorf extending the pattern west and south. The circle size should not be used to infer density.
Columbia’s large circle, for example, represents its total place population, while the tract map is the appropriate source for judging how tightly residents are packed within and around Columbia. Using the two maps together gives both the size and the local concentration of Maryland’s urban centers.
Montgomery leads total county population, while four other county-level units exceed half a million residents
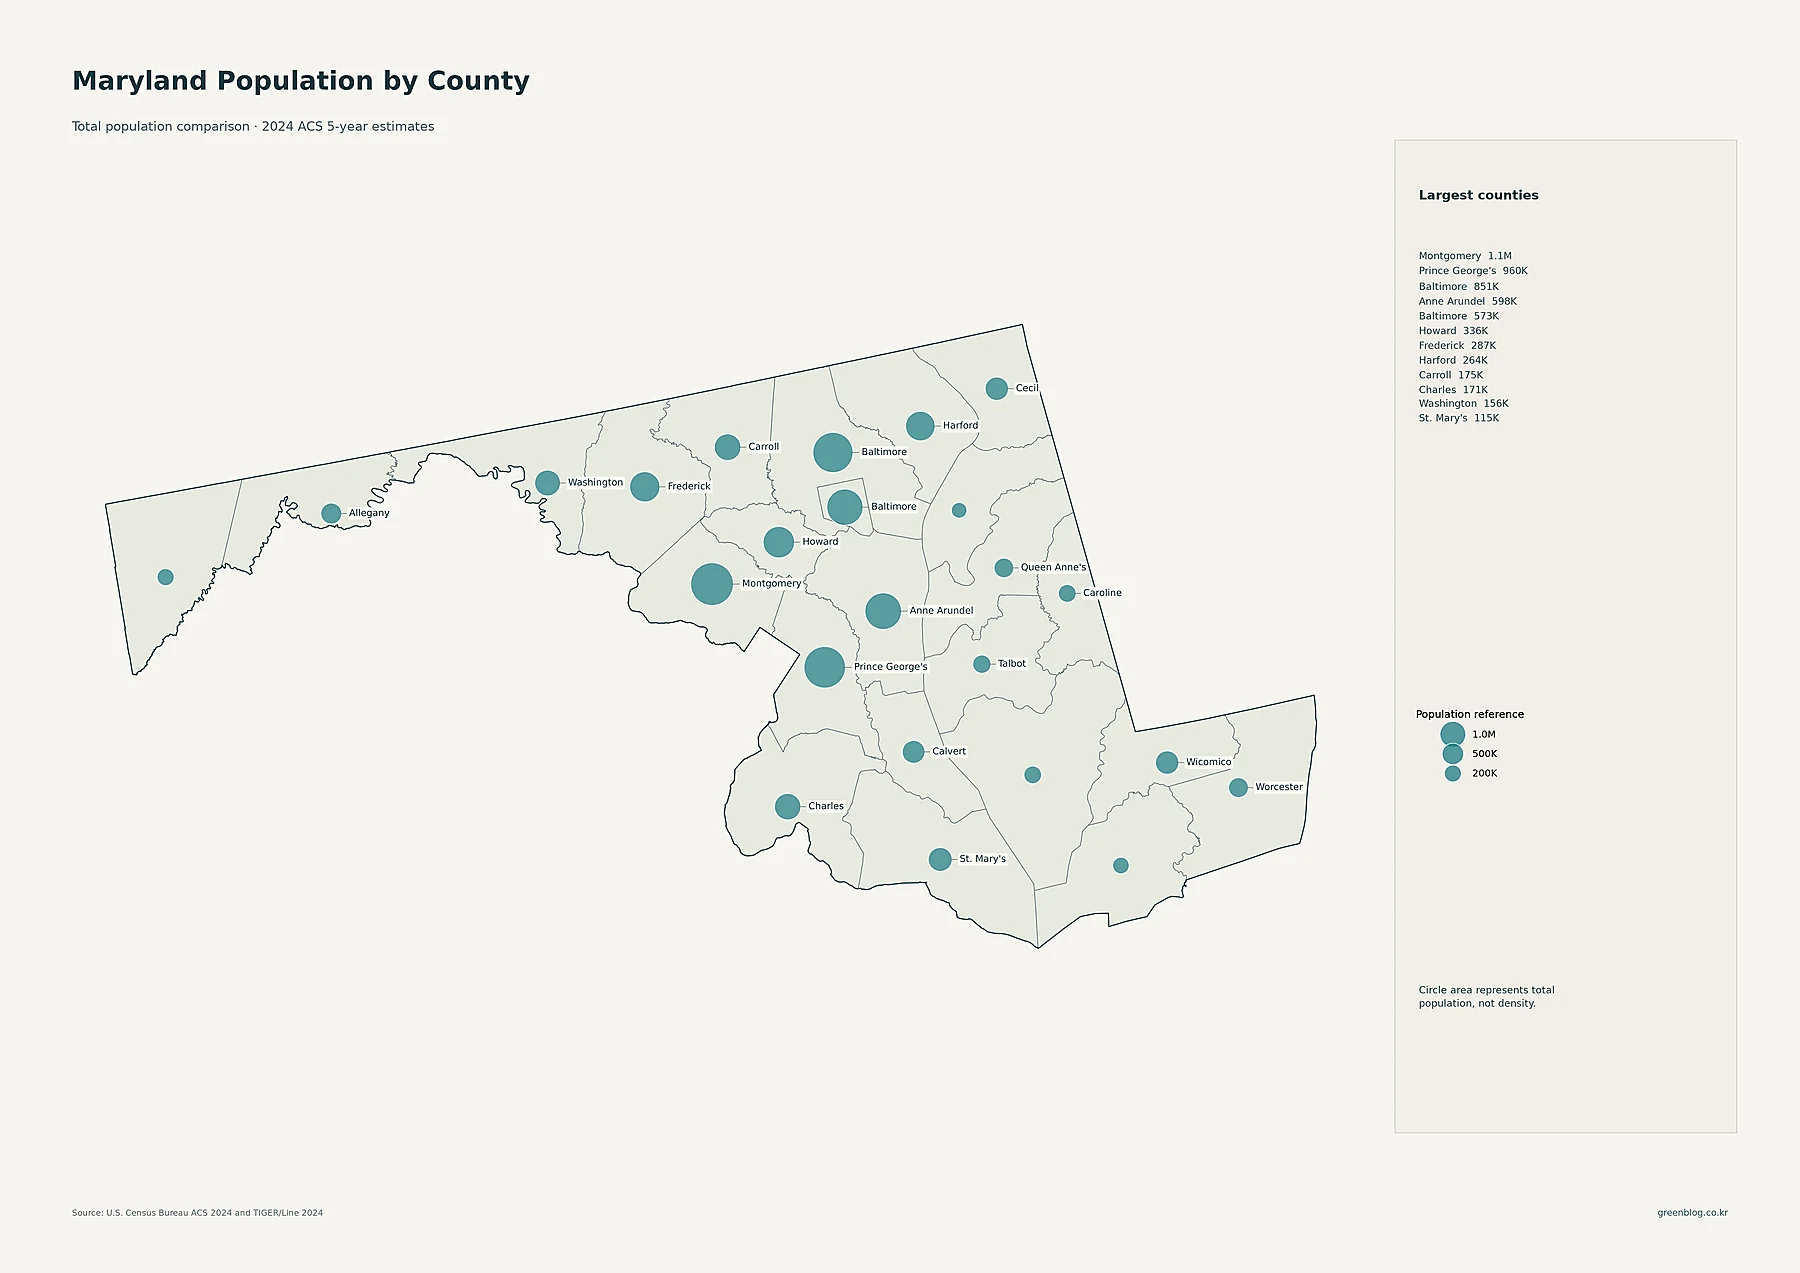
Montgomery County is the largest county by population at 1,065,949. Prince George’s County follows at 959,754, Baltimore County at 850,796, Anne Arundel County at 598,166, and Baltimore city at 573,243. Howard County has 336,328 residents, Frederick County 287,048, Harford County 263,757, Carroll County 175,321, and Charles County 170,527. These totals make the central part of Maryland visually dominant on the proportional-circle map.
The smaller totals are concentrated in several western and Eastern Shore units. Kent County has 19,346 residents, Somerset County 24,822, Garrett County 28,615, Dorchester County 32,754, and Caroline County 33,669. A small circle does not necessarily mean a county is empty everywhere; it means its total resident count is small relative to the statewide leaders.
Likewise, a large circle can reflect both a large land area and many residents, so the density map is needed before making any statement about how crowded that county is.
Baltimore city is in a density class of its own, followed by the Washington-side suburban counties
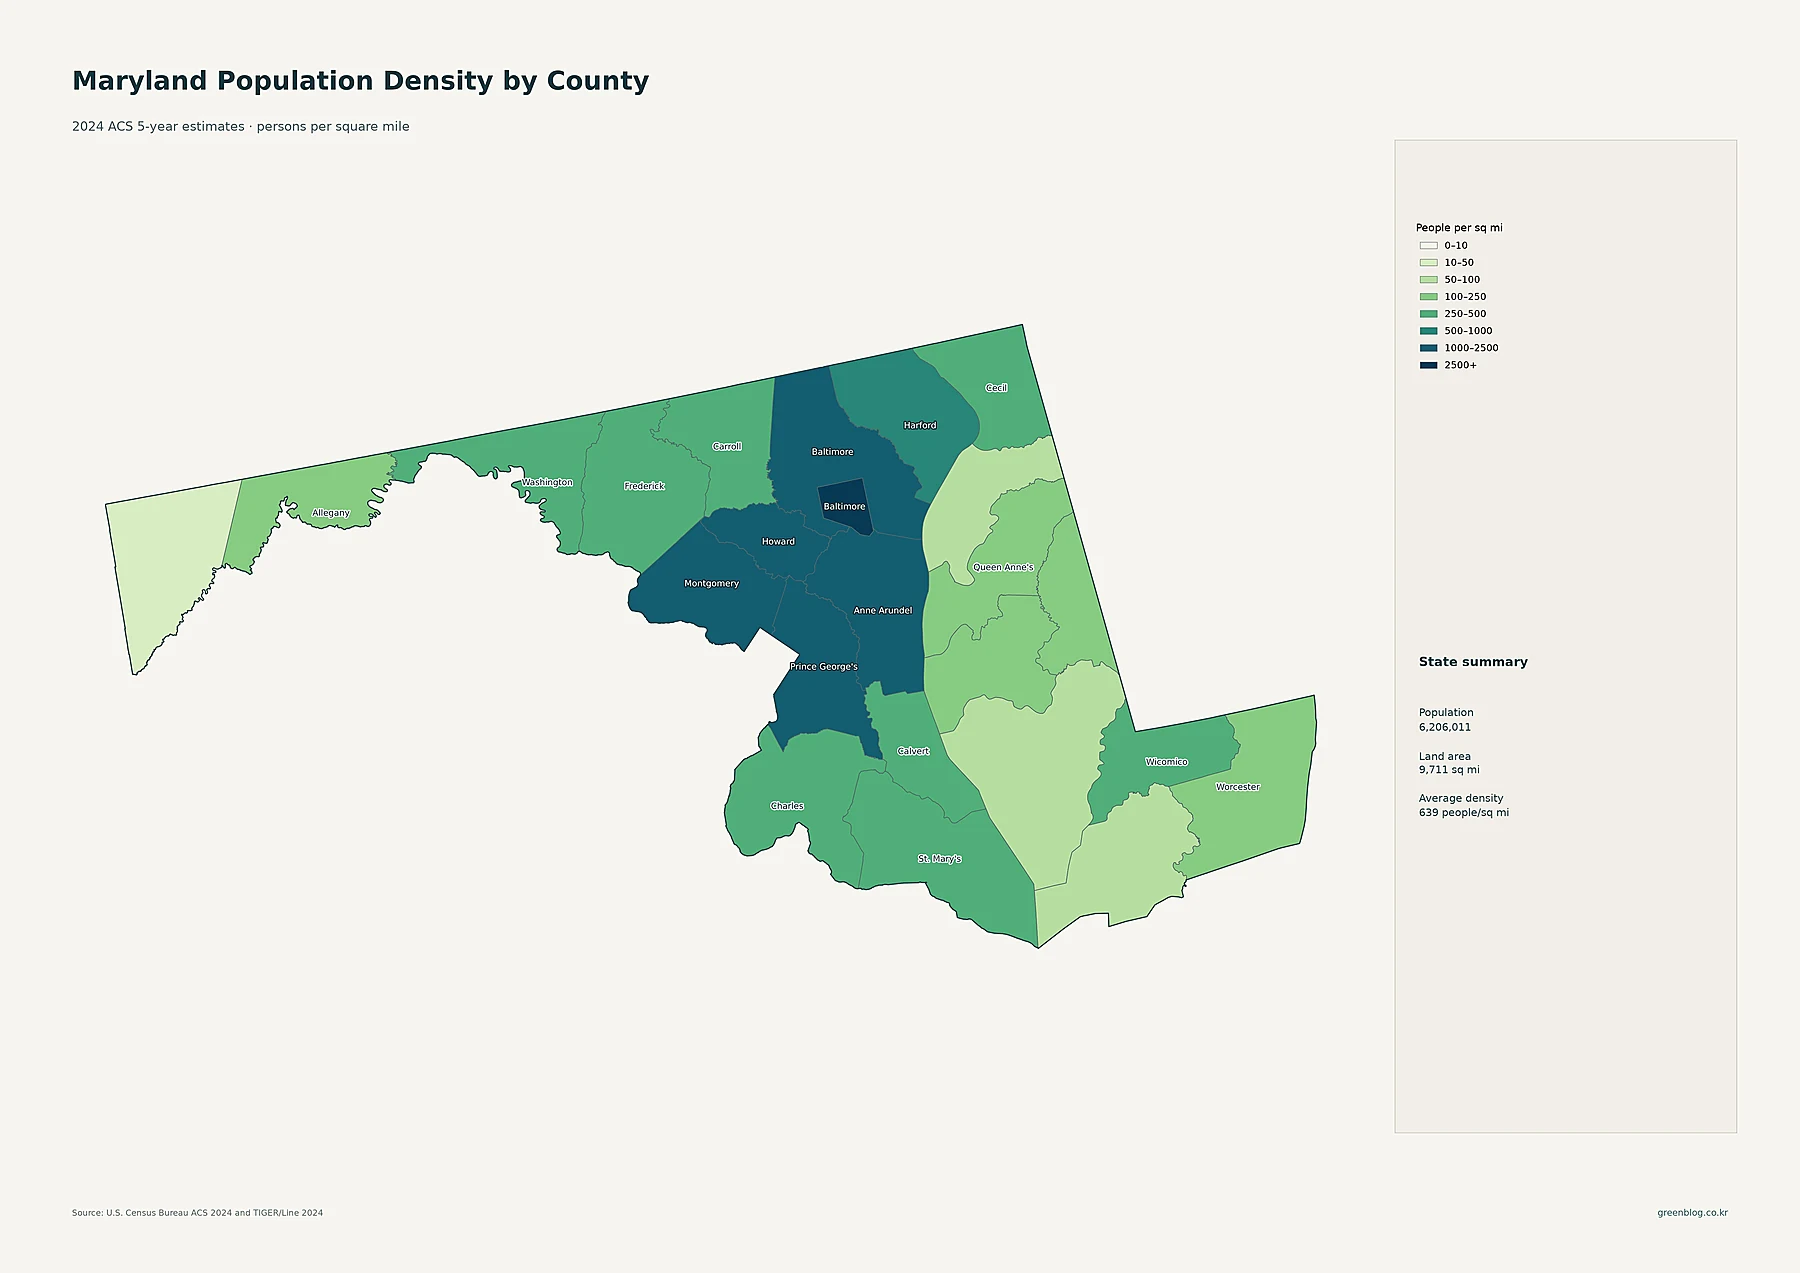
Baltimore city averages about 7,082 people per square mile, by far the highest value in the dataset. Montgomery County is about 2,162, Prince George’s County about 1,989, Anne Arundel County about 1,442, Baltimore County about 1,422, and Howard County about 1,340. Harford is much lower at roughly 603 but still near the statewide average. Calvert is about 442, Frederick 435, Carroll 392, Charles 372, and Washington 340.
The low-density end looks completely different. Garrett County averages only about 44 people per square mile, Dorchester about 61, Kent about 70, and Somerset about 78. Caroline is roughly 105 and Worcester about 115. This contrast explains why a statewide average near 639 is not representative of most individual places.
Baltimore city has fewer total residents than Anne Arundel County in the current estimate, yet its average density is almost five times as high. Population size and population density are measuring different dimensions of settlement.
| Measure | Leading area | Value in the supplied data |
|---|---|---|
| State population | Maryland | 6,206,011 |
| Largest county population | Montgomery County | 1,065,949 |
| Highest county-equivalent density | Baltimore city | about 7,082/sq mi |
| Fastest 2010–2020 growth | Frederick County | +16.4% |
| Largest 2010–2020 decline | Allegany County | -9.3% |
Frederick and Howard grew fastest from 2010 to 2020, while Allegany recorded the largest decline
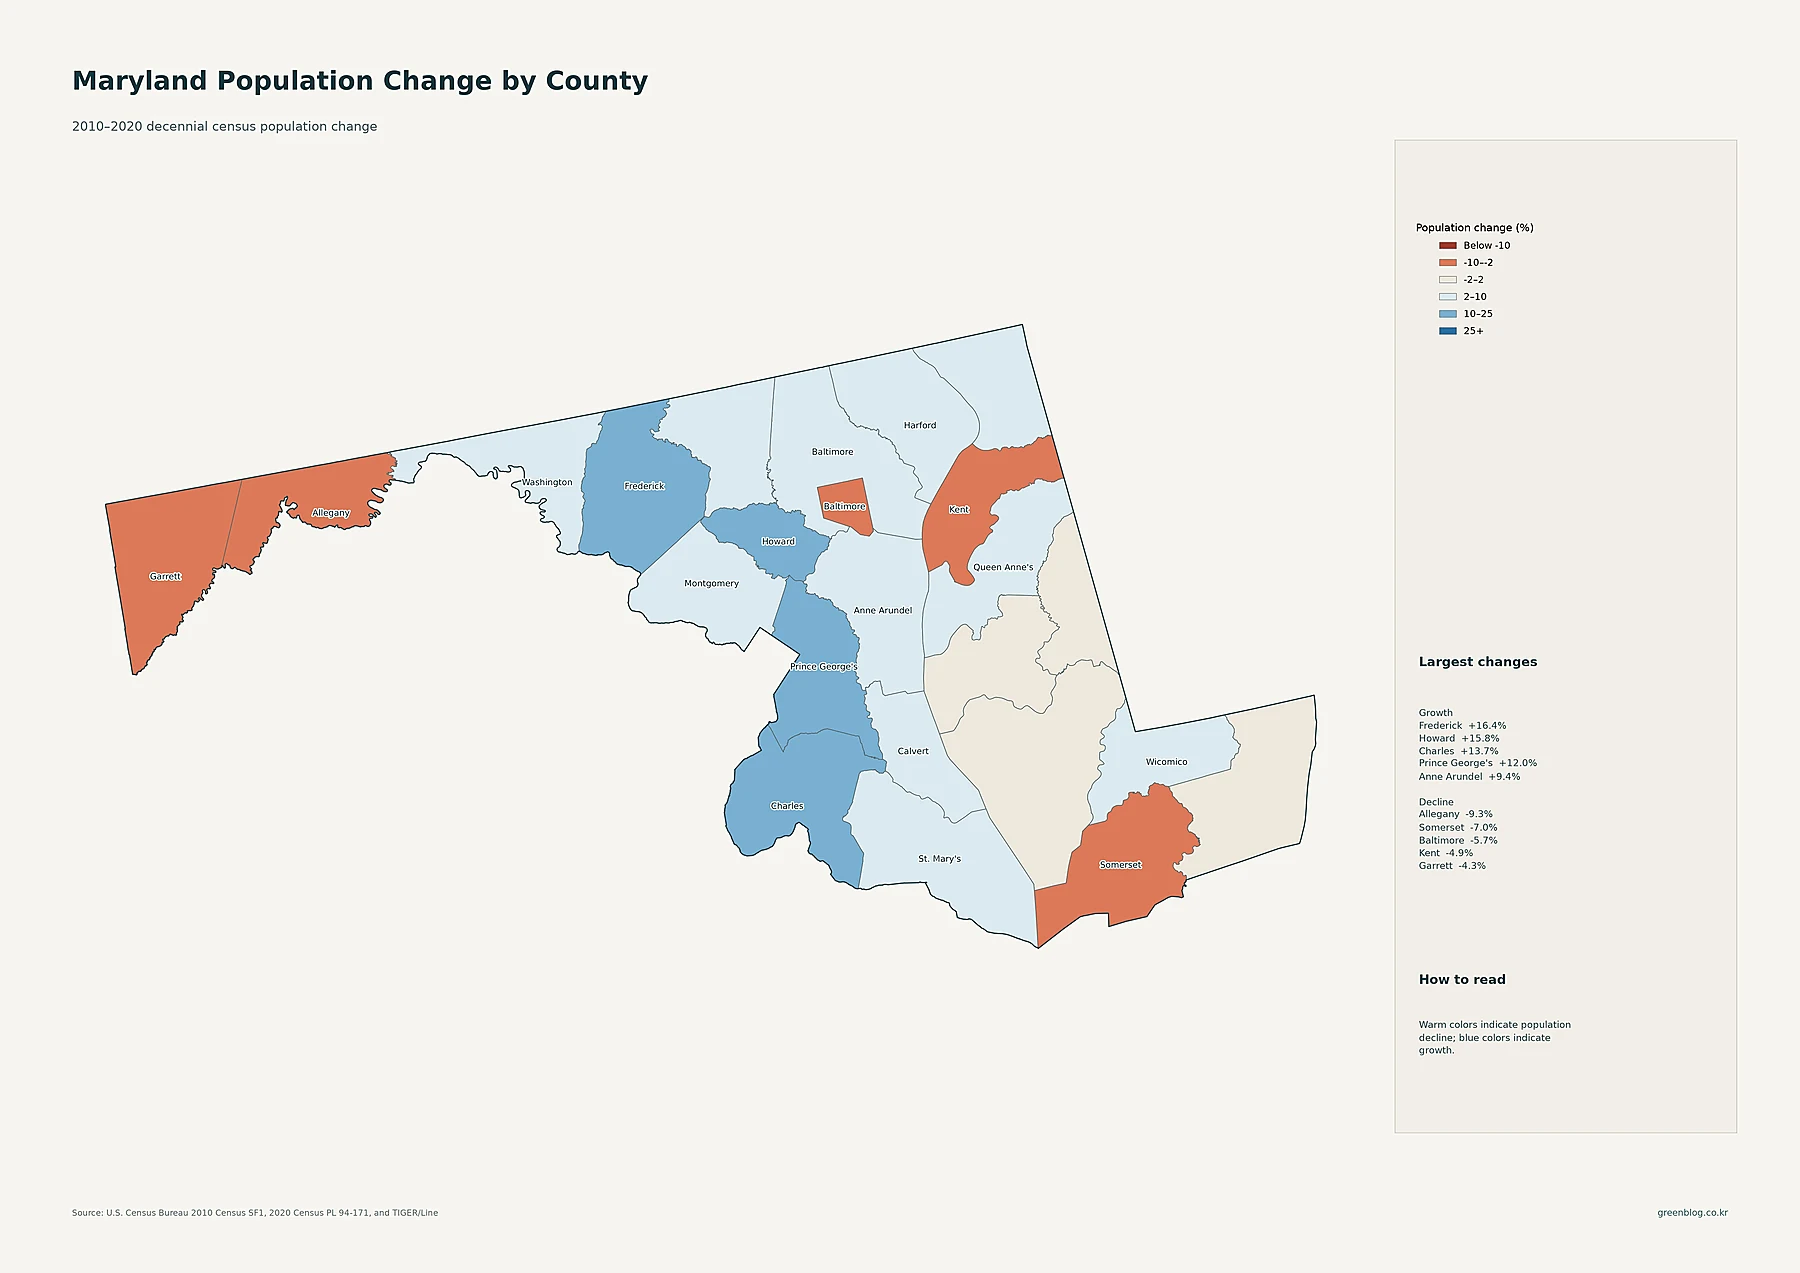
Frederick County had the largest percentage increase at about 16.4%. Howard County grew 15.8%, Charles County 13.7%, Prince George’s County 12.0%, Anne Arundel County 9.4%, Montgomery County 9.3%, and St. Mary’s County 8.2%. The strongest growth colors therefore appear across several central and southern counties rather than in a single isolated unit.
The ranking also shows why current size and growth should not be treated as the same measure: Montgomery is the largest county today, but Frederick had the faster percentage increase during the 2010–2020 interval.
Allegany County had the largest decline at about 9.3%. Somerset fell about 7.0%, Baltimore city 5.7%, Kent 4.9%, and Garrett 4.3%. Talbot and Dorchester were close to flat at roughly -0.7% and -0.3%, while Caroline was only slightly positive at about 0.7%.
The warm colors on the map identify where population fell between the two census counts, but the map does not establish why those changes occurred. Any explanation of causes would require separate demographic, housing, employment, or migration evidence.
The clearest way to use the set is to move from local concentration to county scale and then add time
Start with the detailed density map when the question is “where are people packed most tightly?” It reveals the continuous high-density network around Baltimore and the Washington-side suburbs, along with smaller centers such as Frederick and Hagerstown. Use the major-places map to identify the population centers within that pattern. Then move to the county-population map to compare the size of all 24 county-equivalent units, and to the county-density map to compare those same units after land area is taken into account.
The change map adds a different dimension. Baltimore city remains the state’s densest county-equivalent unit, but its population declined between 2010 and 2020. Frederick and Howard, by contrast, combine strong current central-Maryland concentrations with some of the fastest growth rates in that decade.
Garrett is both sparsely populated and low density, while Montgomery combines the state’s largest county population with one of its highest density values. Reading all five maps together makes those distinctions visible without reducing Maryland to a single statewide number.
Download the Maryland population map collection
The ZIP collection includes detailed census-tract density, major cities and urban areas, county-equivalent population totals, 2010–2020 population change, and county-equivalent population density.
FAQ
Which Maryland county has the largest population?
Montgomery County is the largest in the supplied 2024 ACS data with 1,065,949 residents. Prince George’s County is second at 959,754 and Baltimore County is third at 850,796.
Which Maryland area has the highest population density?
Baltimore city has the highest county-equivalent density at about 7,082 people per square mile. Montgomery County is next at about 2,162, followed by Prince George’s County at about 1,989. Baltimore city is an independent city rather than a county, but the Census Bureau treats it as a county equivalent.
Which Maryland county changed the most from 2010 to 2020?
Frederick County had the largest percentage growth at about 16.4%, followed by Howard County at 15.8%. Allegany County recorded the largest decline at about 9.3% over the same decennial-census interval.
Related Maps
Sources
- U.S. Census Bureau — American Community Survey (ACS): 2024 ACS 5-year population estimates used for current population and density measures.
- U.S. Census Bureau — TIGER/Line Shapefiles: 2024 county-equivalent, census tract, and place geography used in the maps.
- U.S. Census Bureau — Decennial Census: 2010 and 2020 population counts used for the change comparison.
Green Map creates custom-edited map images using open geographic data sources such as geoBoundaries, Natural Earth, OpenStreetMap, and government open data. These maps are edited visual materials, not raw data files, and are provided for education, documents, presentations, and graphic reference.