Massachusetts packs sharp population contrasts into a relatively small state. The supplied 2024 ACS 5-year estimates put the statewide population at 7,044,056. The county-density map reports about 7,801 square miles of land and an average density near 903 people per square mile, but that average hides the real pattern. Greater Boston contains an extensive high-density core, several other cities create smaller clusters across central and western Massachusetts, and broad parts of the Berkshires and northwestern interior remain much more lightly settled.
The five supplied maps measure different things, and they are most useful when those measures are kept separate. The tract and county-density maps show residents per unit of land. The city and county-population maps use proportional circles to compare total residents, not density. The current maps use 2024 ACS estimates, whereas the change map compares the 2010 and 2020 Decennial Census counts. That distinction explains how Middlesex can have the state’s largest county population, Suffolk can have by far the highest county density, and Nantucket can lead the decade in percentage growth at the same time.
Table of Contents
Census tracts show a continuous high-density Greater Boston pattern that county averages blur
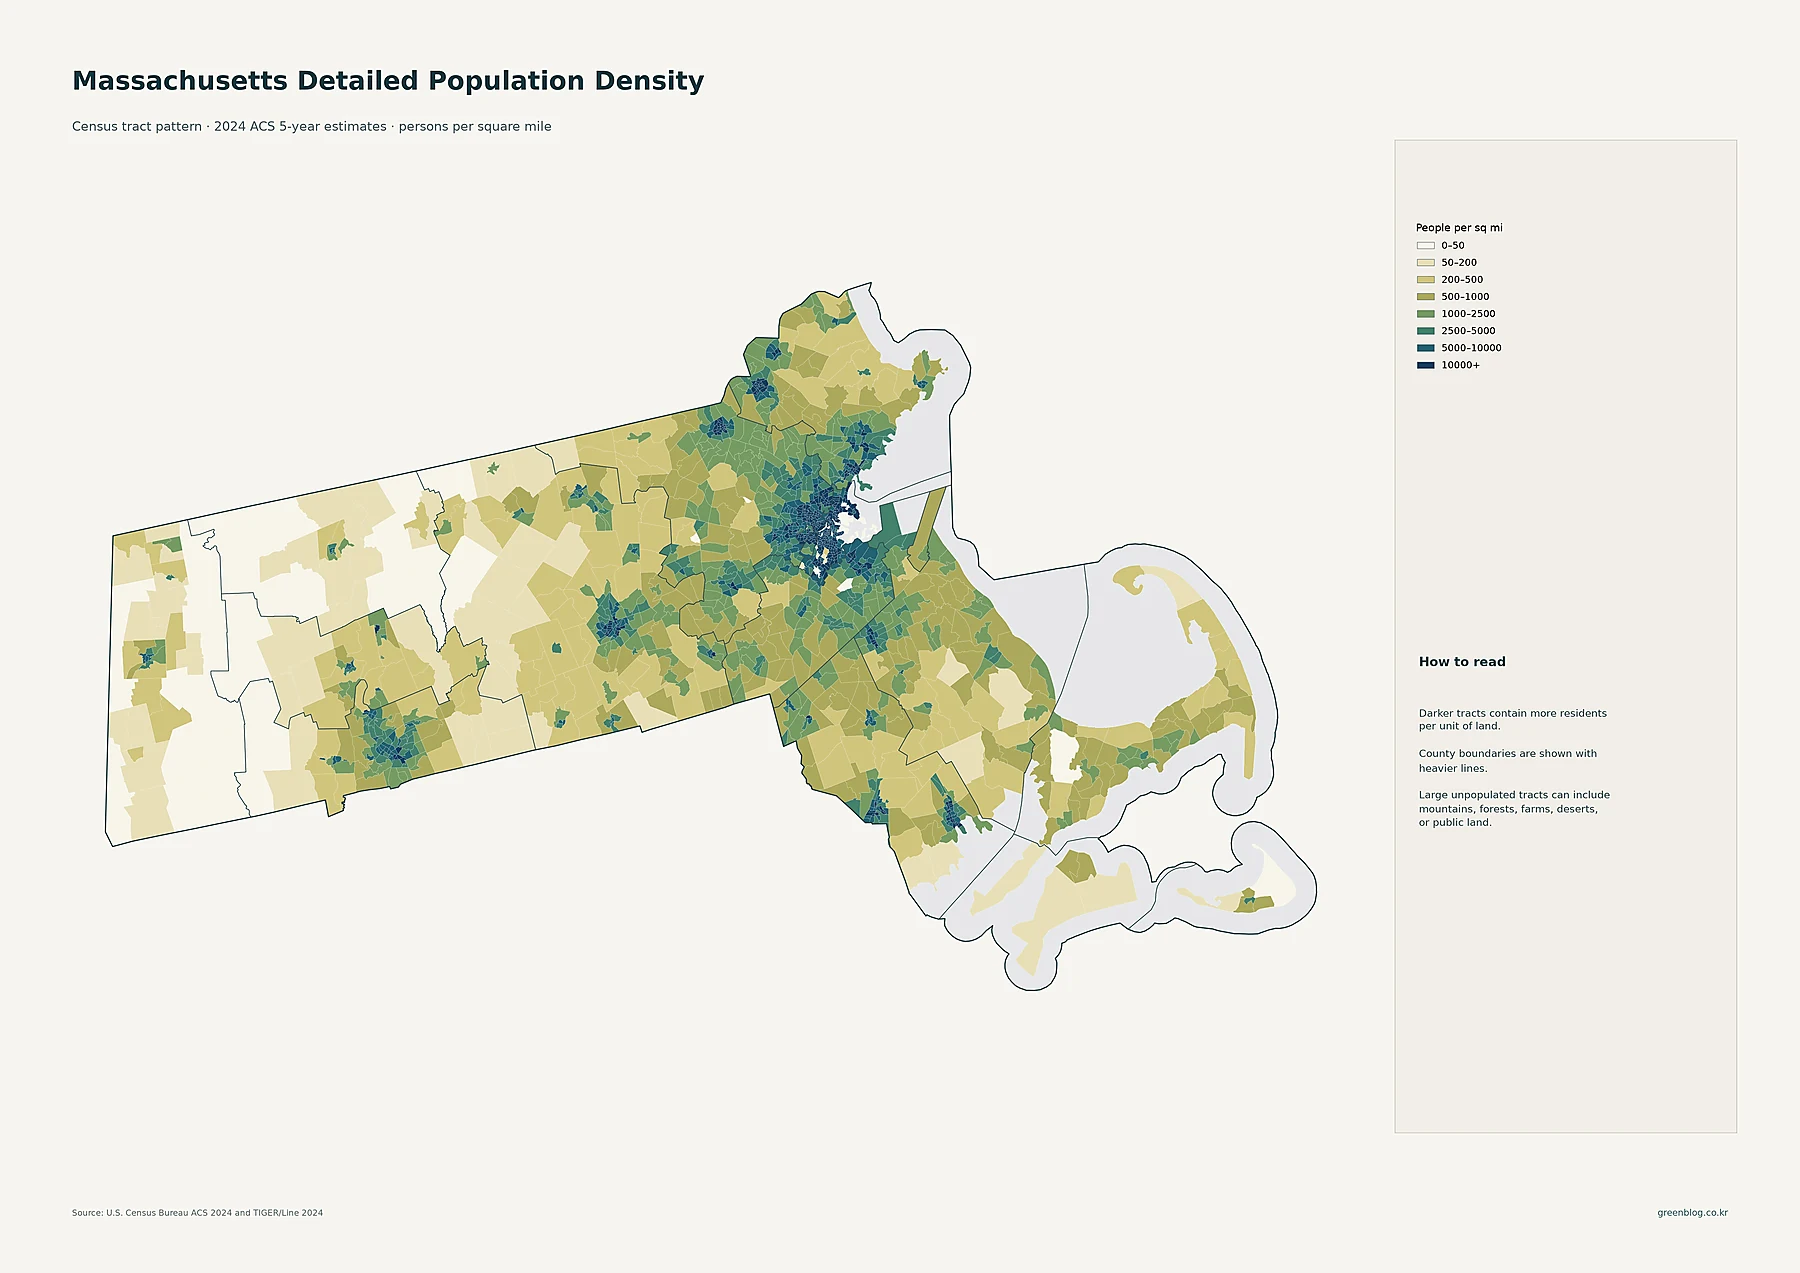
The darkest and most continuous tract cluster surrounds Boston. High-density tracts extend through Cambridge, Somerville, Chelsea, Revere and nearby communities, then continue through a broad ring of eastern suburbs rather than ending at the Boston city boundary. Smaller but still distinct concentrations appear around Lowell and Lawrence to the north, Worcester in central Massachusetts, and Springfield in the Connecticut River valley. The map therefore shows a hierarchy of urban centers: several important regional clusters exist, but Greater Boston covers the widest area and contains the greatest concentration of the darkest density classes.
Western Massachusetts looks very different. Large parts of Berkshire and Franklin counties fall into the lightest or lower-middle categories, with compact darker patches around settled centers rather than continuous urban fabric. Cape Cod also contains a mix of populated strips and lighter areas; it does not form the same uninterrupted high-density field seen around Boston. This is why the tract map adds information that the county map cannot. A single county average may describe the overall level, but the tract pattern shows exactly where dense settlement is concentrated inside that county and where large low-density spaces remain.
Boston is the largest census place, surrounded by an unusually dense network of sizable cities
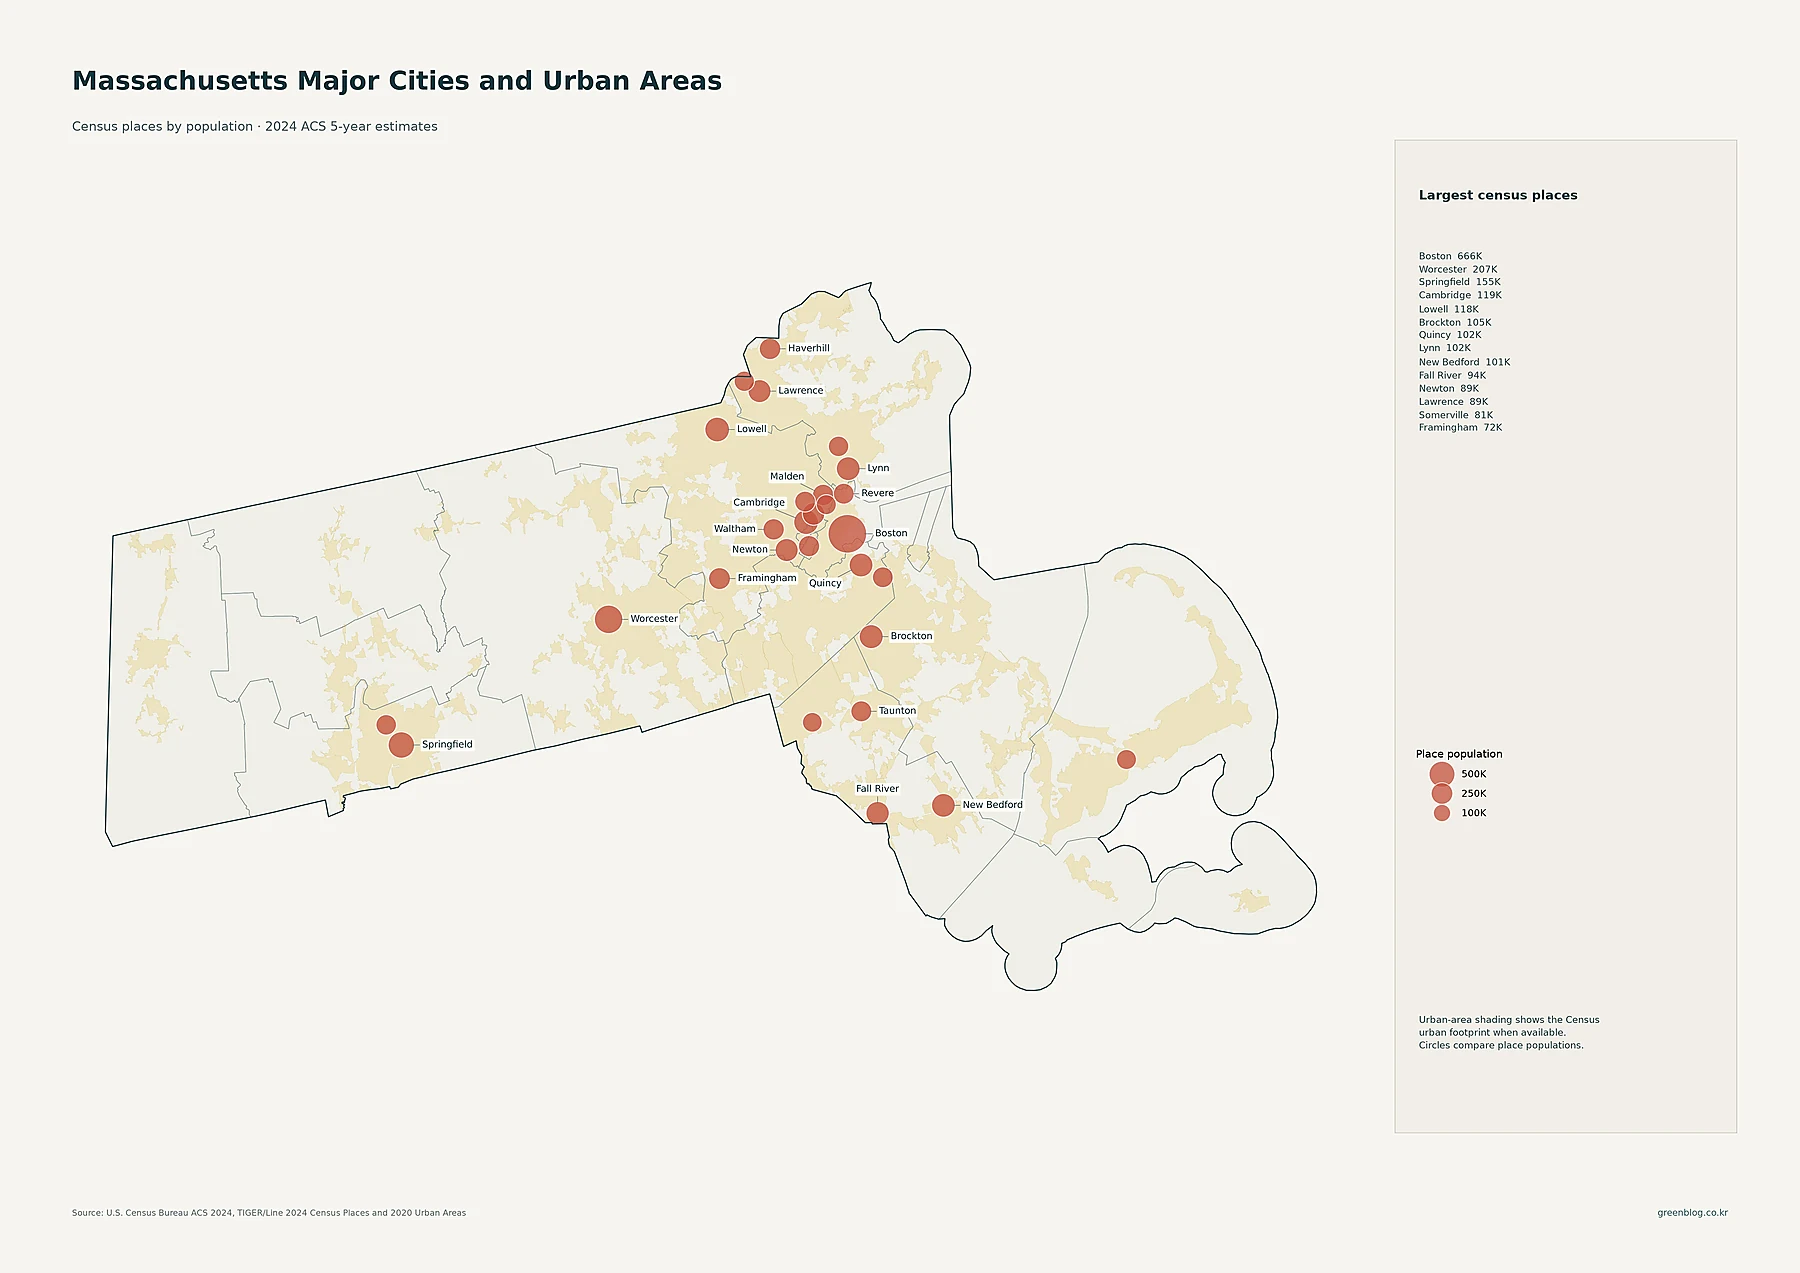
Boston is the largest census place in the supplied data at 666,442 residents. Worcester is second at 207,055 and Springfield third at 154,749. Cambridge has 118,796 residents and Lowell 118,368, followed by Brockton at 105,386, Quincy at 102,114, Lynn at 101,709 and New Bedford at 100,998. Fall River has 94,082 residents, Newton 89,044, Lawrence 88,736 and Somerville 81,036. Framingham, Haverhill, Malden, Waltham, Brookline, Taunton and Revere also appear among the larger places.
The geographic arrangement matters as much as the ranking. A large group of substantial places sits close together around Boston, including Cambridge, Quincy, Lynn, Newton, Somerville, Malden, Revere and Waltham. Worcester and Springfield stand out as separate inland anchors, while Brockton, Taunton, Fall River and New Bedford form a south and southeastern chain of population centers. The circles on this map represent total place population. They should not be read as density symbols: a large circle identifies a large population, while the tract map is the better source for judging how tightly that population occupies the surrounding land.
Middlesex has more than 1.6 million residents and leads a heavily populated eastern county group
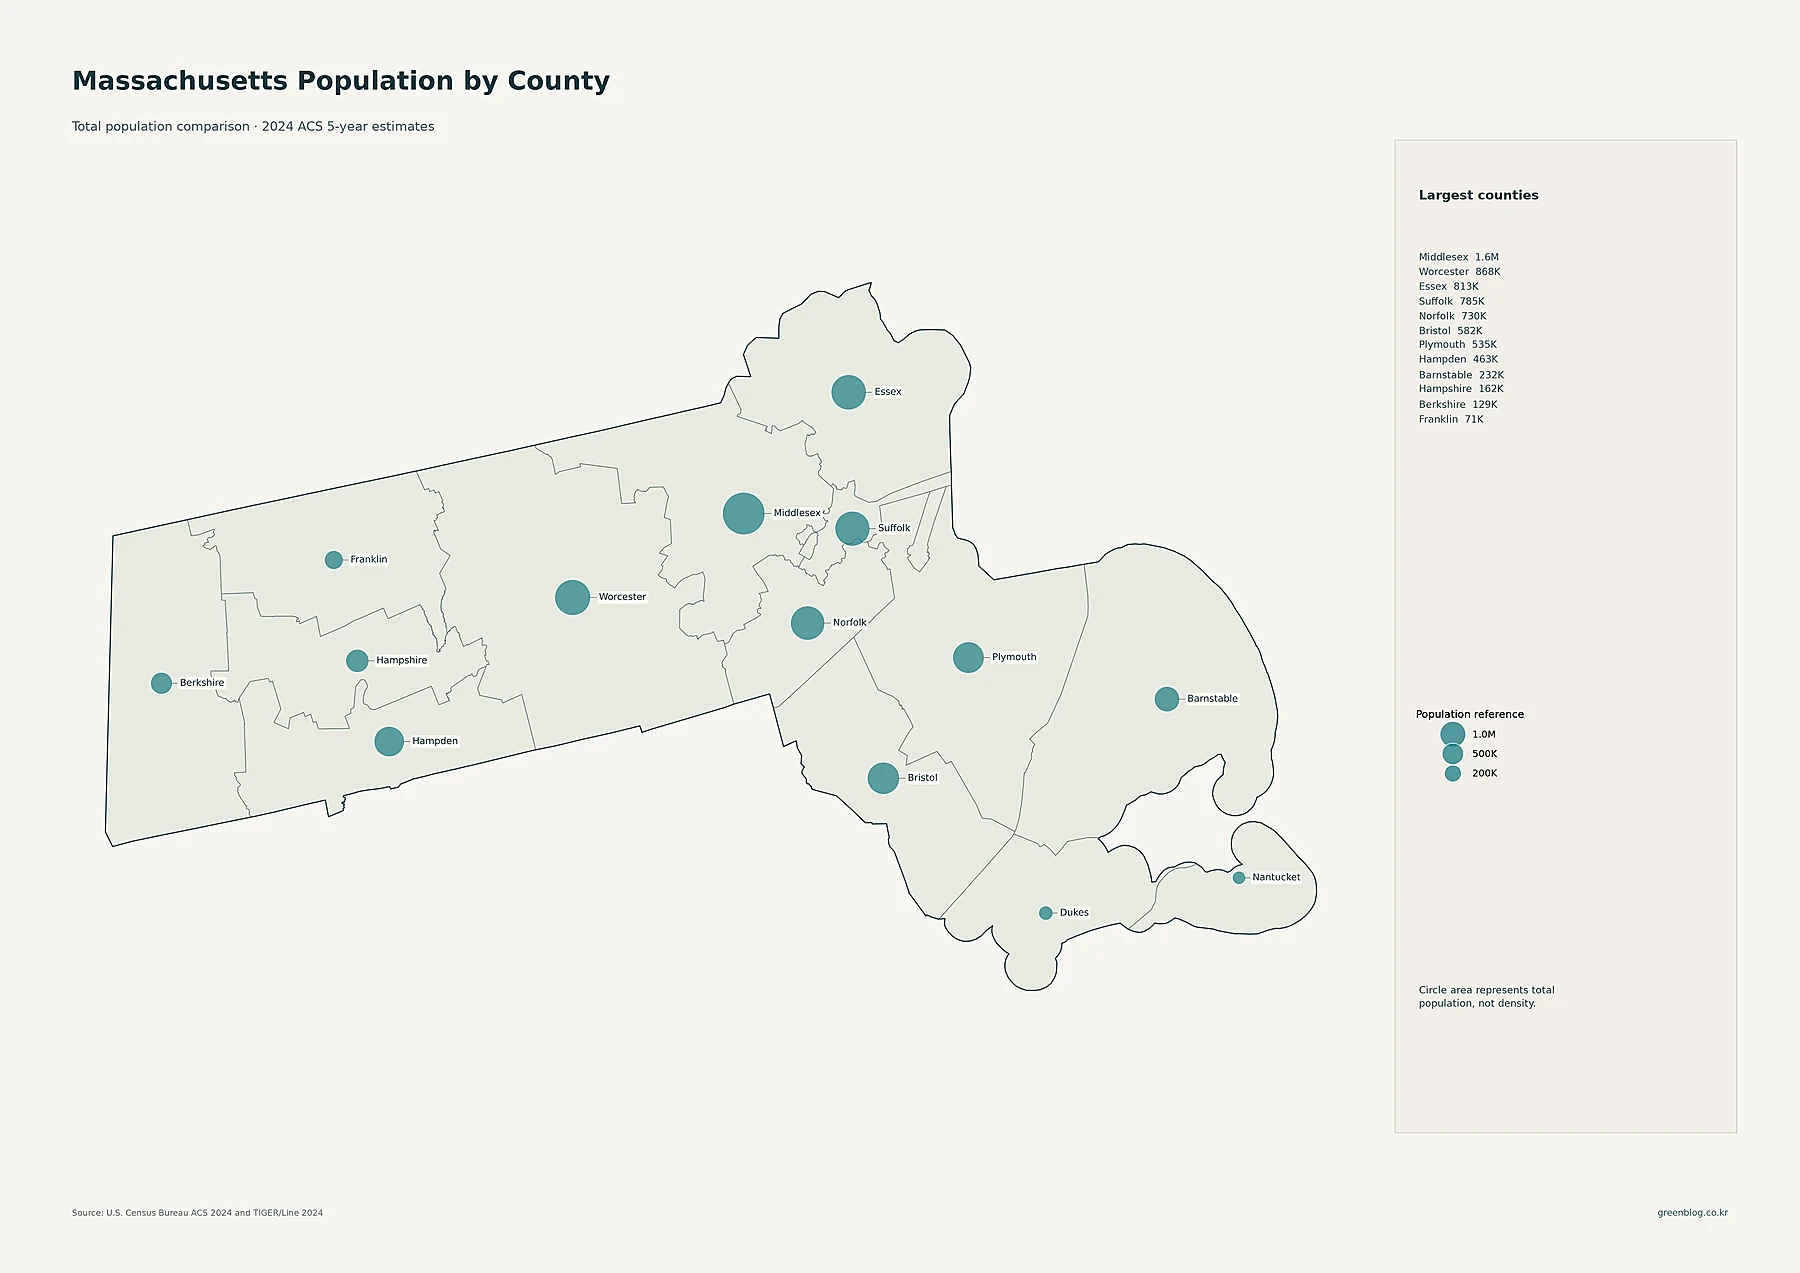
Middlesex County is the clear population leader at 1,638,365 residents. Worcester County follows at 867,788, Essex at 813,054, Suffolk at 785,121 and Norfolk at 730,082. Bristol has 582,270 residents, Plymouth 535,075 and Hampden 462,815. The proportional circles make eastern Massachusetts visually dominant, but they also show that a large inland county such as Worcester can rank very high in total population even when its average density is well below the compact Boston-area counties.
The smallest county totals are on the islands and in the northwestern interior. Nantucket County has 14,483 residents, Dukes County 20,933 and Franklin County 70,944. Berkshire County has 129,430 residents, while Hampshire has 162,028 and Barnstable 231,668. These values provide an important check on the later change map. Nantucket and Dukes have tiny current populations compared with Middlesex or Worcester, yet they recorded the largest percentage increases from 2010 to 2020. A small circle can therefore coexist with a high growth rate because total population and percentage change are separate measures.
Suffolk’s density is in a different range from every other Massachusetts county
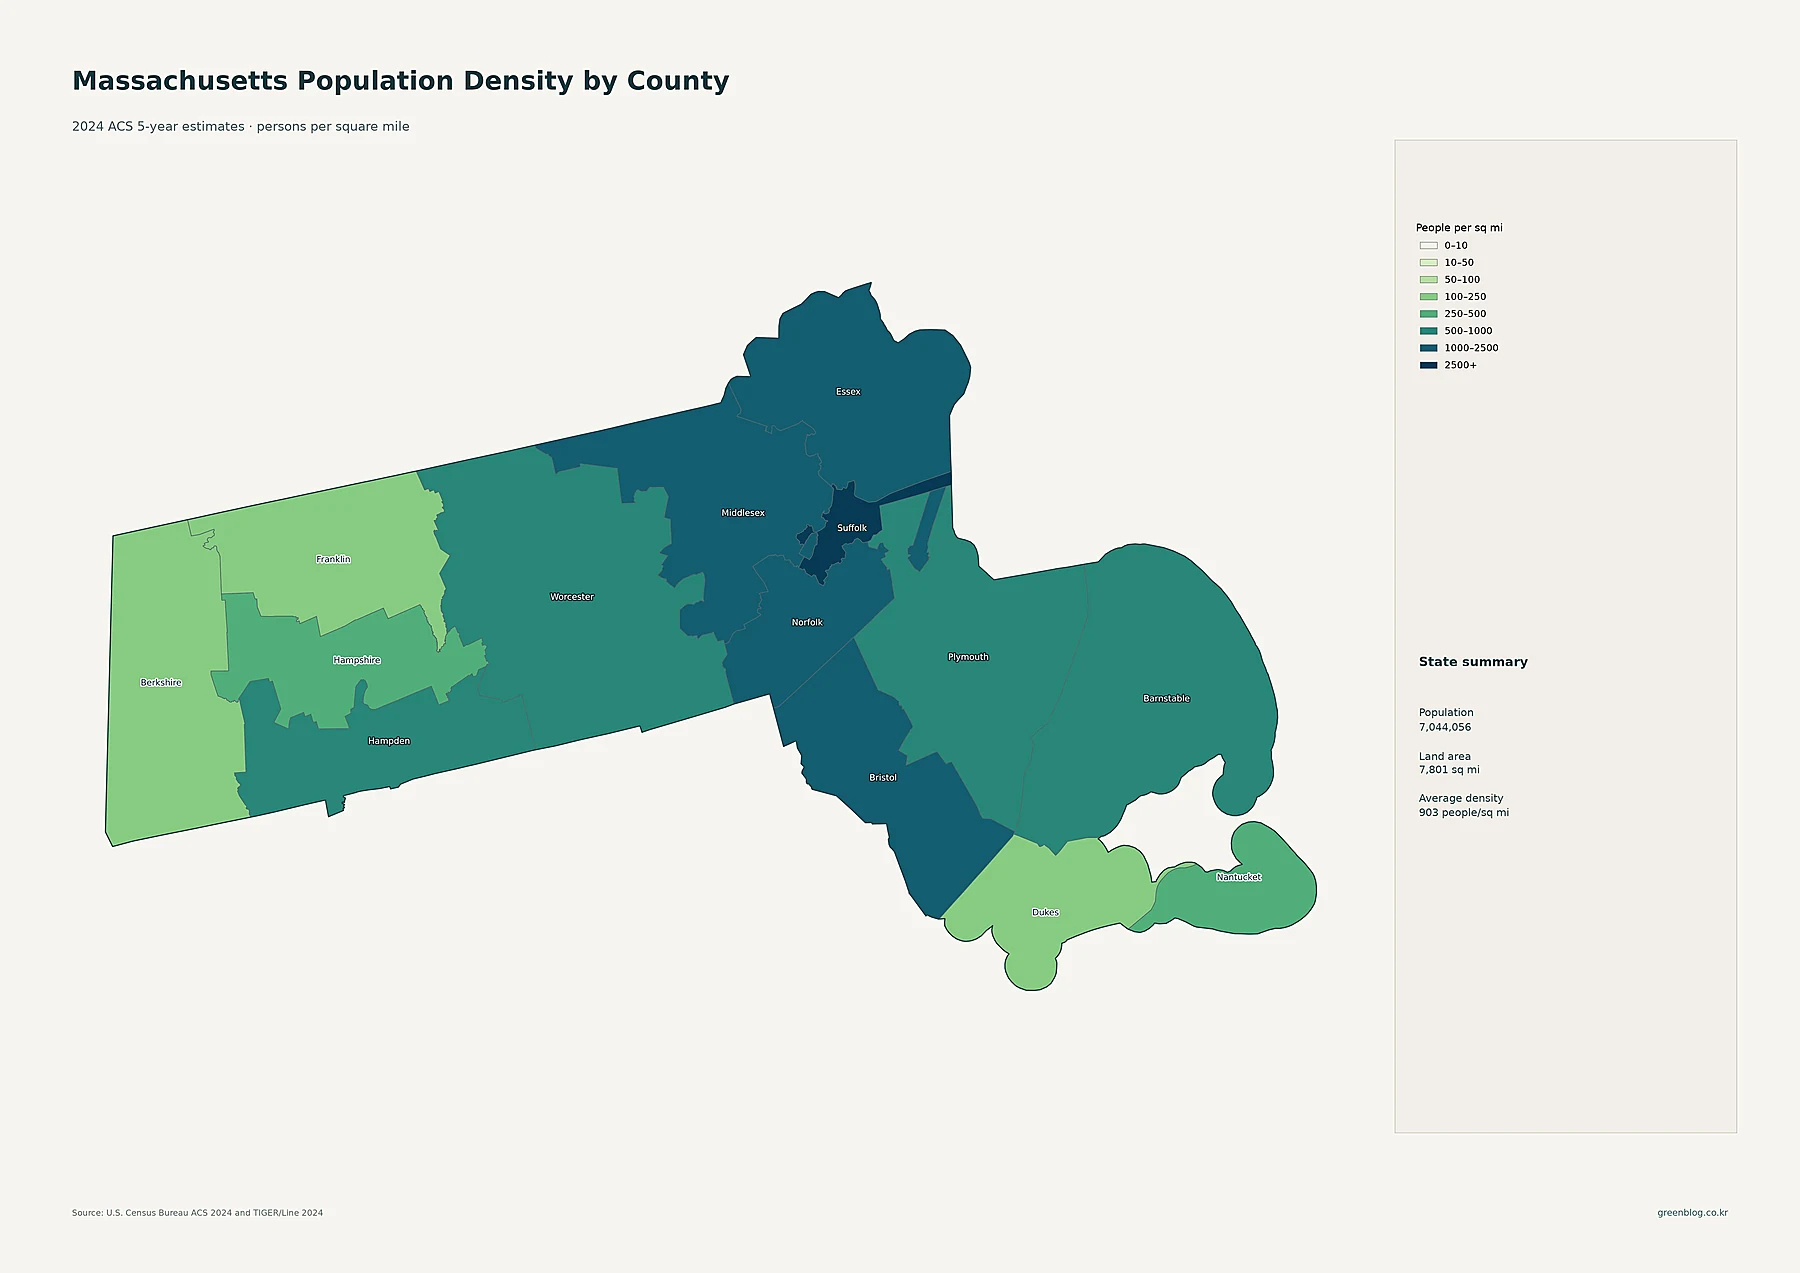
Suffolk County averages about 13,477 people per square mile, far above every other county in the dataset. Middlesex is about 2,003, Norfolk about 1,843, Essex about 1,651 and Bristol about 1,053. Plymouth is roughly 813 and Hampden about 750. The comparison with total population is especially useful: Middlesex has more than twice Suffolk’s population, but Suffolk is roughly 6.7 times as dense. Middlesex contains many densely settled communities, yet its much larger land area lowers its countywide average.
At the low-density end, Franklin averages about 101 people per square mile and Berkshire about 140. Dukes is roughly 203, Hampshire 307 and Nantucket 314. Worcester, despite having the state’s second-largest county population, averages only about 574 people per square mile because its population is distributed across a much larger area. Barnstable is similar at about 588. These differences show why a county population ranking cannot substitute for a density ranking. “How many people live there?” and “how closely are they packed?” are different questions and can produce very different leaders.
| Measure | Leading area | Value in the supplied data |
|---|---|---|
| State population | Massachusetts | 7,044,056 |
| Largest county population | Middlesex County | 1,638,365 |
| Highest county density | Suffolk County | about 13,477/sq mi |
| Fastest 2010–2020 growth | Nantucket County | +40.1% |
| Largest 2010–2020 decline | Berkshire County | -1.7% |
Nantucket and Dukes grew fastest from 2010 to 2020, while only two counties declined
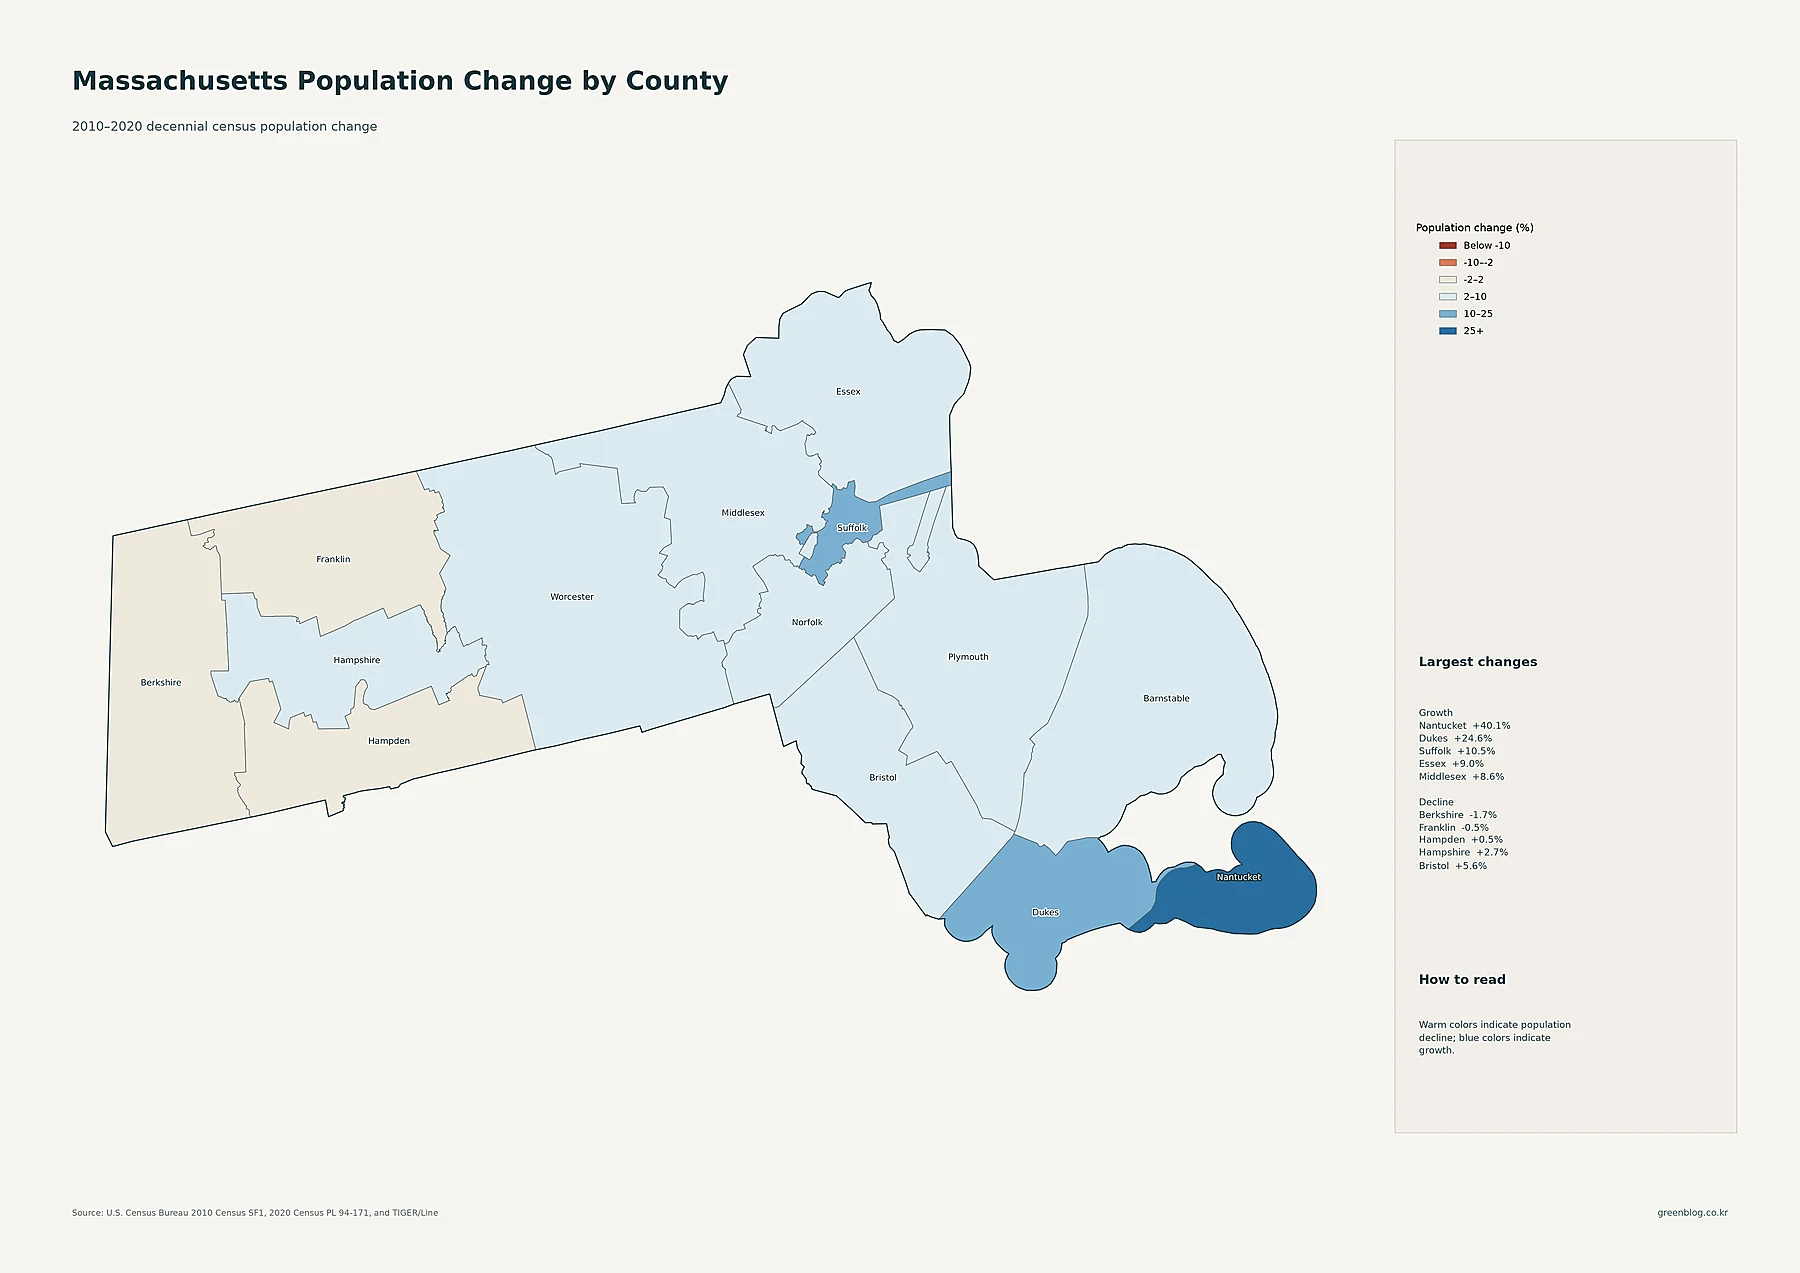
Nantucket County recorded the largest percentage increase, rising from 10,172 residents in 2010 to 14,255 in 2020, or about 40.1%. Dukes County increased from 16,535 to 20,600, about 24.6%. Suffolk grew 10.5%, Essex 9.0%, Middlesex 8.6%, Norfolk 8.2% and Worcester 8.0%. Plymouth increased 7.3%, Barnstable 6.1% and Bristol 5.6%. The map’s strongest growth colors therefore appear on the islands, even though the largest current county populations remain on the mainland.
Only Berkshire and Franklin counties declined over the decade. Berkshire fell about 1.7% and Franklin about 0.5%. Hampden was close to flat with a gain of roughly 0.5%, while Hampshire grew 2.7%. These percentages describe the difference between the 2010 and 2020 census counts; they do not identify the causes of change. Explaining why a county gained or lost population would require additional official evidence on migration, housing, age structure, employment, enrollment or other demographic factors.
Reading the set together separates size, crowding and change instead of collapsing them into one ranking
A useful sequence is to start with the detailed density map to locate the actual high-density tracts. The city map then identifies the large population centers within those patterns. Next, the county-population map compares the total number of residents in all 14 counties, while the county-density map adjusts those totals for land area. The 2010–2020 change map adds a time dimension and shows whether each county grew or declined during the decade.
Several contrasts become clear when the maps are read in that order. Middlesex is the largest county by population, but Suffolk is by far the densest. Boston is the largest census place and sits inside the state’s broadest concentration of high-density tracts. Nantucket and Dukes have the two smallest county populations, yet they had the two fastest percentage growth rates from 2010 to 2020. Berkshire and Franklin combine low current density with the only county-level declines in the period. Those differences are more informative than a single statewide average because they show how metropolitan concentration, county size and population change overlap without being the same thing.
Download the Massachusetts population map collection
The ZIP collection includes detailed census-tract density, major cities and urban areas, county population totals, 2010–2020 population change, and county population density.
FAQ
Which Massachusetts county has the largest population?
Middlesex County is the largest in the supplied 2024 ACS data with 1,638,365 residents. Worcester County is second at 867,788 and Essex County is third at 813,054.
Which Massachusetts county has the highest population density?
Suffolk County has the highest average density at about 13,477 people per square mile. Middlesex is next at about 2,003, followed by Norfolk at about 1,843. The county with the largest population is therefore not the same as the county with the highest density.
Which Massachusetts county changed the most from 2010 to 2020?
Nantucket County had the largest percentage growth at about 40.1%, followed by Dukes County at about 24.6%. Berkshire County recorded the largest decline at about 1.7% over the same decennial-census interval.
Related Maps
Sources
- U.S. Census Bureau — American Community Survey (ACS): 2024 ACS 5-year population estimates used for current population and density measures.
- U.S. Census Bureau — TIGER/Line Shapefiles: 2024 county, census tract and census-place geography used in the maps.
- U.S. Census Bureau — Decennial Census: 2010 and 2020 population counts used for the change comparison.
Green Map creates custom-edited map images using open geographic data sources such as geoBoundaries, Natural Earth, OpenStreetMap, and government open data. These maps are edited visual materials, not raw data files, and are provided for education, documents, presentations, and graphic reference.