Jim Hogg County is easier to understand when Hebbronville is used as the starting point. The county map places the seat near the north, where several numbered highways meet, while much of the county stretches south across a far more lightly labeled landscape. The accompanying water and elevation maps add another layer by showing named creeks and arroyos as well as a broad change in height from the higher western side to the lower east. High-resolution JPG versions of all three supplied maps are available in the download archive below.
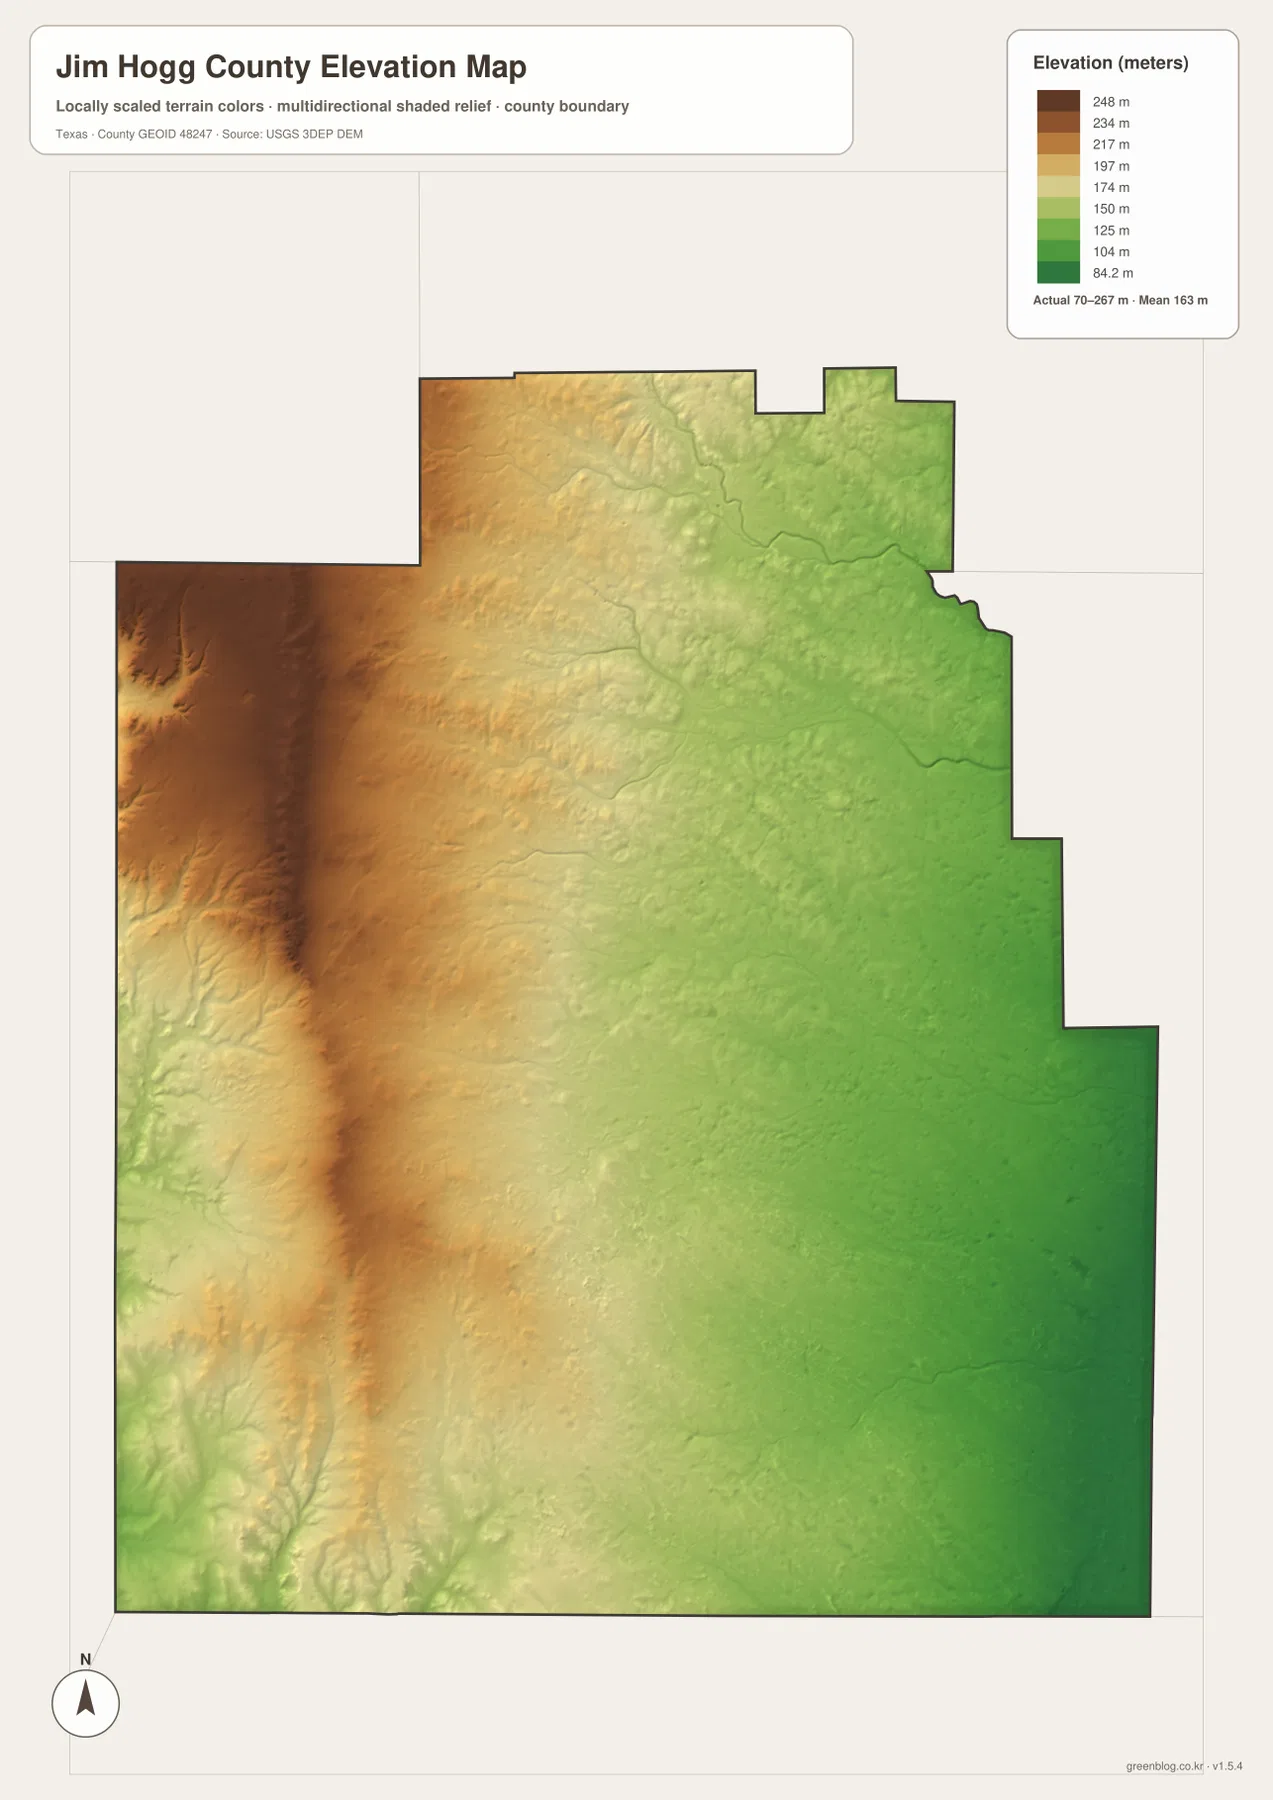
The maps are useful for different questions. The county map is best for roads, communities, and the boundary; the water map focuses on named drainage features; and the elevation map shows terrain from roughly 70 to 267 meters. Read together, they show why Jim Hogg County should not be reduced to Hebbronville alone: a compact northern center sits within a much larger rural area where roads, dry-country drainage, and gradual elevation change are more prominent than dense settlement.
Table of Contents
Hebbronville and the Road Network at the North End
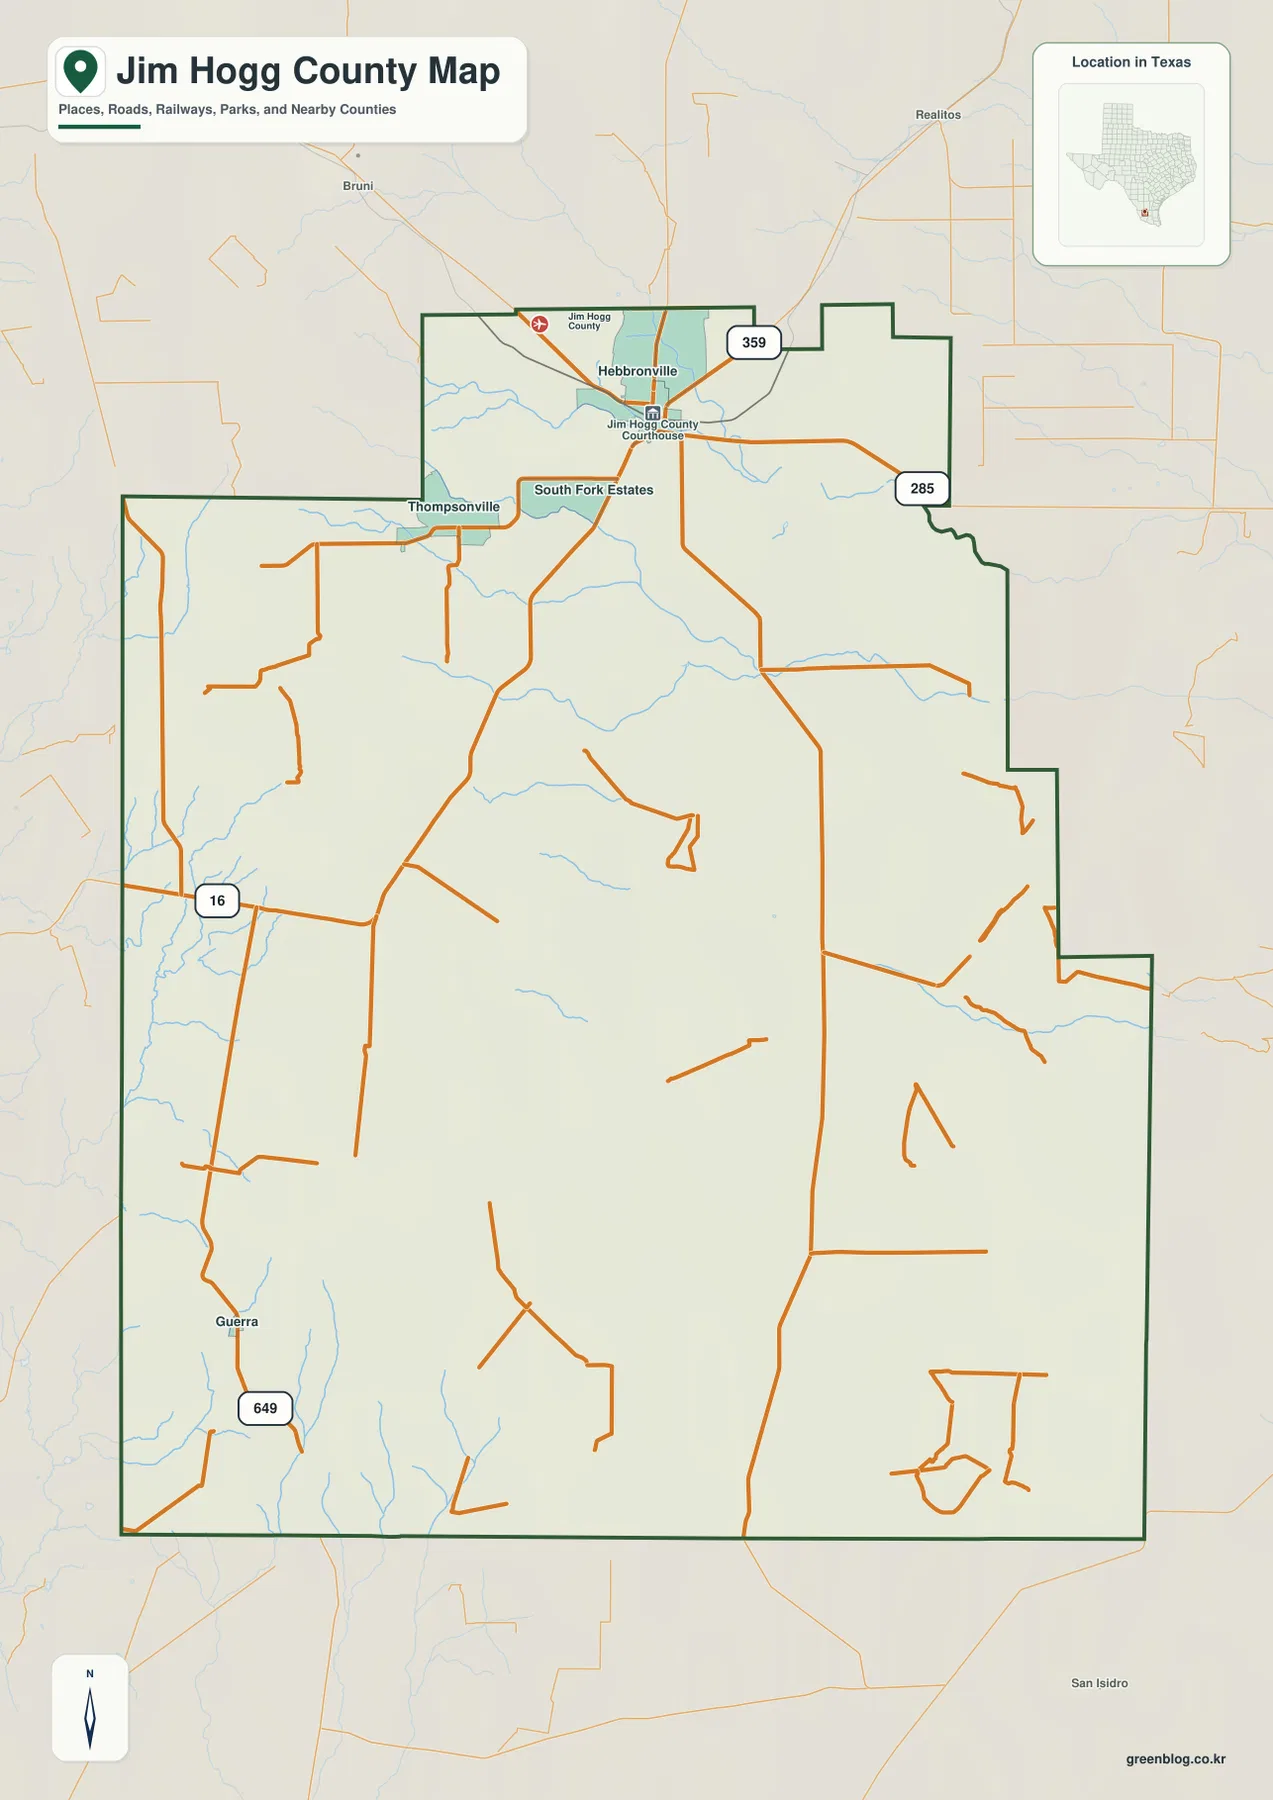
Hebbronville is the clearest place name on the county map and provides a practical point of orientation. The Jim Hogg County Courthouse is marked there, and routes 16, 285, and 359 are all visible nearby. Thompsonville lies to the west, while South Fork Estates appears just south of Hebbronville. These labels make the northern part of the county feel relatively concentrated compared with the large area that extends to the south.
That contrast becomes stronger farther down the page. Roads continue across the county, but community labels become sparse. Guerra appears in the southwest near Route 649, providing one of the few named settlement references in the southern half. For readers trying to judge distance or direction, this is important: the map is not a dense town-to-town diagram. It shows a small number of recognizable places separated by long stretches of rural land.
A County Boundary That Is Wider and More Irregular in the North
The outline itself is useful when identifying Jim Hogg County on a regional map. Its northern edge steps through several corners rather than following one simple straight line, and the upper western side includes a broad indentation before the county expands into its larger southern body. Finding Hebbronville first makes this shape easier to follow because the town sits close to the complicated northern section.
Several labels outside the boundary help with regional orientation. Bruni appears to the northwest, Realitos to the northeast, and San Isidro to the southeast. These are not presented as destinations inside Jim Hogg County; instead, they help show which direction the surrounding South Texas communities lie. When the county boundary is the main subject, those nearby names make it easier to see where the map ends and the surrounding area begins.
Creeks and Arroyos Across a Broad Rural Interior
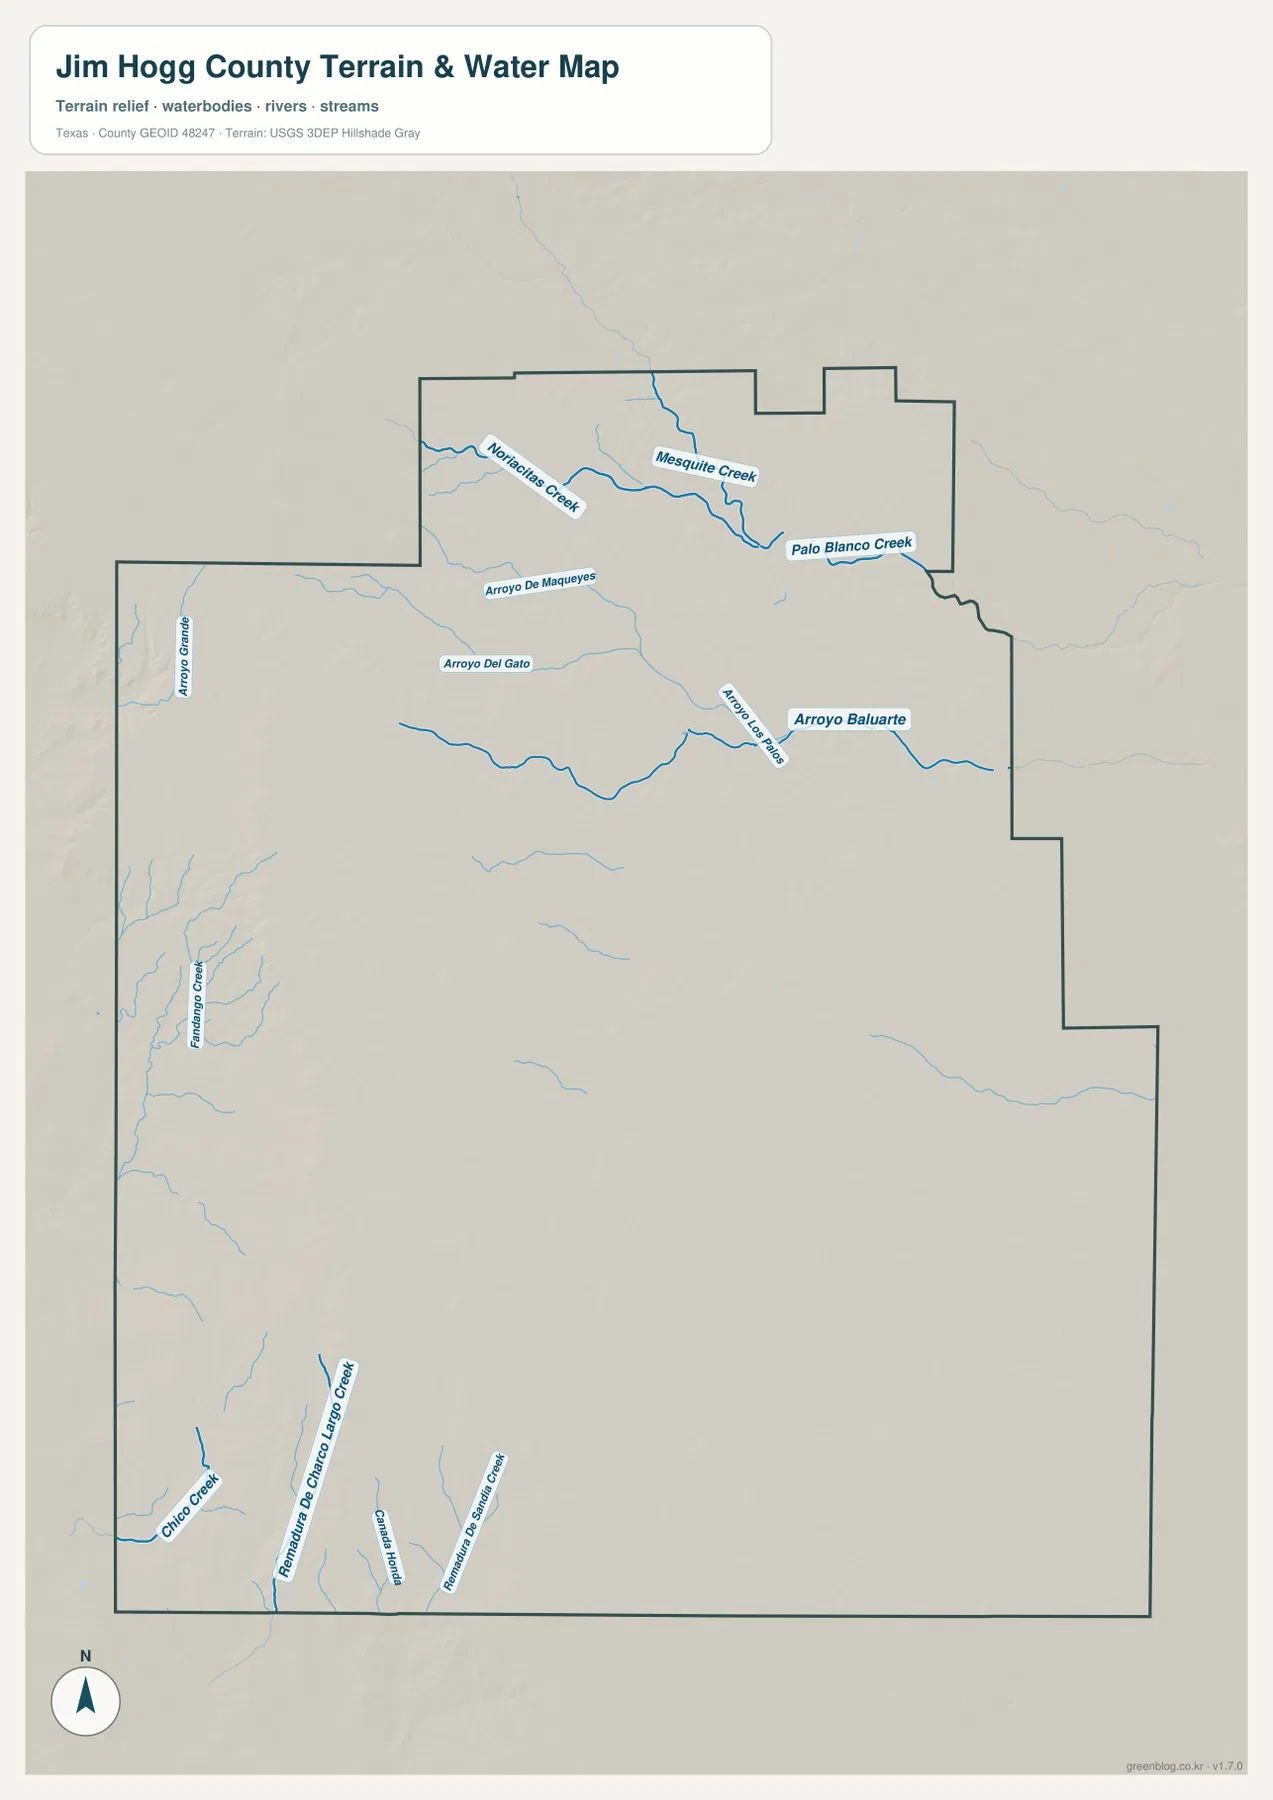
The terrain-and-water map is dominated by smaller named channels rather than a large river or reservoir. In the north, Mesquite Creek and Palo Blanco Creek are clearly labeled. Arroyo del Gato and Arroyo Baluarte run across the central part of the county, while features such as Ramireno Creek and Chicho Creek appear farther west and southwest. The result is a network of narrow drainage lines spread across otherwise open terrain.
This map should be read as a reference for the location and names of mapped waterways. It does not show current flow, flood risk, navigability, property limits, or legal water boundaries. A creek or arroyo can be important as a geographic feature even when conditions on the ground vary by season. For map study, the useful information here is the direction and distribution of the channels and how they relate to the county boundary.
Higher Ground in the West, Lower Terrain Toward the East
The elevation map shows one of the county’s strongest visible geographic patterns. The mapped actual range is about 70 to 267 meters, with a mean near 163 meters. Brown and tan shades cover much of the west, while greener colors become more common toward the east. This creates a clear west-to-east transition rather than a landscape centered on one isolated high point.
The western edge and northwest contain the most prominent higher terrain in the supplied map. Moving through the center toward the east, elevation generally drops, and the southeast includes a broad area in the lowest color classes. The shaded relief also reveals small ridges and drainage cuts that are hard to notice on the road map alone. Because the elevation surface is generalized, it is appropriate for regional comparison but not for surveying, construction, or engineering measurements.
What Becomes Clear When the Three Maps Are Read Together
The county, water, and elevation maps complement one another without duplicating the same information. Hebbronville and the numbered highways provide the easiest human reference points. The creek map then fills in the broad spaces between settlements, showing that the rural interior contains many named drainage features. Finally, the elevation map explains the large-scale terrain change, with higher western land stepping down toward the east.
A practical way to use the set is to start with a place and road, then add physical geography. Locate Hebbronville and Route 16 on the county map, move to the water map to see which named channels cross the same general part of the county, and finish with the elevation map to determine whether that area lies on relatively high or low ground. This sequence works well for classroom map reading, regional orientation, and preparing simple reference graphics.
Choosing the Map That Fits the Task
Use the county map when the main goal is to identify Hebbronville, Guerra, roads, nearby communities, and the county outline. Choose the water map when creek and arroyo names matter more than transportation. The elevation map is the better option for showing the broad difference between the western high ground and lower eastern terrain. Since the archive contains the original high-resolution JPG versions, the files can also be used separately when one subject needs to remain visually simple.
Frequently Asked Questions
What is the easiest place to locate first on a Jim Hogg County map?
Start with Hebbronville. It is the most prominent community label, the county courthouse is marked there, and routes 16, 285, and 359 provide clear road references around the town.
Which side of Jim Hogg County is higher?
The supplied elevation map shows higher terrain concentrated in the west and lower terrain toward the east. Its actual mapped range is approximately 70 to 267 meters, with a mean near 163 meters.
Which named waterways appear on the supplied map?
Examples that are clearly labeled include Mesquite Creek, Palo Blanco Creek, Arroyo del Gato, Arroyo Baluarte, Chicho Creek, and Ramireno Creek. They are shown as geographic references rather than as a live-flow or flood map.
Map File Information
The archive contains the original high-resolution JPG files for the county, water, and elevation maps shown on this page.
- File Type: JPG
Related Maps
- Starr County
- Webb County Texas map
- Zapata County Texas map
- Willacy County Texas map
- San Patricio County Texas map
Sources and Further Reference
For official boundary and road data, see the U.S. Census Bureau TIGER/Line Shapefiles. Water features can be checked through USGS National Hydrography, while terrain and elevation data are available from the USGS 3D Elevation Program.
Green Map creates custom-edited map images using open geographic data sources such as geoBoundaries, Natural Earth, OpenStreetMap, and government open data.
These maps are edited visual materials, not raw data files, and are provided for education, documents, presentations, and graphic reference.