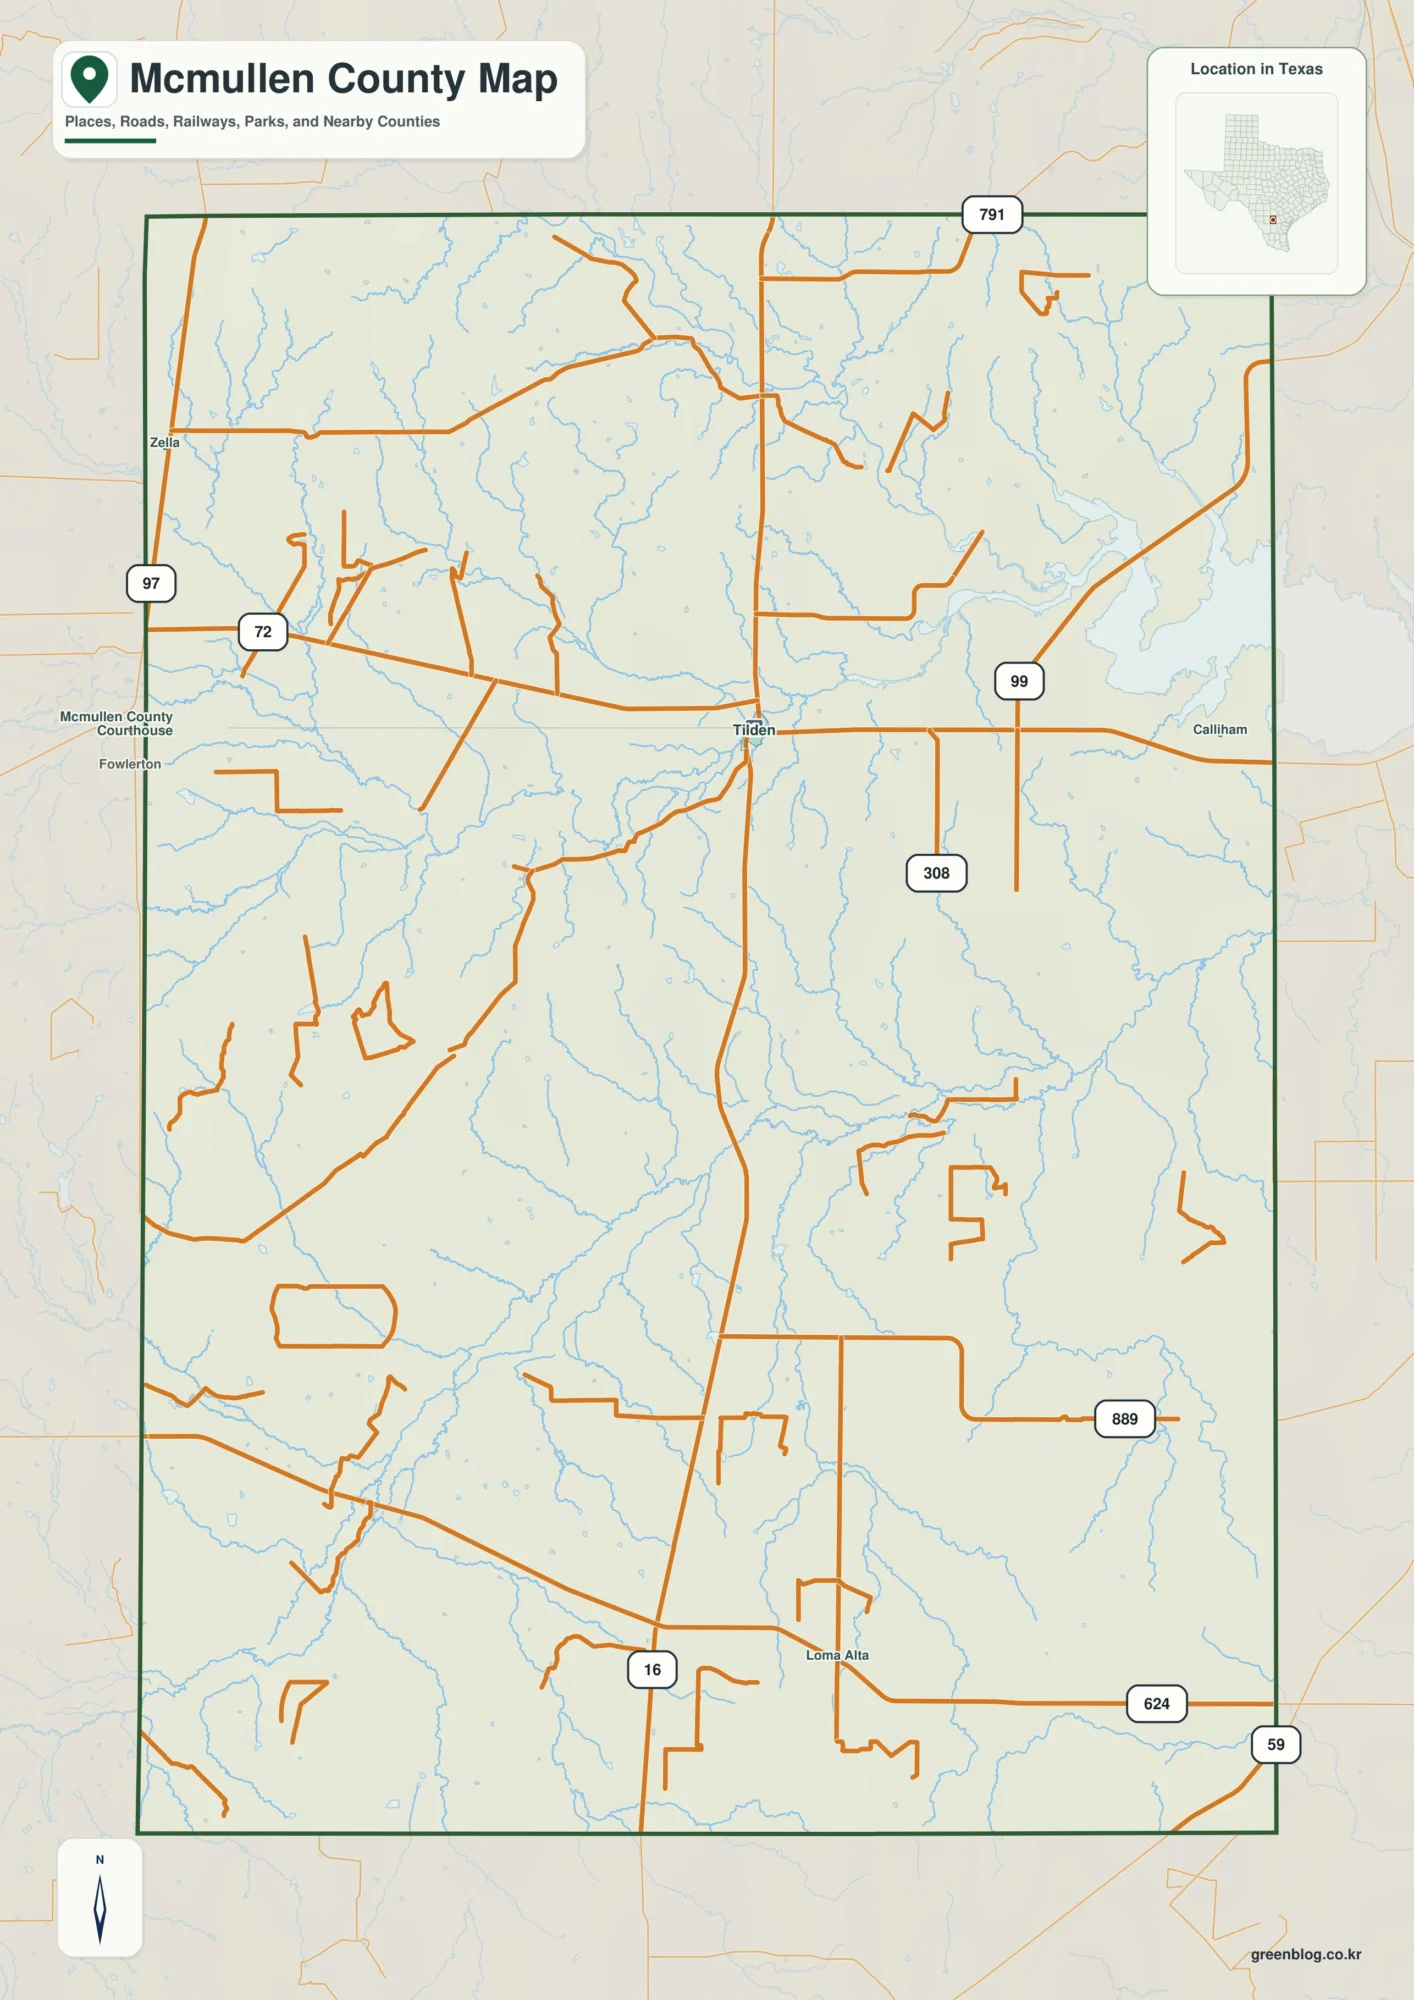
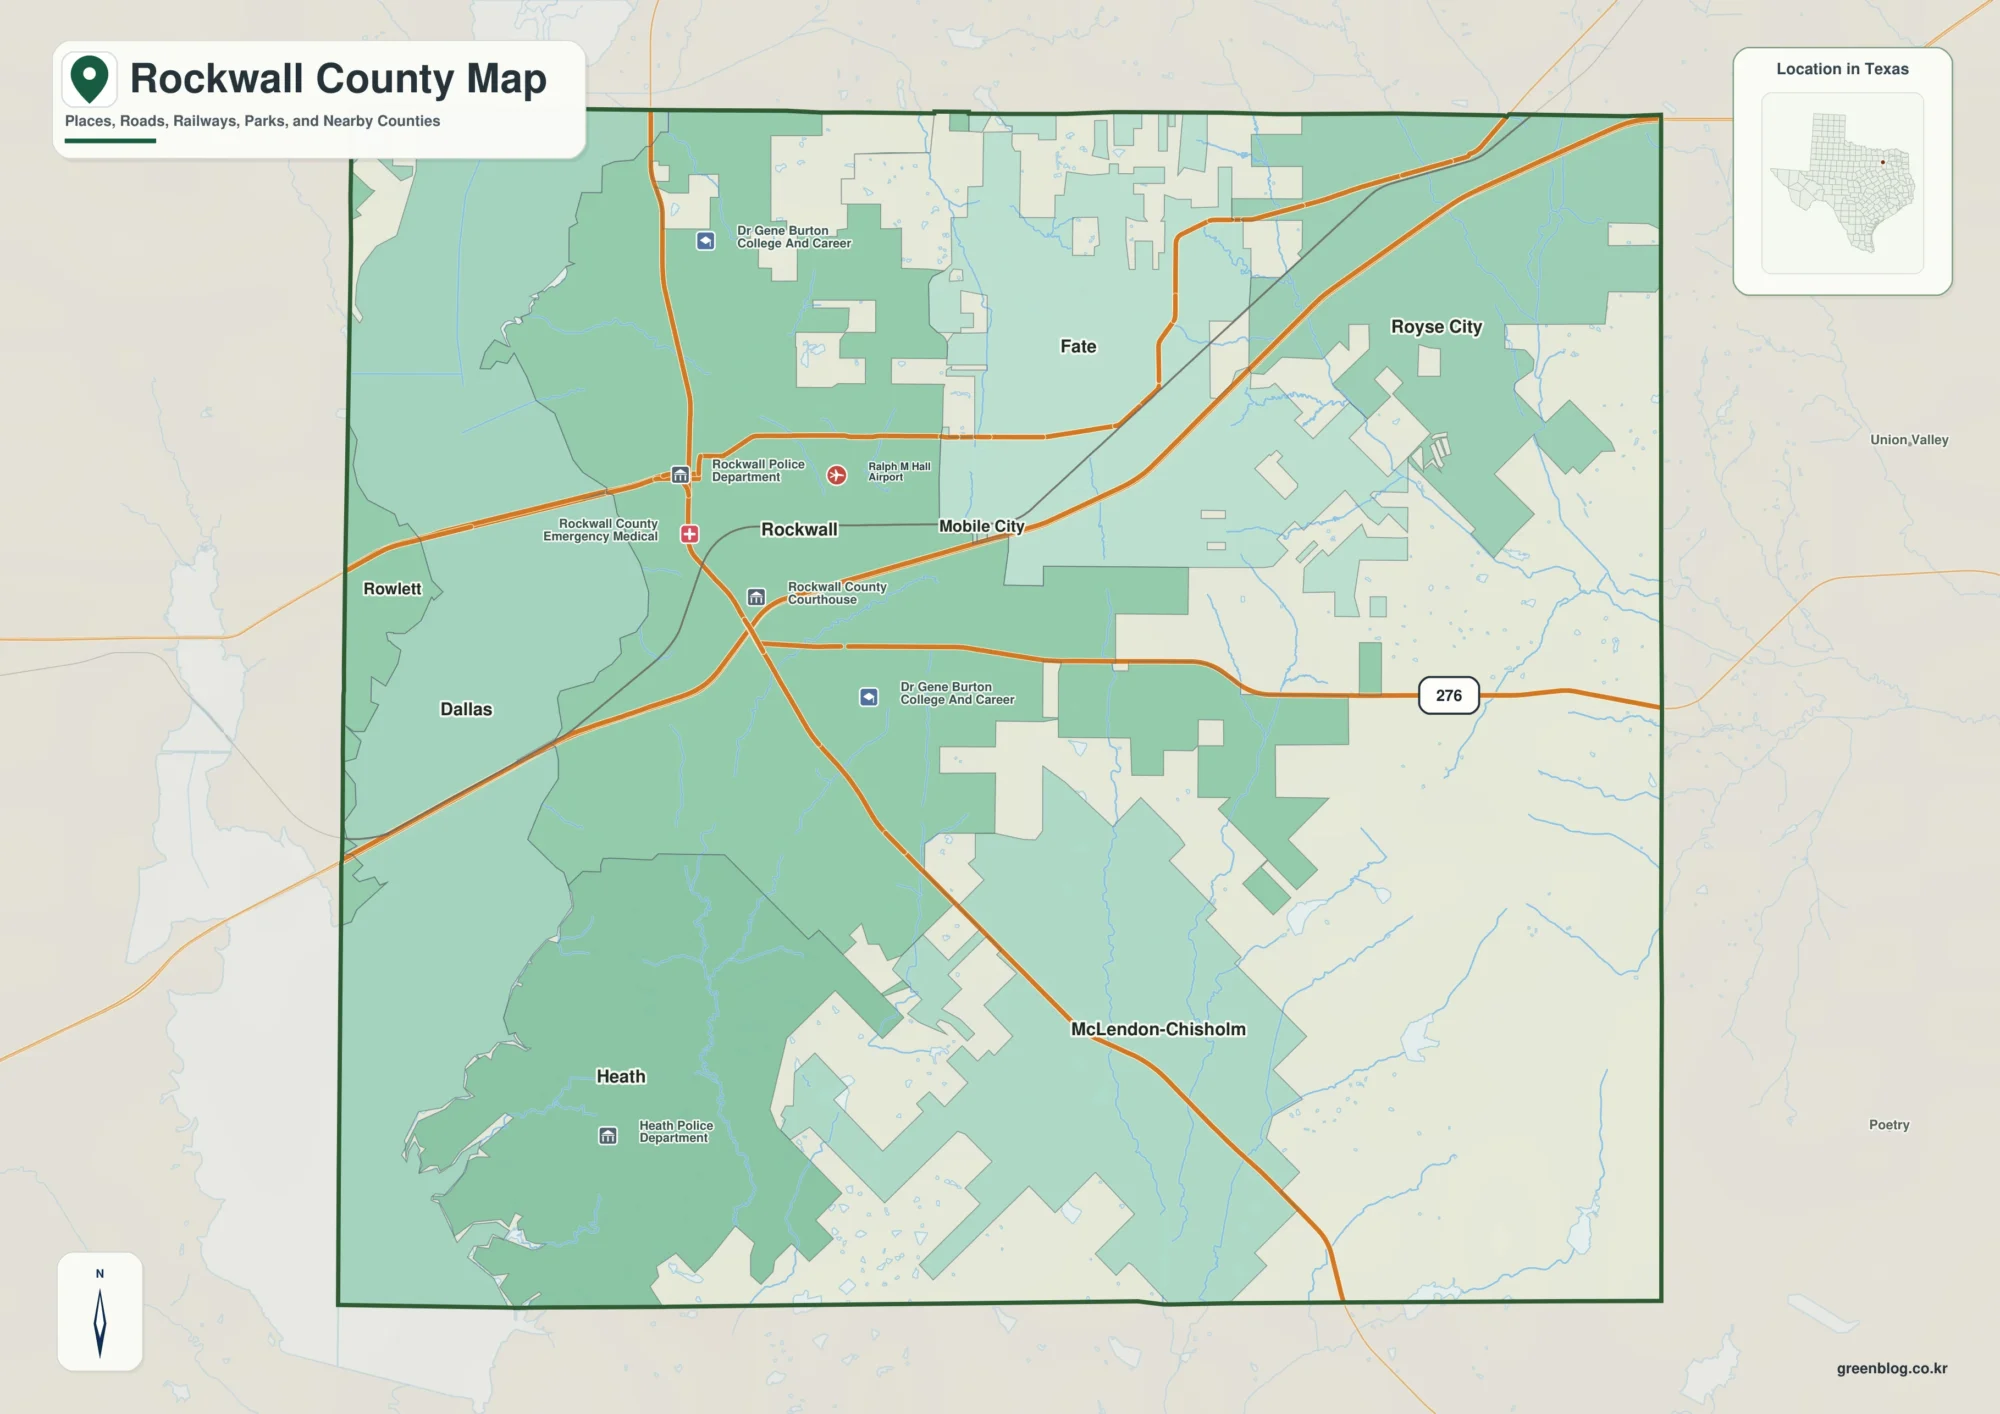
Jim Wells County is easiest to understand when Alice is used as the starting point and the long north-south shape of the county is kept in view. The map set on this page includes a general county map, a ranked city index, a terrain-and-water map, and an elevation map. Together they show where Alice, Premont, Orange Grove, and the San Diego side of the county sit in relation to U.S. 281, State Highways 44, 359, and 141, named creeks and lakes, and the county’s gradual change in elevation. After reviewing the maps on the page, you can download the same four subjects as high-resolution JPG files in one ZIP archive.
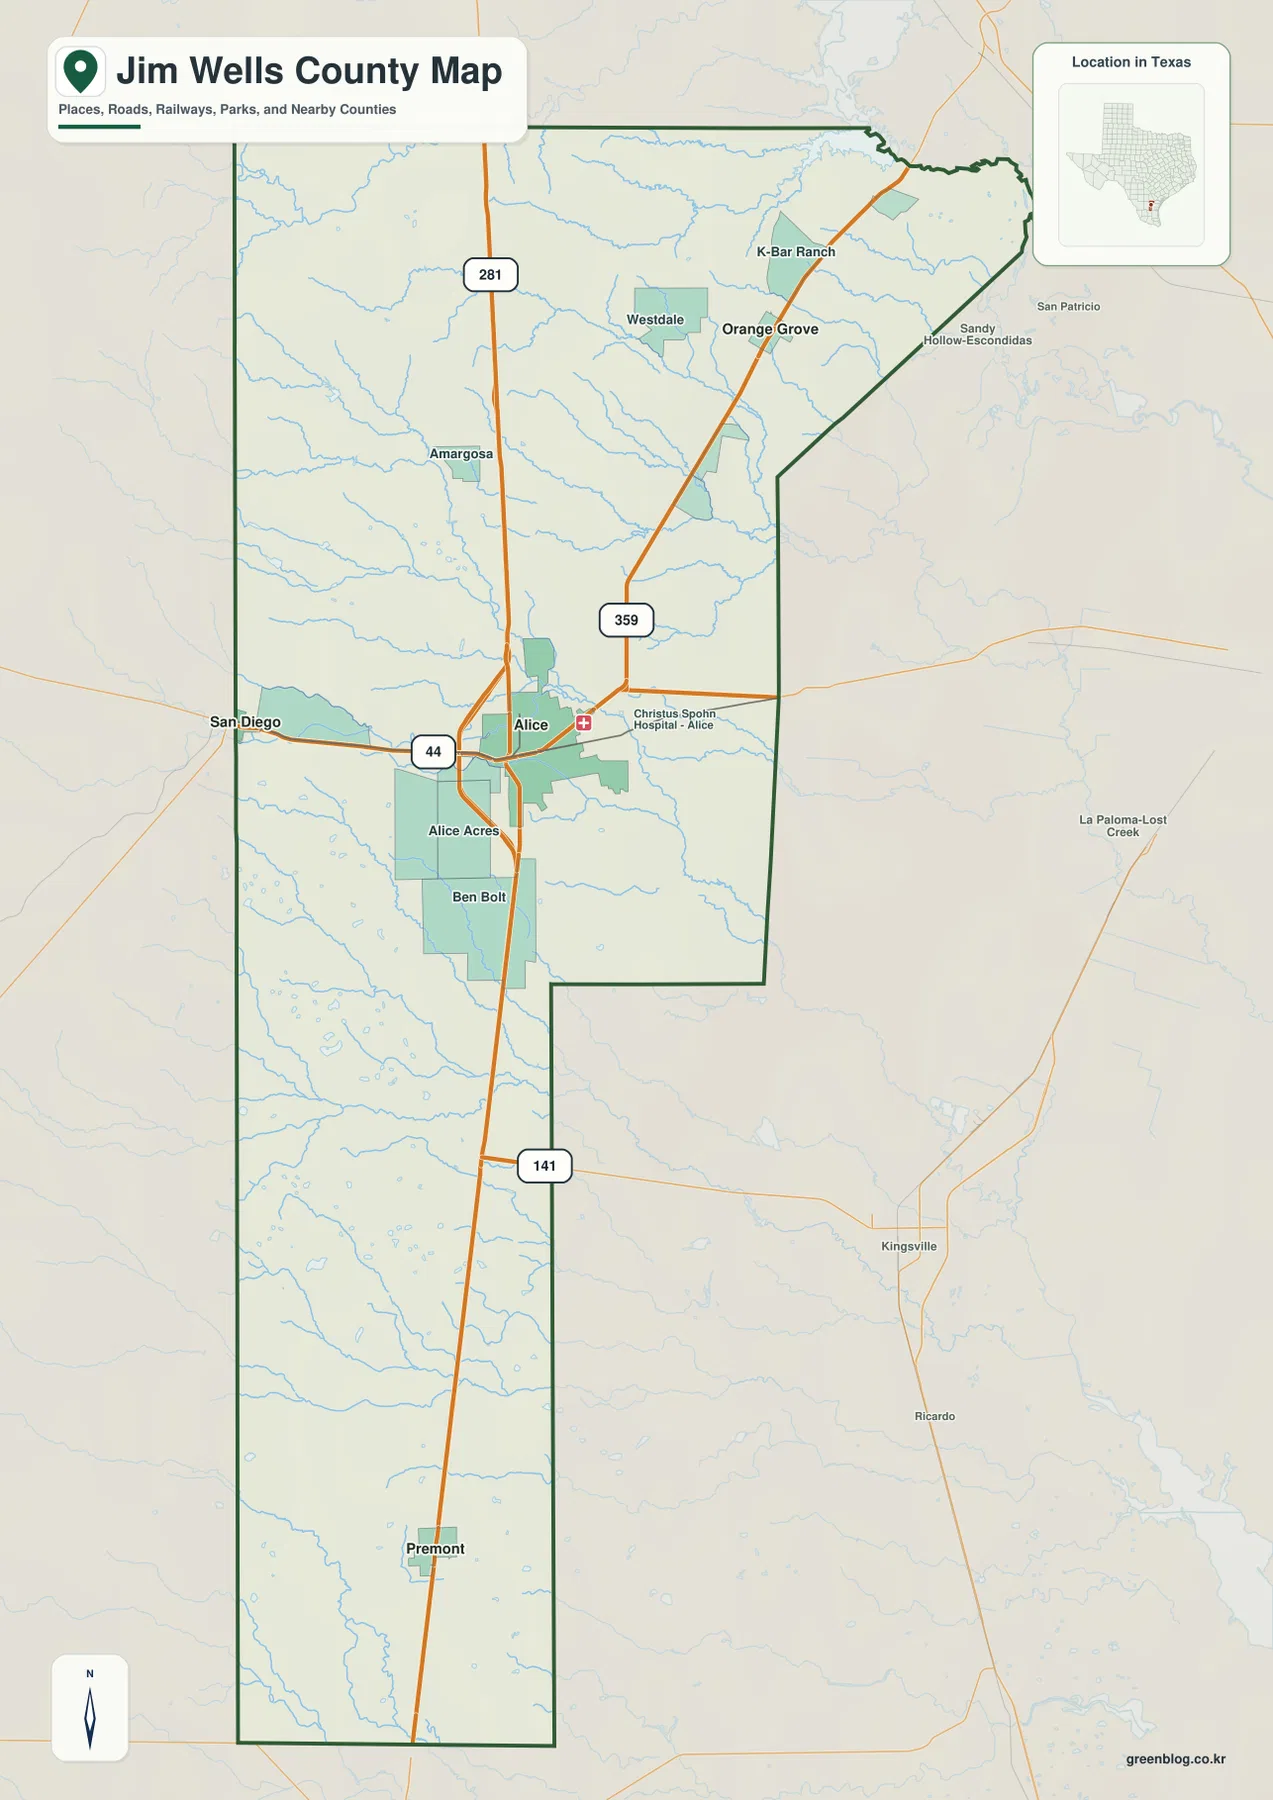
The county does not read like a compact urban area. Alice forms the clearest center, while other labeled communities are separated by longer stretches of open land. U.S. 281 runs nearly the full length of the county and gives the map a strong north-south reference line. State Highway 44 crosses Alice from west to east, and Highway 359 heads northeast toward Orange Grove. The elevation map adds another layer that is easy to miss on a road map: the northwest is noticeably higher, while the eastern and southeastern parts of the county are lower. That combination of a concentrated central city, long road corridors, many small drainage lines, and a broad elevation change gives Jim Wells County a distinctive map pattern.
Table of Contents
Alice is the clearest reference point for the county’s road network
On the general county map, Alice stands out near the middle of Jim Wells County. Its developed area is shown more broadly than the other labeled communities, and the map also marks Christus Spohn Hospital – Alice, which makes the city easy to identify even before following the highway shields. From Alice, U.S. 281 continues north through the county and south past Alice Acres and Ben Bolt toward Premont. State Highway 44 crosses the same central area in an east-west direction, while Highway 359 leaves Alice toward the northeast. Highway 141 is shown east of the city and gives another useful reference for the central and southeastern side of the county.
The northern half of the map contains several labels that are closer together than the communities farther south. Westdale, Orange Grove, K-Bar Ranch, and Sandy Hollow-Escondidas appear in the broader northern area, while Premont is separated from Alice by a much longer stretch along U.S. 281. This makes the county’s scale easier to appreciate. A viewer who looks only at the cluster around Alice could underestimate how far the county continues south. Following U.S. 281 from the northern boundary through Alice and all the way to Premont provides a simple way to keep the entire county in view.
The city index shows how strongly Alice stands apart
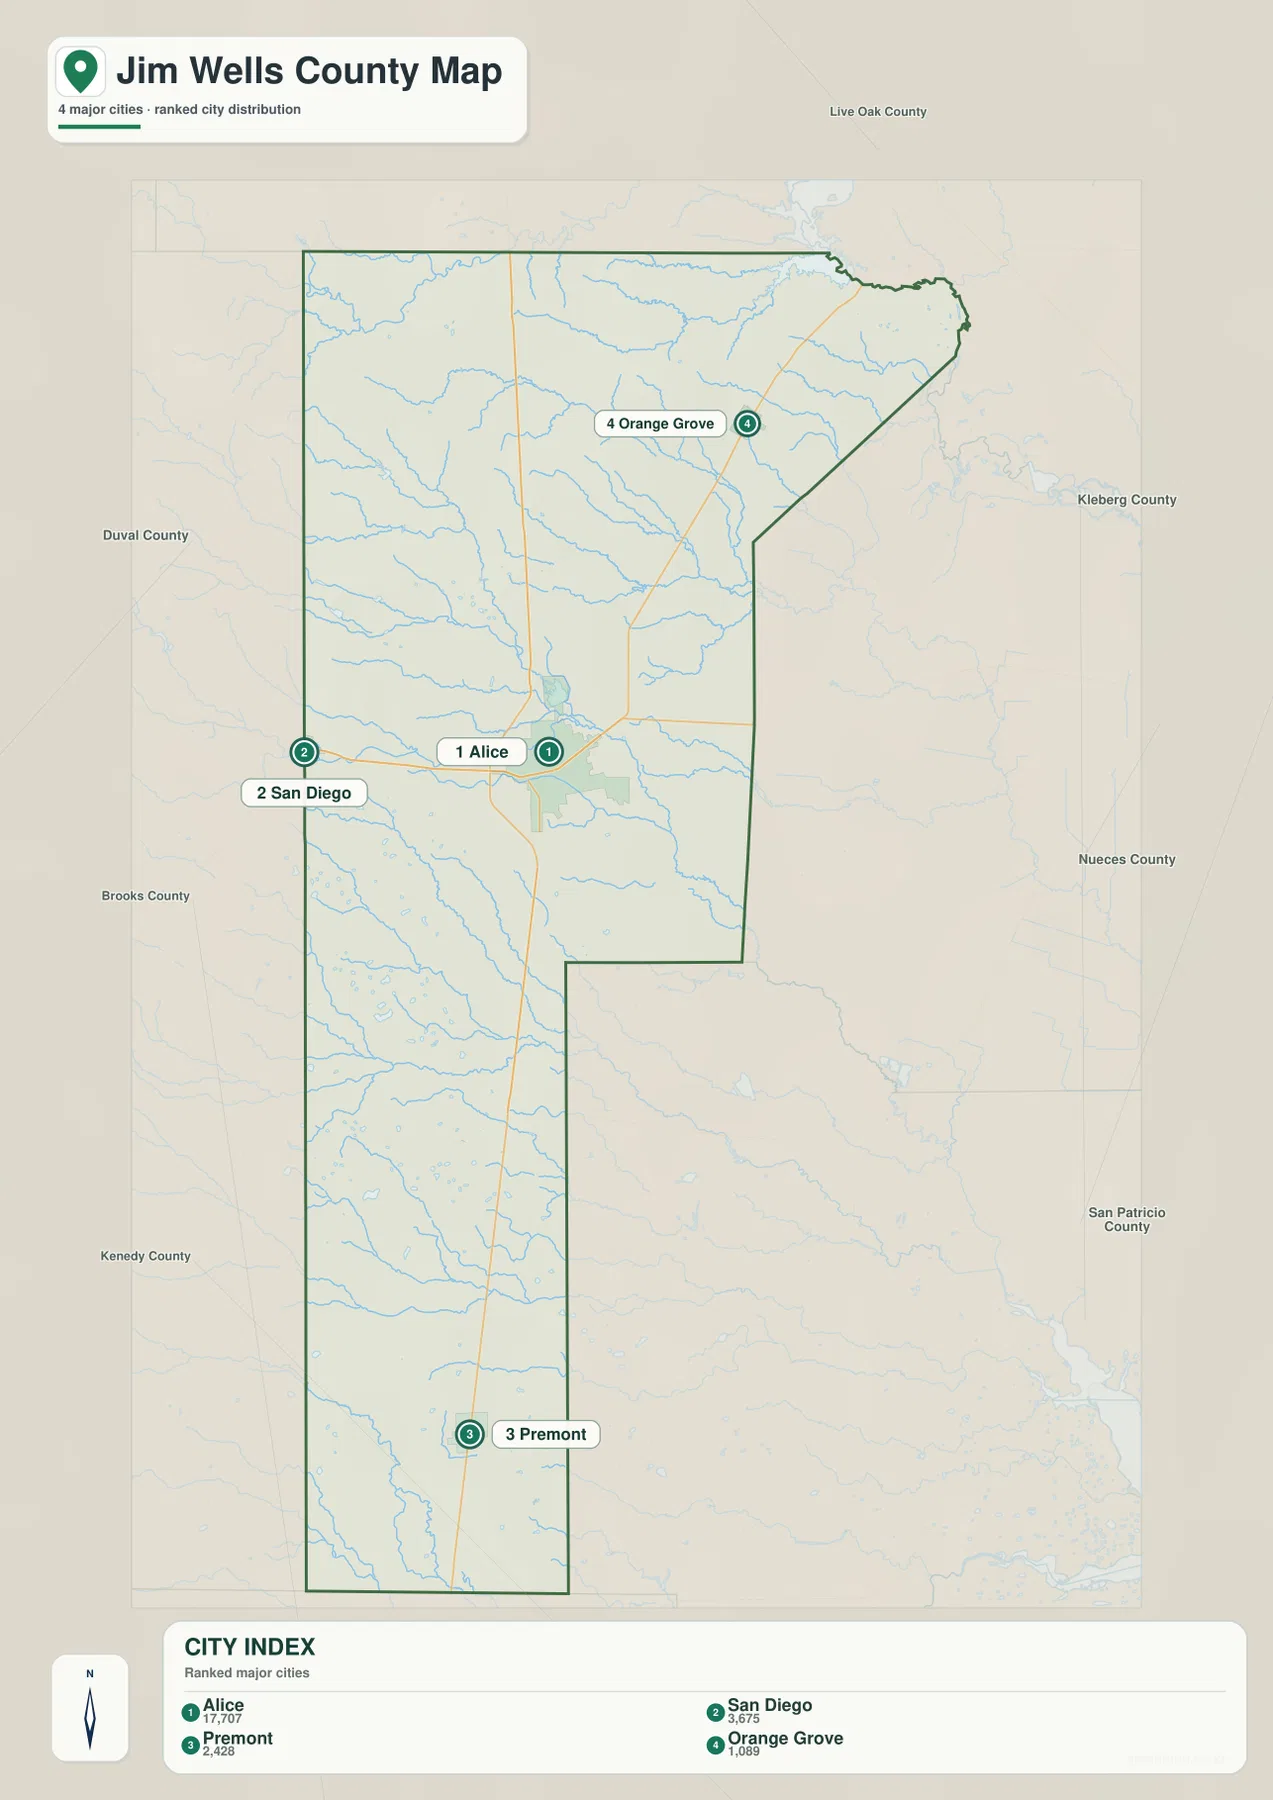
The city-index map strips away much of the detail and makes the relative position and mapped population values of four places easy to compare. Alice is ranked first at 17,707, followed by San Diego at 3,675, Premont at 2,428, and Orange Grove at 1,089. These are the values printed directly in the supplied city index, so they are best used as a comparison within this map rather than as a substitute for a current population estimate. The visual difference is immediate: Alice is far larger in the index than the other three labeled places and occupies the most prominent central position.
The spacing of the markers matters as much as the numbers. Orange Grove sits to the northeast, Premont is far to the south, and San Diego appears at the western edge as an important directional reference. The map also labels the surrounding counties, including Live Oak County to the north, Duval County to the west, Brooks County and Kenedy County farther south and southwest, and Kleberg, Nueces, and San Patricio counties on the eastern side. Looking at those names together with the city markers helps place Jim Wells County within the larger South Texas county network without turning the page into a list of neighboring jurisdictions.
Named creeks trace the county from Lagarto Creek to Los Olmos Creek
The terrain-and-water map reveals details that are easy to overlook on the general road map. In the north, Lagarto Creek and Pintas Creek are labeled near the upper part of the county, while Agua Dulce Creek follows a longer course across the northern interior. Lake Alice appears around the central part of the county, and San Diego Creek approaches from the west. These named features give readers specific points to match against the city and road maps instead of treating every blue line as an unnamed drainage feature.
The southern half contains a different set of water features. San Andreas Creek and Trinidad Creek extend through the western side of the long southern section, Olma Lake is labeled farther south, and Los Olmos Creek appears close to the lower end of the county. The contrast between many smaller northern channels and the long labeled creeks in the south is easier to see on this specialized map than on the general map. The water layer should still be used for location rather than for assumptions about present flow. A creek shown here may not carry the same amount of water throughout the year, and this map by itself does not establish flood risk, crossing safety, or current water conditions.
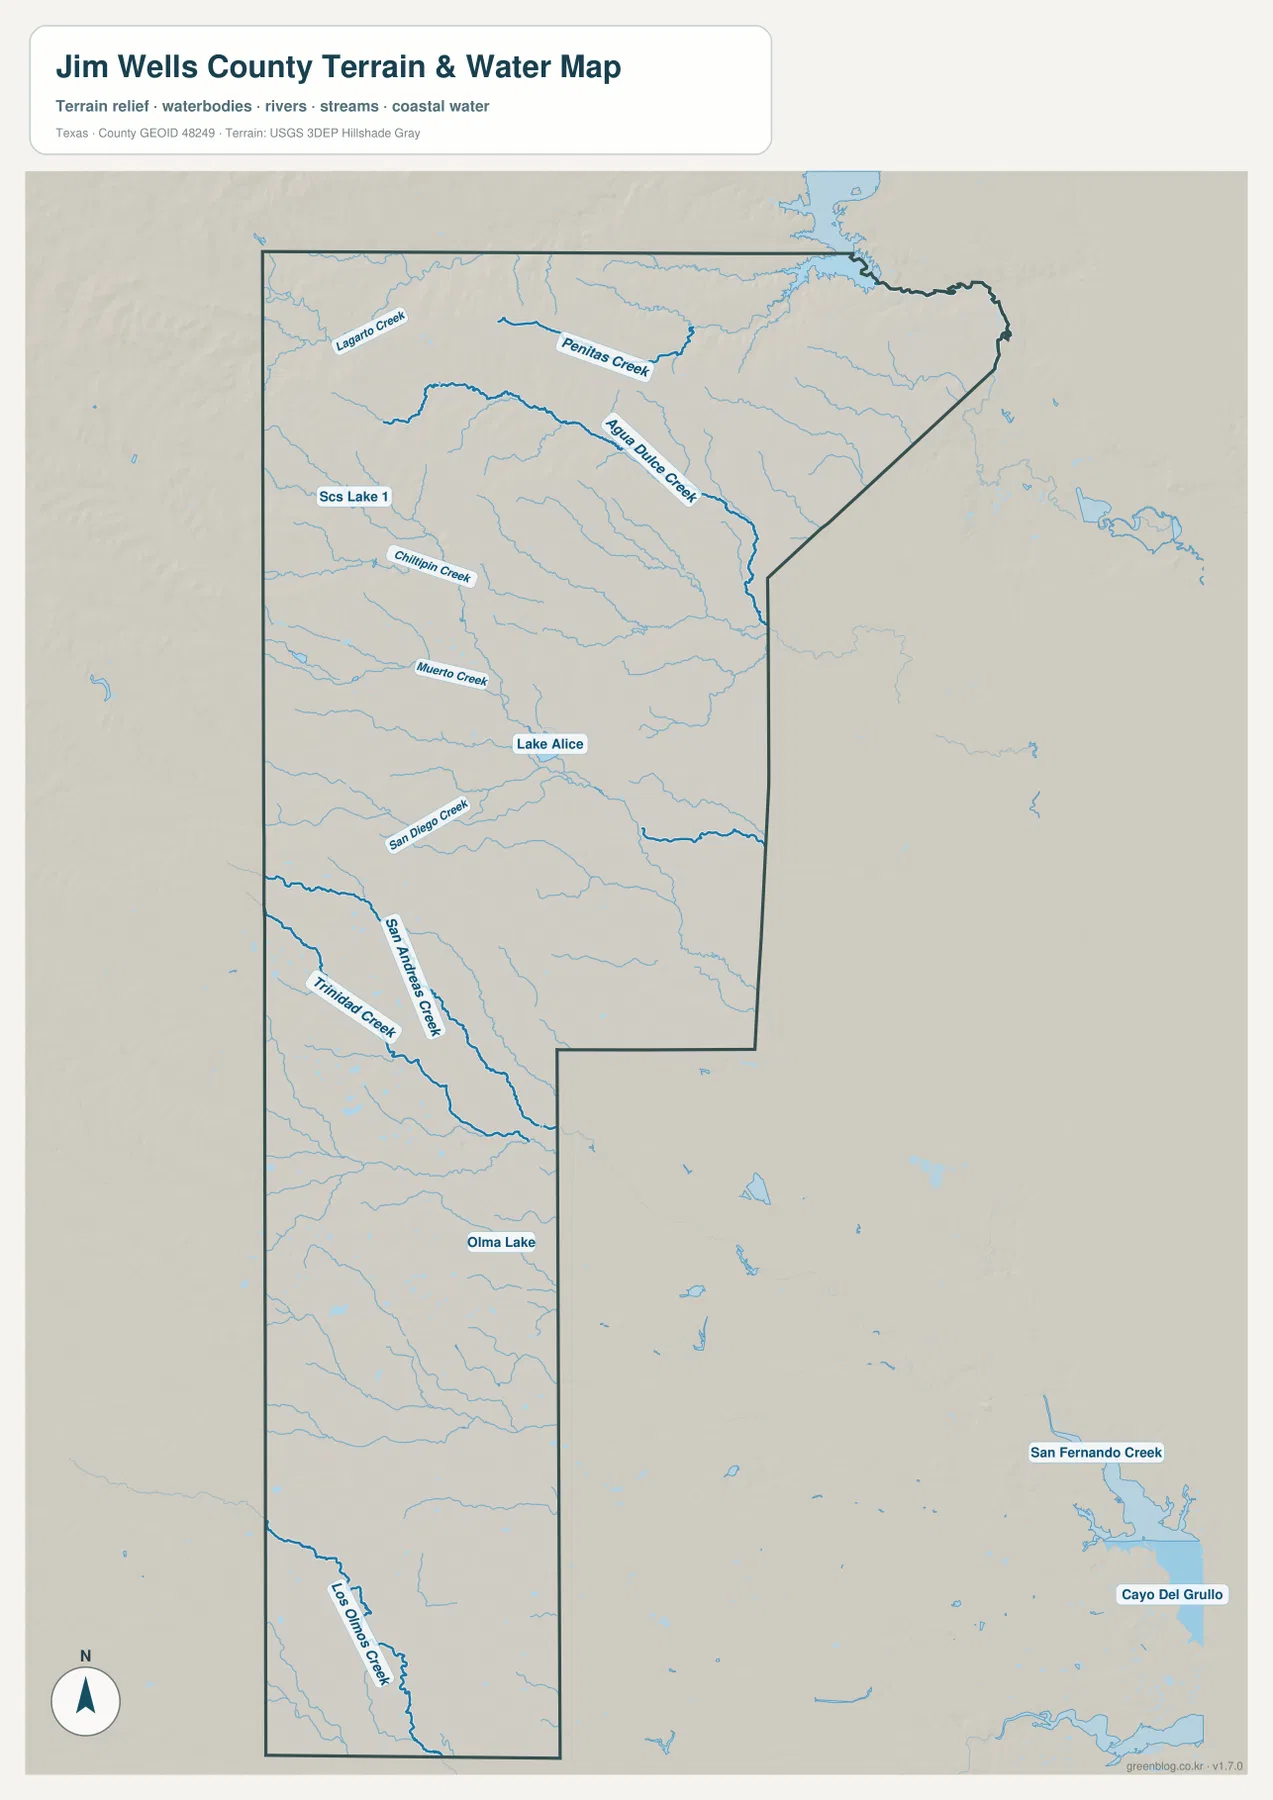
Elevation falls from the northwest toward the east
The elevation map shows an actual mapped range of about 9 to 138 meters, with a mean of about 64 meters. The highest colors are concentrated in the northwest, where brown and tan tones cover a broad area and the shaded relief shows more visible texture. Moving eastward, those colors shift through yellow and light green into darker green. The northeast and much of the eastern side are lower than the northwest, and the long southern section also stays mostly within the lower green and light-green bands.
This is not a landscape dominated by one isolated mountain or a single steep ridge. The more important feature is the broad, gradual difference across the county. The northwest contains the highest ground on the supplied map, while the central area around Alice sits between that higher western side and the lower eastern side. That makes the elevation layer useful even for readers who are not studying topography in detail. When it is placed beside the road and water maps, the color change provides a quick check of whether a named road, creek, or community lies in the relatively higher northwest, the middle elevations, or the lower eastern and southern parts of the county.
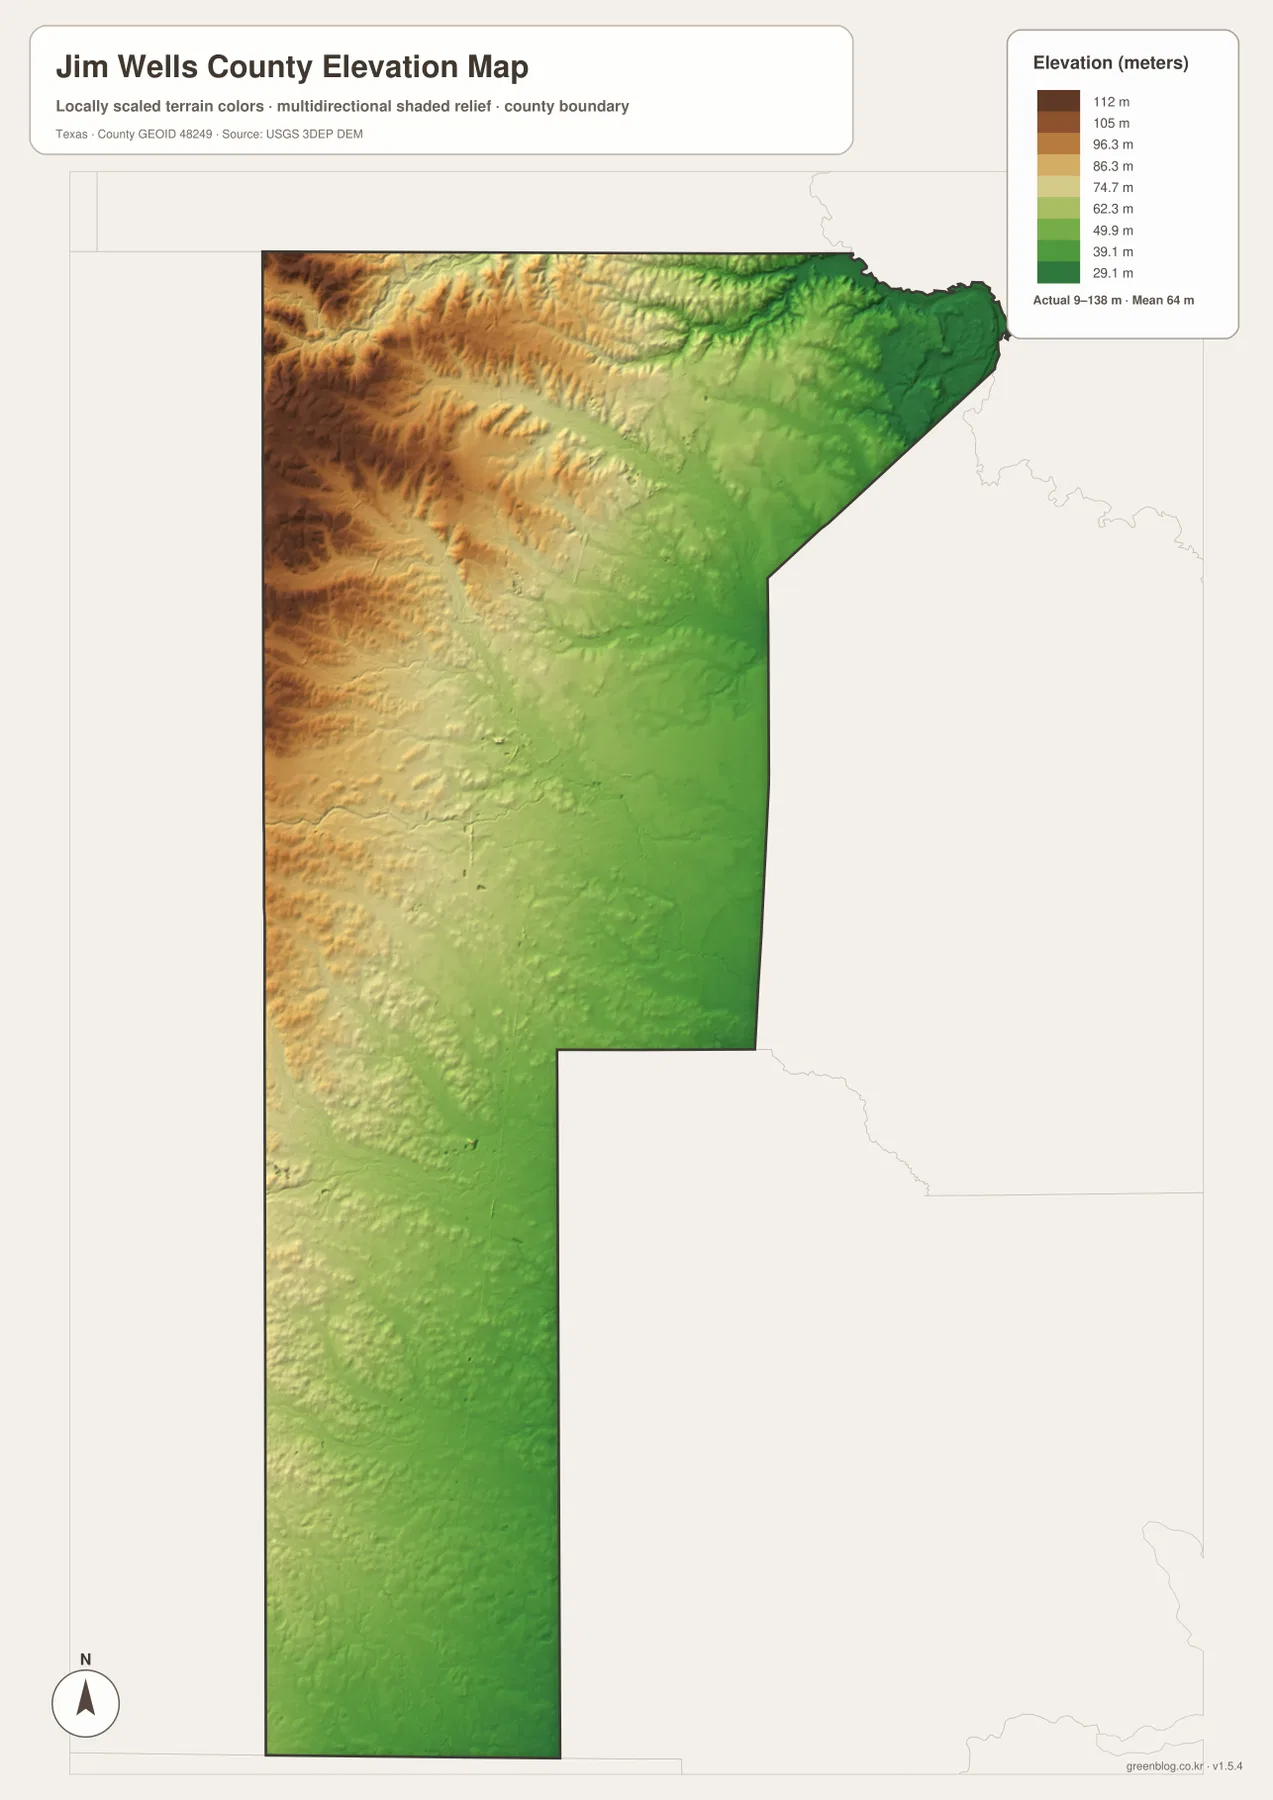
Comparing the four maps explains more than any single layer
Alice provides a good example of why the maps work better together. On the city index it is by far the largest labeled place. On the general map it sits where several important roads meet or pass nearby, including U.S. 281, Highway 44, and Highway 359. On the water map, Lake Alice and San Diego Creek give nearby physical reference points. The elevation map then shows the central part of the county at an intermediate height between the higher northwest and the lower eastern area. None of those facts requires a complicated GIS interpretation; they simply become easier to see when the maps are compared side by side.
The same approach works in the north and south. Orange Grove is tied visually to Highway 359 on the general map, while Pintas Creek and Agua Dulce Creek provide nearby labels on the water map. The elevation colors in the northeast are lower than the browns and tans of the northwest, so treating the entire northern part of the county as one uniform area would hide a real difference shown by the supplied terrain data. Farther south, Premont remains close to U.S. 281, but the city labels become sparse while San Andreas Creek, Trinidad Creek, Olma Lake, and Los Olmos Creek continue to provide geographic detail. This makes the southern section feel less empty once the water layer is added.
The county’s long shape makes neighboring counties useful reference points
Jim Wells County has an irregular outline rather than a simple rectangle. The northern part is relatively broad, the eastern boundary steps inward around the middle, and a narrower southern section continues well below Alice. Because of that shape, it is easy to focus on Alice and the northern communities and miss how much land lies farther south. Tracing the boundary from the Orange Grove area down through Alice and then to Premont is a practical way to understand the county’s full north-south extent.
The neighboring county labels in the city-index map help orient each side of that outline. Duval County is shown to the west, Live Oak County to the north, and Kleberg and Nueces counties to the east. Brooks, Kenedy, and San Patricio counties appear around the broader southern and eastern surroundings. These labels are especially useful when following highways beyond the Jim Wells County line. They show that the roads do not end at the boundary and make it easier to describe a travel direction without inventing details that are not present on the map.
Choose the map that matches the question you are trying to answer
Use the general county map when you need boundaries, roads, nearby places, and the overall position of Alice, Premont, and Orange Grove in one view. The city index is better when the goal is to compare the four mapped city markers and their printed values without the extra road detail. The terrain-and-water map is the clearest choice for named creeks and lakes, while the elevation map is useful for showing the higher northwest and the lower eastern side. Keeping those purposes separate makes each map easier to read, especially in a classroom handout or a printed reference sheet.
The download archive contains the high-resolution JPG versions of all four maps shown on this page: the county map, city map, water map, and elevation map. The larger files are more practical than a browser screenshot when labels need to remain legible or when the maps are being prepared for A3 printing. You can download the full ZIP below and then use only the map or maps needed for your project.
Frequently Asked Questions
What is the easiest place to find first on a Jim Wells County map?
Alice is the best starting point. It is prominently shown near the center of the county, and U.S. 281, State Highway 44, and Highway 359 are all close enough to make the city a useful reference for locating Orange Grove to the north and Premont to the south.
Which part of Jim Wells County is highest on the supplied elevation map?
The northwest is the highest part shown on the map. The displayed elevation range is about 9 to 138 meters with a mean near 64 meters, and the colors generally become lower toward the east and southeast.
Which named water features are easy to locate on the water map?
Clear labels include Lagarto Creek, Pintas Creek, Agua Dulce Creek, Lake Alice, San Diego Creek, San Andreas Creek, Trinidad Creek, Olma Lake, and Los Olmos Creek. They are spread from the northern part of the county to the southern end.
Sources and Reference Data
For official source layers and additional checking, see the U.S. Census Bureau TIGER/Line Shapefiles for boundary and road data, USGS National Hydrography for water features, and the USGS 3D Elevation Program for elevation data.
Map File Information
The archive includes high-resolution JPG files for the Jim Wells County map, city map, terrain-and-water map, and elevation map.
- File Type: JPG
Related Maps
- San Patricio County Texas map
- Starr County
- Webb County Texas map
- Atascosa County Texas map
- Willacy County Texas map
Green Map creates custom-edited map images using open geographic data sources such as geoBoundaries, Natural Earth, OpenStreetMap, and government open data.
These maps are edited visual materials, not raw data files, and are provided for education, documents, presentations, and graphic reference.