This San Patricio County Map set shows how Sinton, Portland, Ingleside, Aransas Pass, Mathis, and Taft fit between the inland road network and the bays along the Texas coast. The article also follows the Nueces River, named creeks and swales, and the change in elevation from higher ground in the northwest toward low coastal terrain in the south and east. High-resolution A3 JPG versions of the county, city, water, and elevation maps are available together in the download box below.
San Patricio County is easier to understand when the inland and bay-side areas are compared rather than treated as one uniform landscape. Mathis occupies the far west, Sinton is near the center, and Portland, Ingleside, and Aransas Pass form a separate group closer to the water. Nueces Bay and Corpus Christi Bay shape the southern side, while a network of smaller creeks crosses the interior. The elevation map adds another useful layer by showing a broad decline from the northwest toward the coastal lowlands.
Table of Contents
Sinton is the clearest road reference for the middle of the county
On the general county map, Sinton sits near the middle and provides the easiest starting point for reading the road system. Route 77 approaches from the northwest and continues through the Sinton area. Route 181 heads southeast past Taft toward Gregory and Portland. Route 188 crosses the central part of the county, while 234 and 359 help identify the western side around Odem and Mathis. Near the eastern coastal communities, route numbers 35 and 361 appear around Aransas Pass and Ingleside.
The settlement pattern becomes clear once those roads are connected with the place labels. Mathis is near the western edge, with Lake City and Lakeside nearby. Odem lies southwest of Sinton, while Taft is southeast of it. Gregory and Portland are closer to the bay, and Ingleside and Aransas Pass occupy the far eastern side. Corpus Christi is also labeled near the southeastern area as a regional reference, making it easier to see how the county faces the larger bay system.
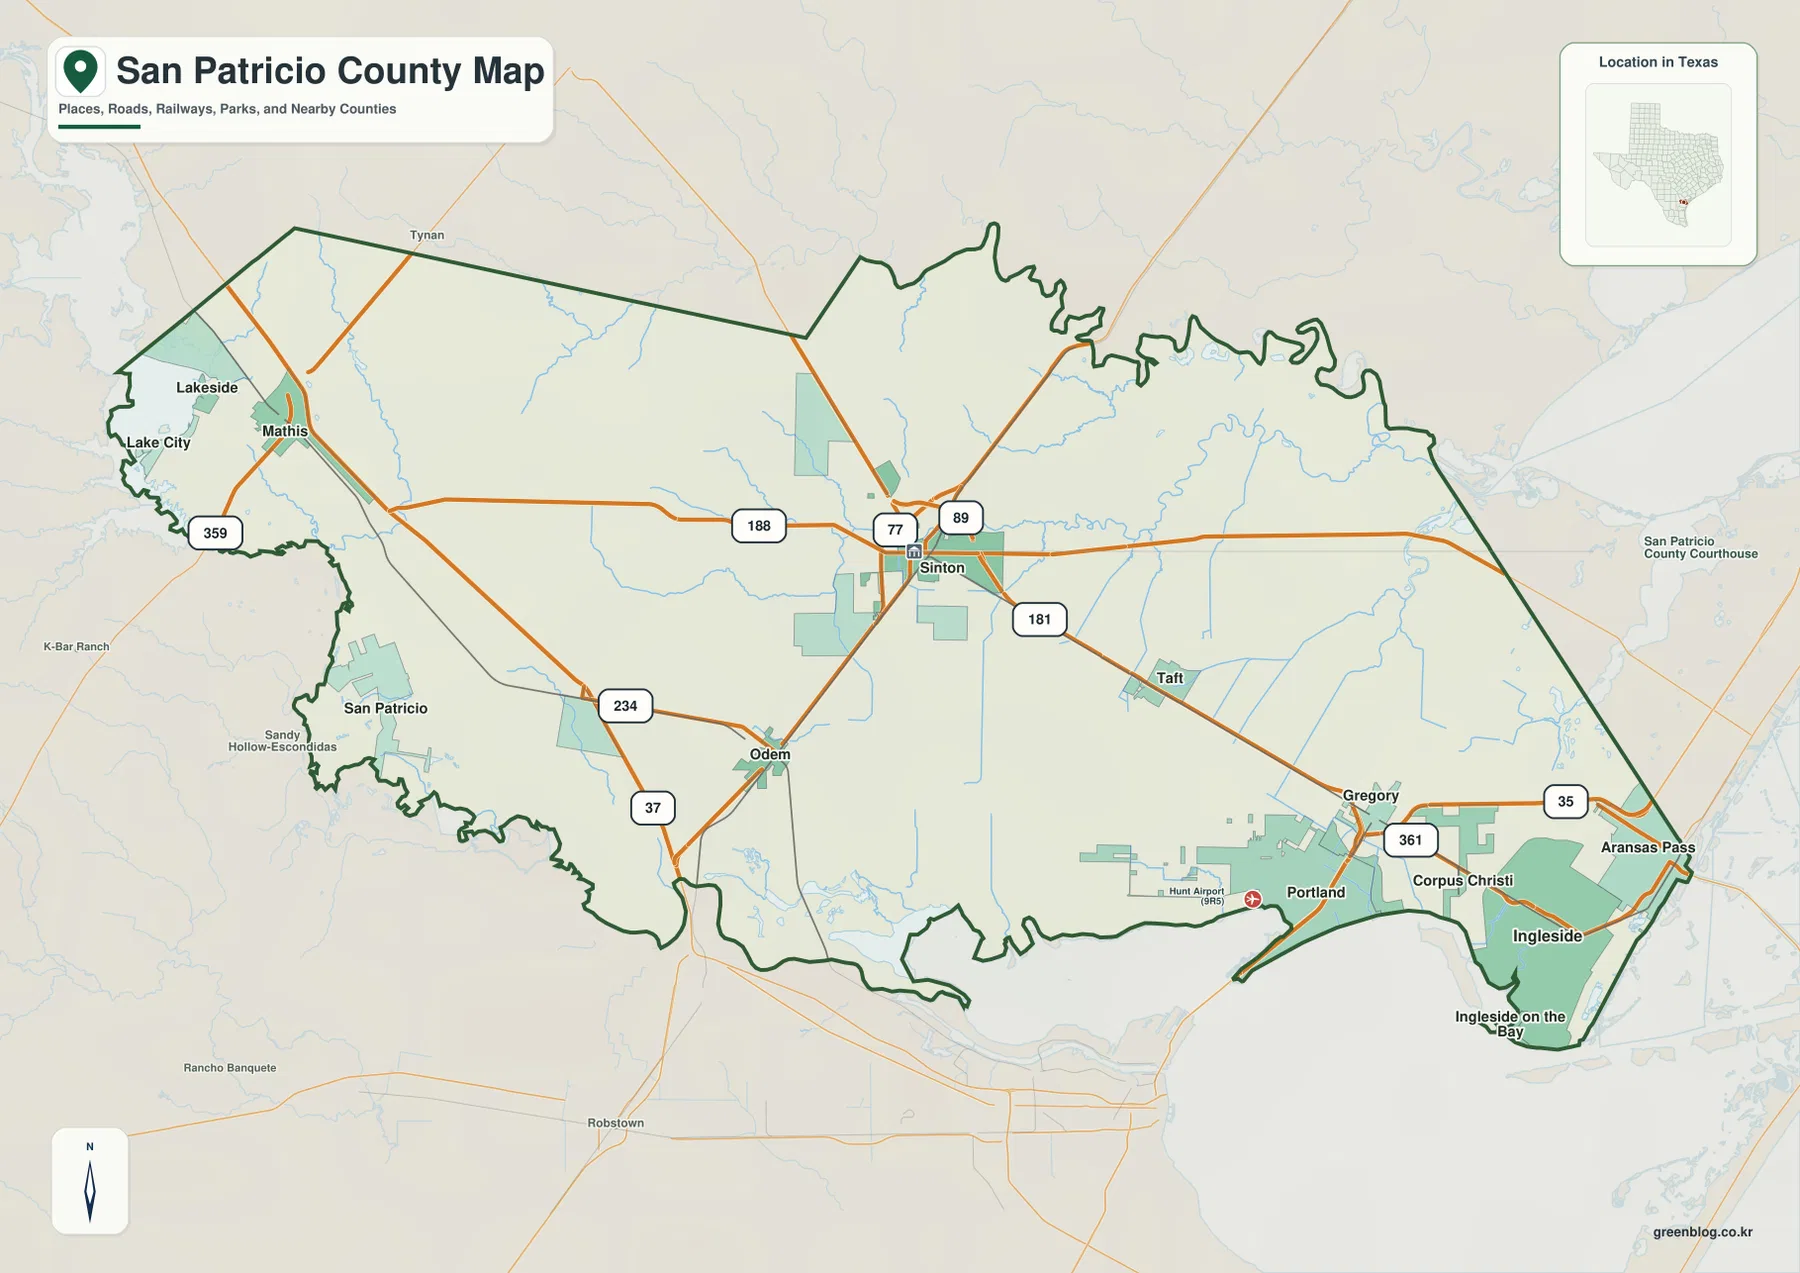
The boundary is noticeably different on the inland and coastal sides. Long, simpler segments dominate much of the west and north, but the east and south become increasingly irregular where the county meets bays and narrow coastal inlets. The shoreline around Aransas Pass and Ingleside on the Bay is especially complex. That contrast is useful on a printed map because it makes the county’s outline more distinctive than a simple road-only view would suggest.
Six ranked cities reveal a strong southeast-to-west contrast
The city map highlights six major places and gives each a rank. Portland is number 1, Ingleside number 2, and Aransas Pass number 3, placing the three highest-ranked mapped cities in the southeast and east. Sinton is number 4 near the center, Mathis number 5 in the west, and Taft number 6 southeast of Sinton. The distribution makes it easy to compare the bay-side cluster with the more widely separated inland towns.
The CITY INDEX printed on the map lists Portland at 20,543, Ingleside at 9,997, Aransas Pass at 8,972, Sinton at 5,584, Mathis at 4,308, and Taft at 2,871. These values explain the ranking used in the supplied graphic. They should be treated as map values rather than guaranteed current population estimates; anyone needing the newest demographic count should consult an official statistical source. For map reading, however, the index gives immediate context for the size hierarchy shown by the numbered markers.
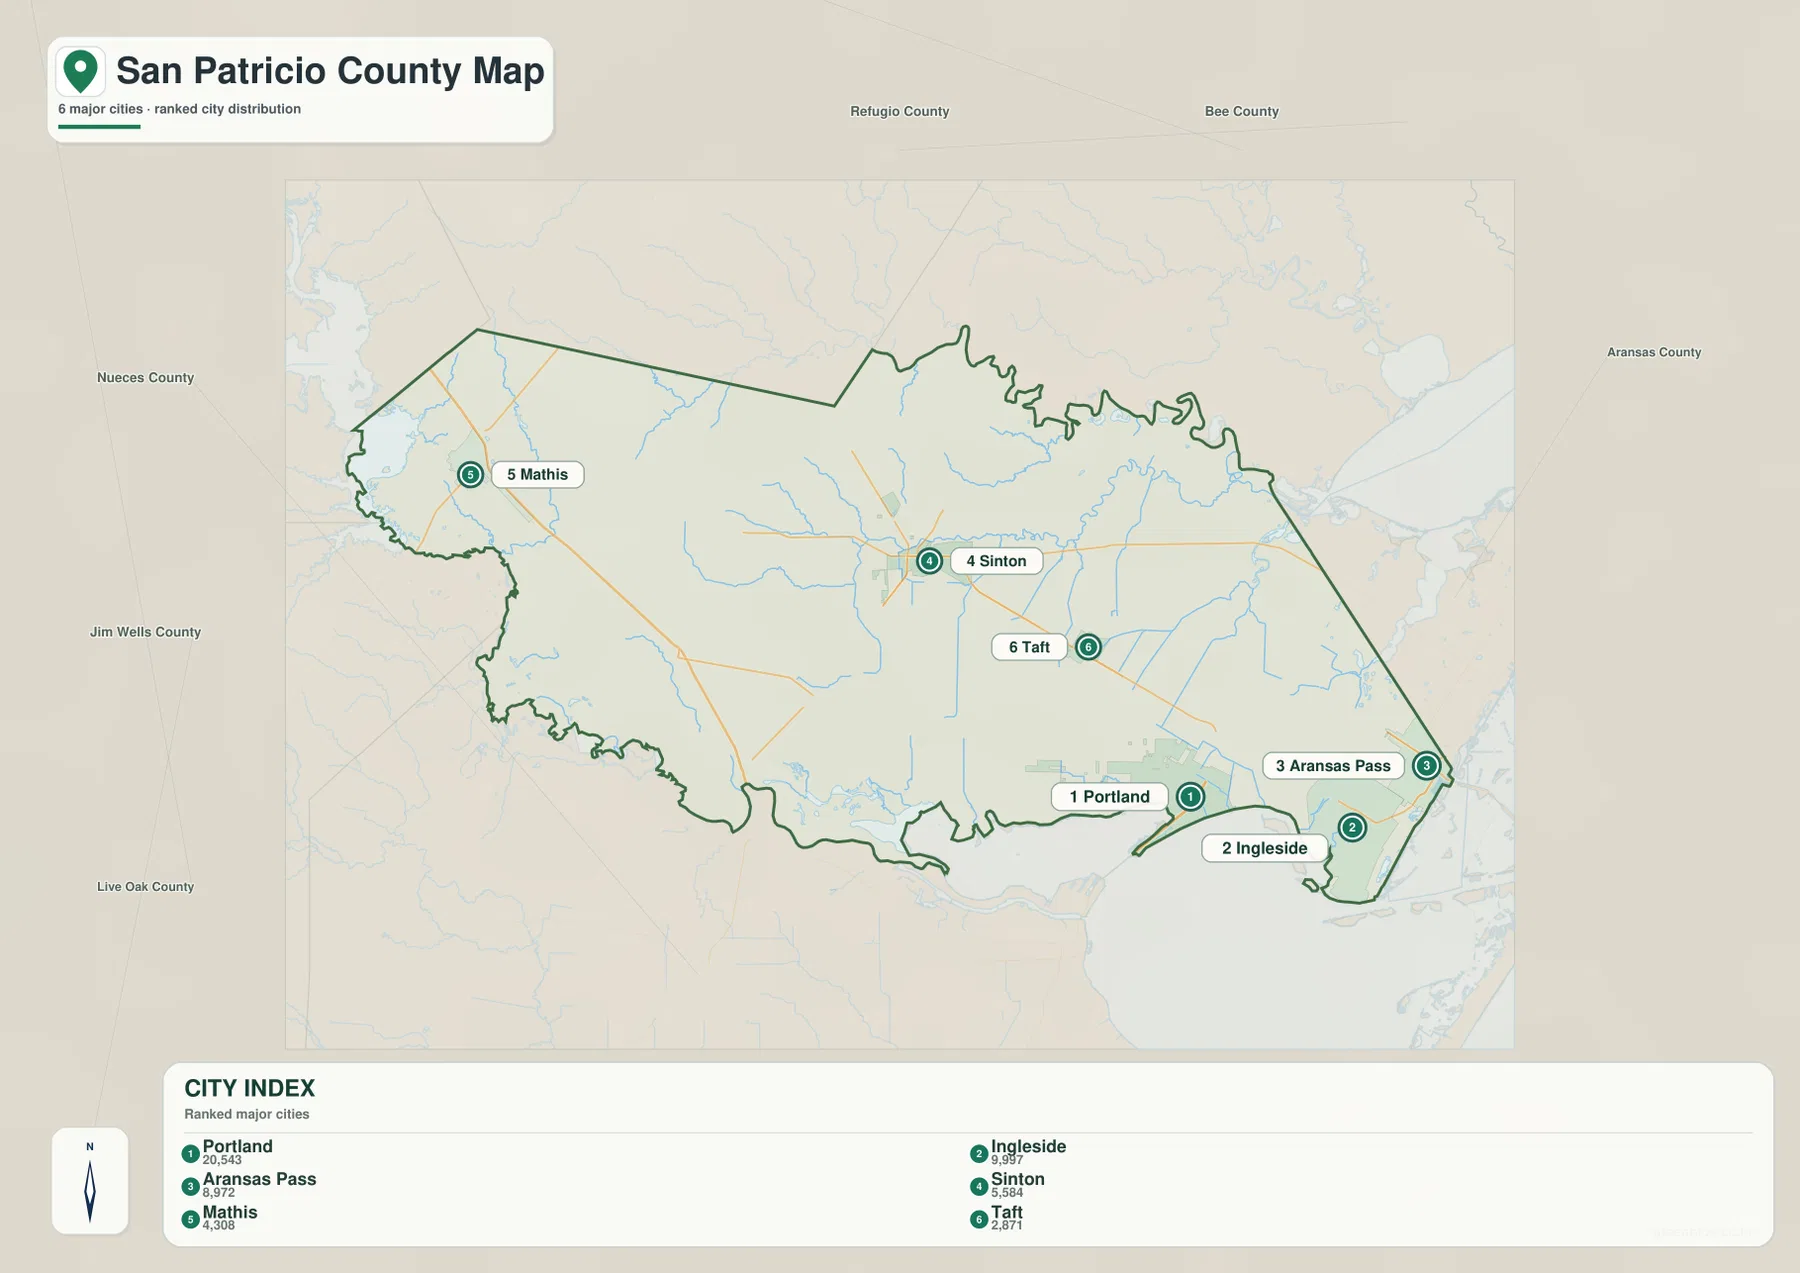
The surrounding county names add useful orientation. Refugio and Bee counties are labeled to the north, Aransas County to the east, Nueces and Jim Wells counties to the west, and Live Oak County to the southwest. Those labels show that the map is doing more than ranking cities. It also places San Patricio County within a larger regional frame and makes the long west-to-southeast spread from Mathis through Sinton to Portland and Aransas Pass easier to grasp.
The Nueces River and a chain of bays define the southern and eastern edges
The terrain-and-water map shifts attention away from highways and toward drainage. Nueces Bay and Corpus Christi Bay dominate the south. The Nueces River enters the southwest side of the mapped area and follows the lower county boundary. Farther west, Arroyo Nombre de Dios and Hondo Creek are labeled, while Peters Swale crosses the central interior. South Fork Moody Creek and Chiltipin Creek form more prominent winding channels in the north-central and eastern sections.
Several large water names appear just beyond the eastern boundary: Mission Bay, Copano Bay, Salt Lake, Port Bay, and South Bay. These adjacent features help explain the broken shoreline near Aransas Pass and Ingleside. Corpus Christi Bay opens across the southeast, and the map continues outward to the Gulf waters beyond the bays. Not every labeled water body lies inside San Patricio County, but the surrounding names are valuable reference points for understanding where the county’s coastal edge sits within the larger bay system.
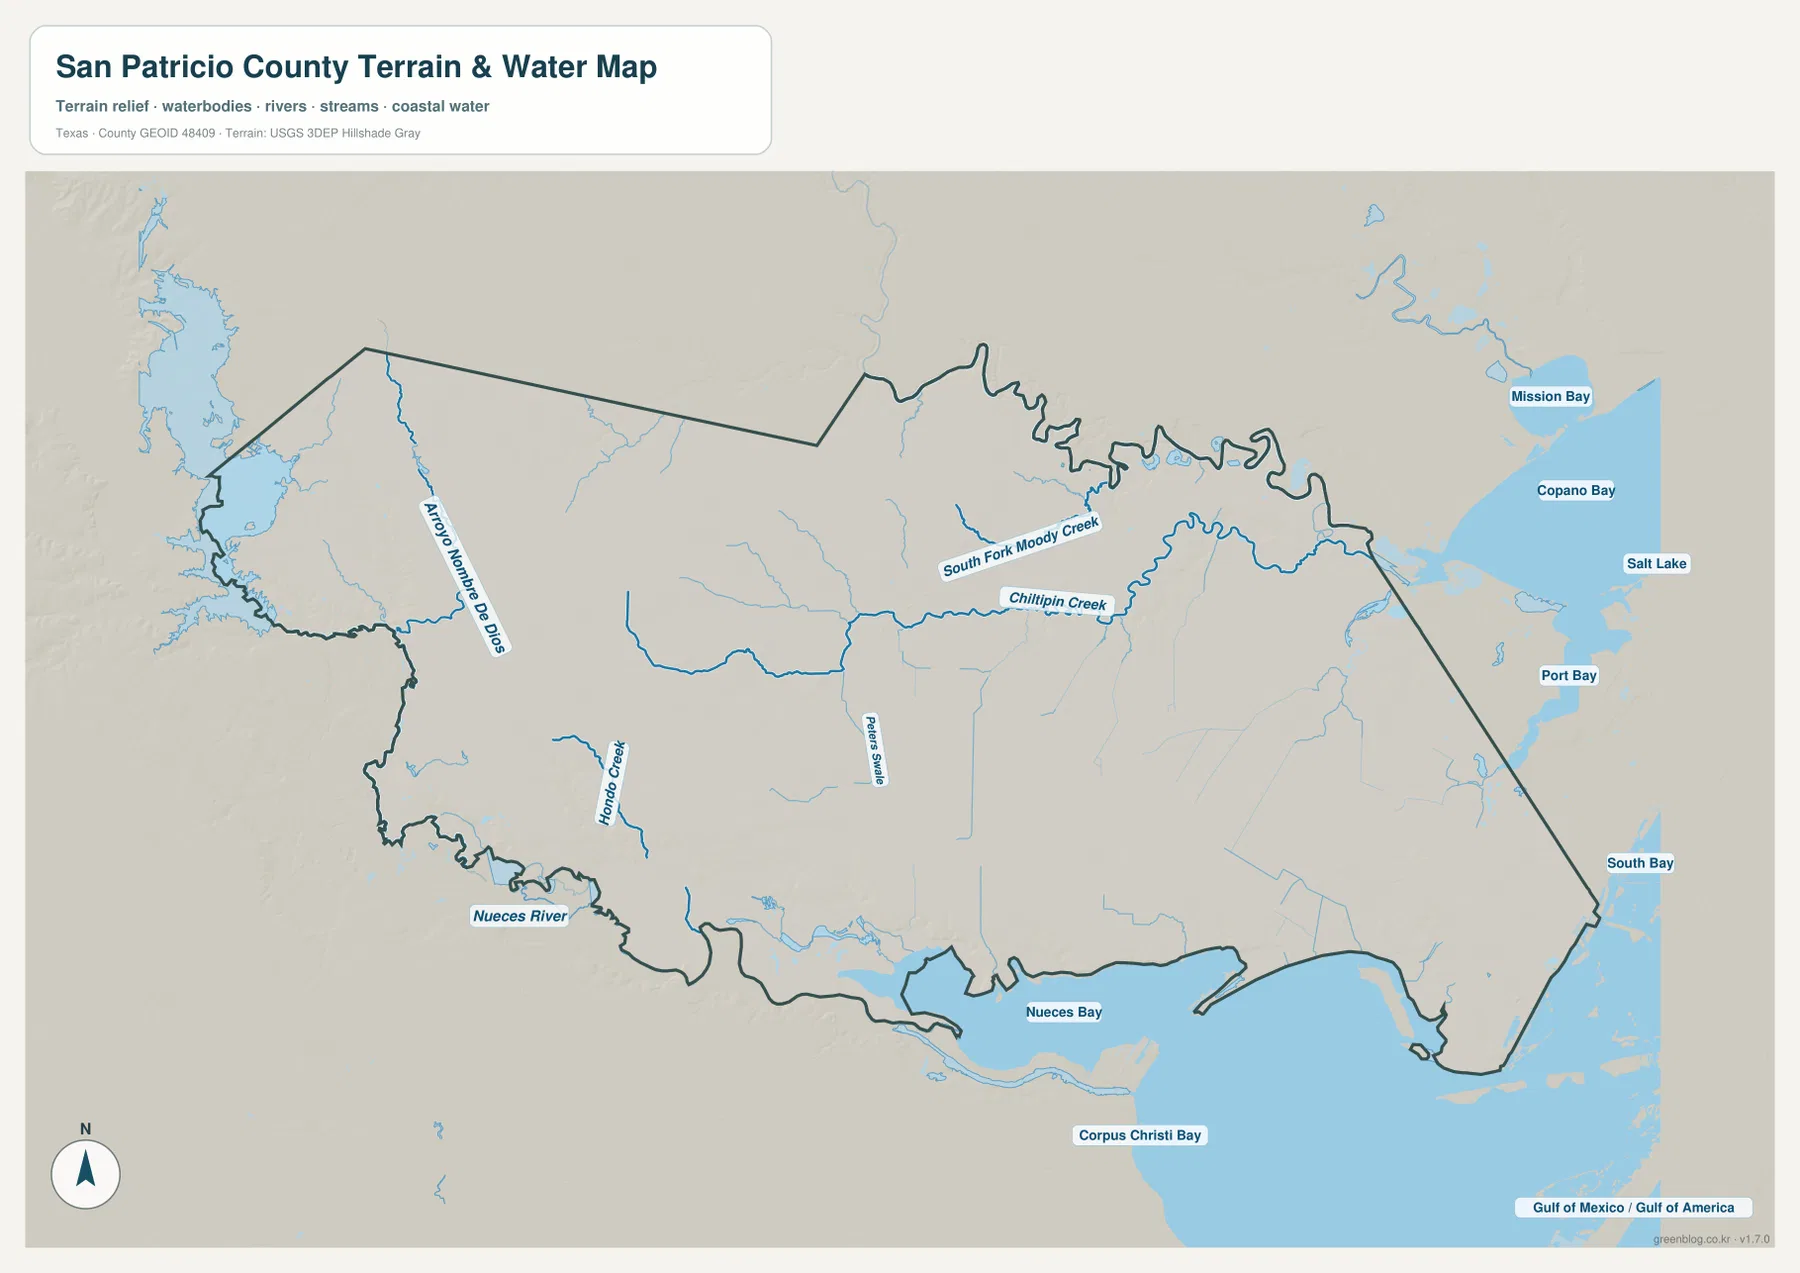
Comparing the water map with the city map makes the settlement pattern more intuitive. Mathis is well inland on the western side, Sinton occupies the center, and Portland, Ingleside, and Aransas Pass lie much closer to the bay network. The complicated eastern county outline also makes more sense once the surrounding bays and tidal-looking inlets are visible. This is a reference map of water and terrain, not a flood, navigation, parcel, or legal-boundary product.
Elevation steps down from the northwest toward the bay shore
The elevation map states an actual range of about -1 to 64 meters and a mean of 19 meters. The highest brown and tan terrain is concentrated in the northwest. Moving toward the center, the colors shift through yellow and light green, and much of the south and east becomes darker green. The low colors are especially widespread around Nueces Bay and the coastal side of the county.
This is not a landscape of one isolated high hill. The map shows a broad, gradual transition from higher inland ground to low coastal terrain, with narrow valleys cutting through the surface. In the west and center, those low corridors branch in patterns that resemble the creeks and swales shown on the water map. The result is a useful visual explanation of why the county’s waterways tend to lead toward the lower southern and eastern margins.
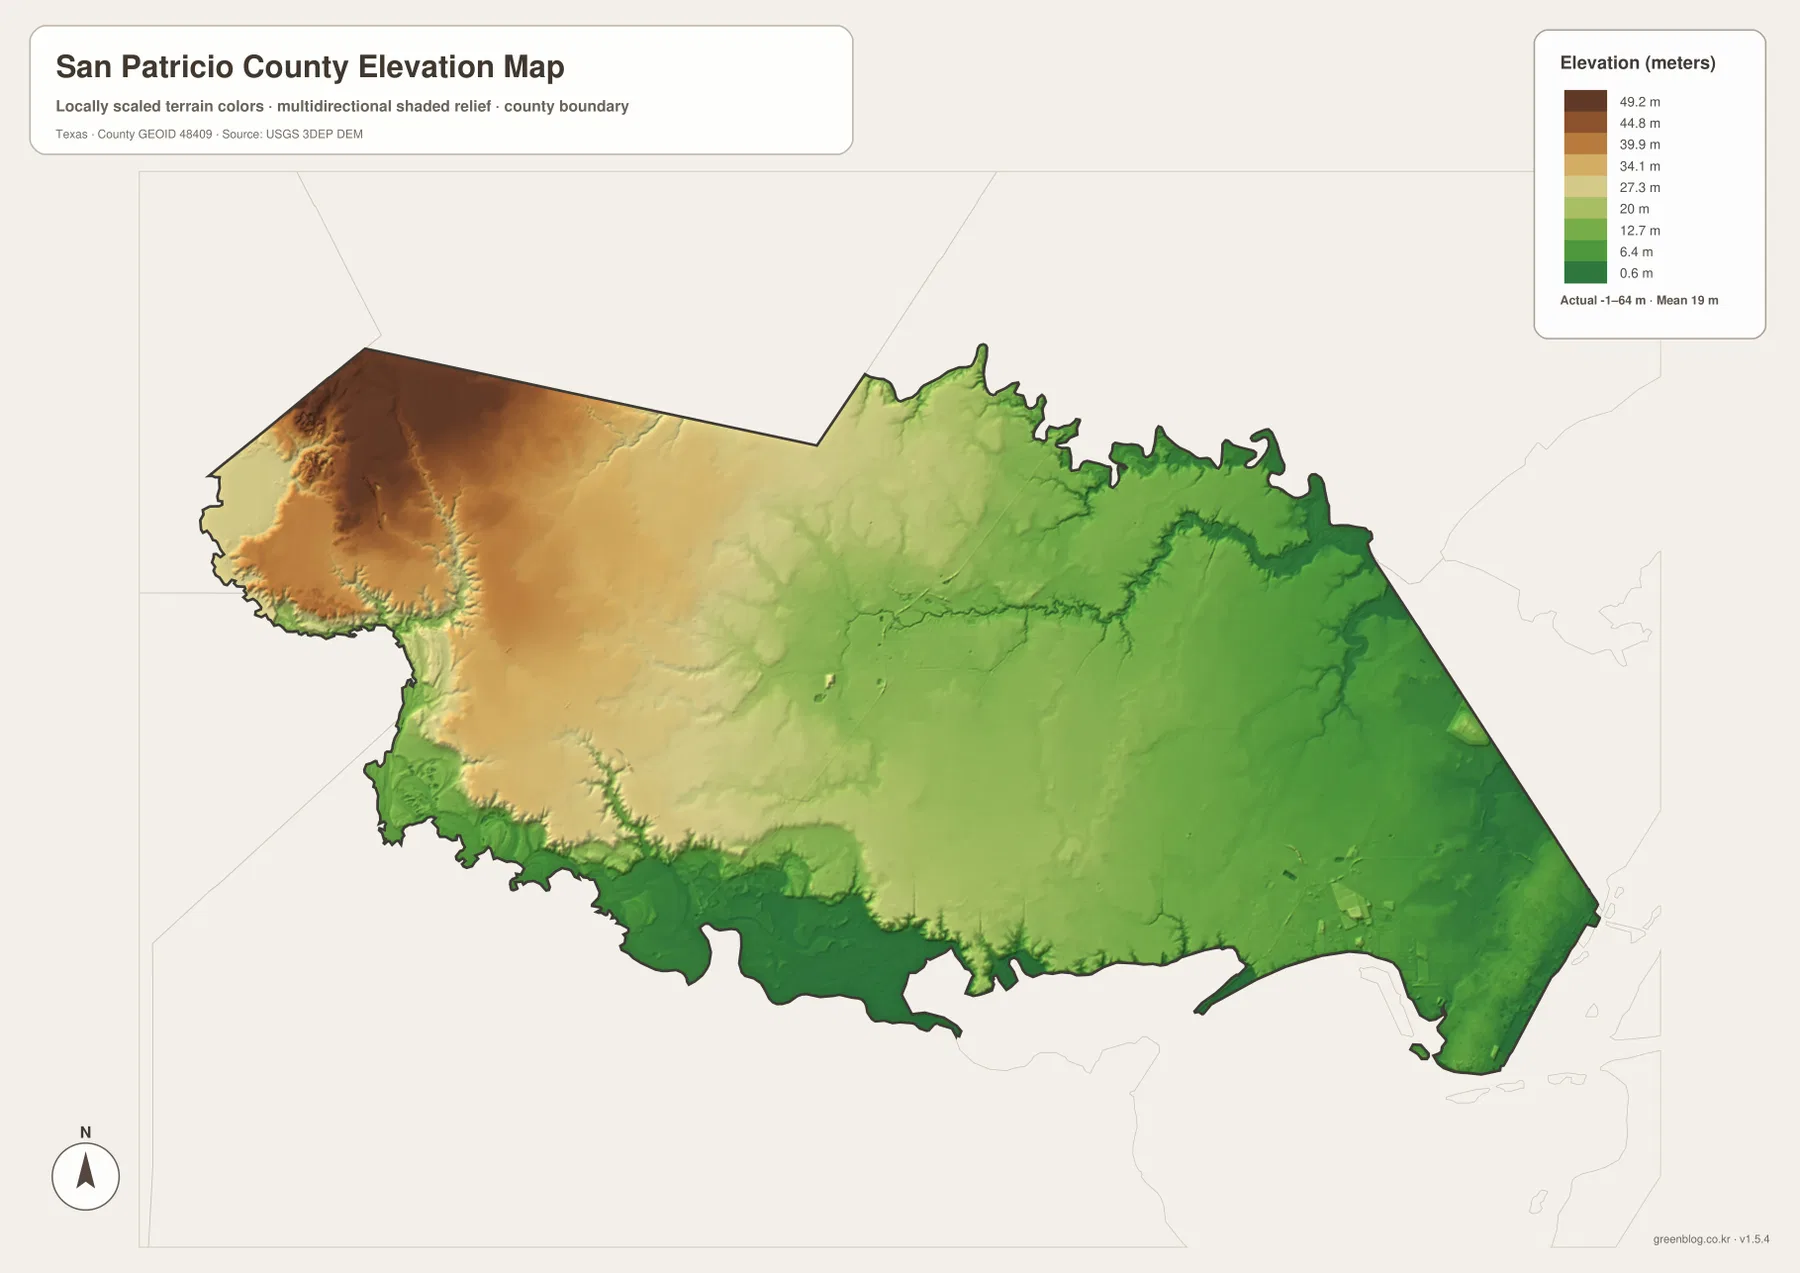
The elevation surface is intended for countywide comparison, not engineering or survey work. A green coastal area does not by itself establish flood risk, building suitability, or a legal development restriction. For those questions, detailed site-specific data would be required. Here, the map is most useful for comparing relative height and seeing how the drainage network relates to low ground.
Choosing between the inland, city, water, and elevation views
Use the county reference map when the priority is Sinton, road numbers, city positions, and the county outline in one view. The ranked city map is better for comparing Portland, Ingleside, Aransas Pass, Sinton, Mathis, and Taft without as much road detail. Choose the water map for the Nueces River, Corpus Christi Bay, Chiltipin Creek, South Fork Moody Creek, and the surrounding bay system. The elevation map is the clearest choice for showing the change from higher northwestern ground to the low coastal plain.
The WebP images in the article are convenient for quick viewing. For printing or editing, the ZIP below contains four high-resolution A3 JPG files from this package: the county reference map, ranked city map, terrain-and-water map, and elevation map. Because the maps remain separate files, you can print only the layer needed for a classroom handout, local reference page, presentation, or personal project.
Frequently Asked Questions
Where is Sinton on the San Patricio County map?
Sinton is near the middle of the county and is a useful reference point for routes 77, 188, and 181. Mathis is west of it, Taft and Portland are southeast, and Aransas Pass and Ingleside are farther east near the coastal side.
Which side of the county is Corpus Christi Bay on?
On the supplied water map, Corpus Christi Bay lies along the south and southeast side of San Patricio County. Nueces Bay is farther west, while Copano Bay, Port Bay, and other named waters are shown beyond the eastern side as regional references.
What elevation range is shown for San Patricio County?
The supplied elevation map states an actual range of about -1 to 64 meters and a mean of 19 meters. Higher terrain is concentrated in the northwest, while much of the southern and eastern coastal area is lower.
Map File Information
The ZIP contains the four San Patricio County maps in high-resolution A3 JPG format.
- Included Versions: County reference, ranked city, terrain and water, elevation
- Included Files: 4 A3 JPG maps
Related Maps
Sources and data references
County boundaries and road reference data can be checked through the U.S. Census Bureau TIGER/Line Shapefiles. Rivers, creeks, and water features can be cross-checked with USGS National Hydrography, while elevation data are available through the USGS 3D Elevation Program. The city index values, road numbers, named waters, and elevation figures described above are based on the four San Patricio County maps supplied in the current ZIP package.
Green Map creates custom-edited map images using open geographic data sources such as geoBoundaries, Natural Earth, OpenStreetMap, and government open data.
These maps are edited visual materials, not raw data files, and are provided for education, documents, presentations, and graphic reference.