This San Saba County Map set is built around the features that are easiest to verify in the supplied maps: San Saba near the center, Richland Springs to the northwest, a road network that spreads in several directions, the San Saba River crossing the middle of the county, and a marked elevation contrast between the higher southwest and the lower eastern river country. High-resolution A3 JPG versions of all four maps are available together in the download box below.
The county outline is also distinctive. Long straight segments define much of the west and south, while the north and east are much more irregular. Those bends correspond with a landscape cut by many creeks and river valleys. Reading the county, water, and elevation maps together makes the shape easier to understand because the boundary, drainage, and terrain are not treated as unrelated layers.
Table of Contents
San Saba is the natural reference point for the road network
On the general county map, San Saba sits a little east of center and is the clearest place to begin. Route 190 approaches from the direction of Richland Springs and continues through the San Saba area. Route 16 runs south from the same central zone. Routes 202 and 204 are marked nearby, while 124 appears farther northeast. Together these roads make San Saba the most useful anchor for comparing the western, northern, eastern, and southern parts of the county.
Richland Springs has a separate cluster of road labels. Routes 45 and 190 are visible around the community, with 246 and 502 farther north. In the southwest, routes 360, 308, and 346 help identify the interior road pattern. Near the southern edge, 501 and 71 are labeled, while 580 and 446 appear toward the east and southeast. The map is easier to read if the towns are located first and the route numbers are followed from those points rather than memorized as an isolated list.
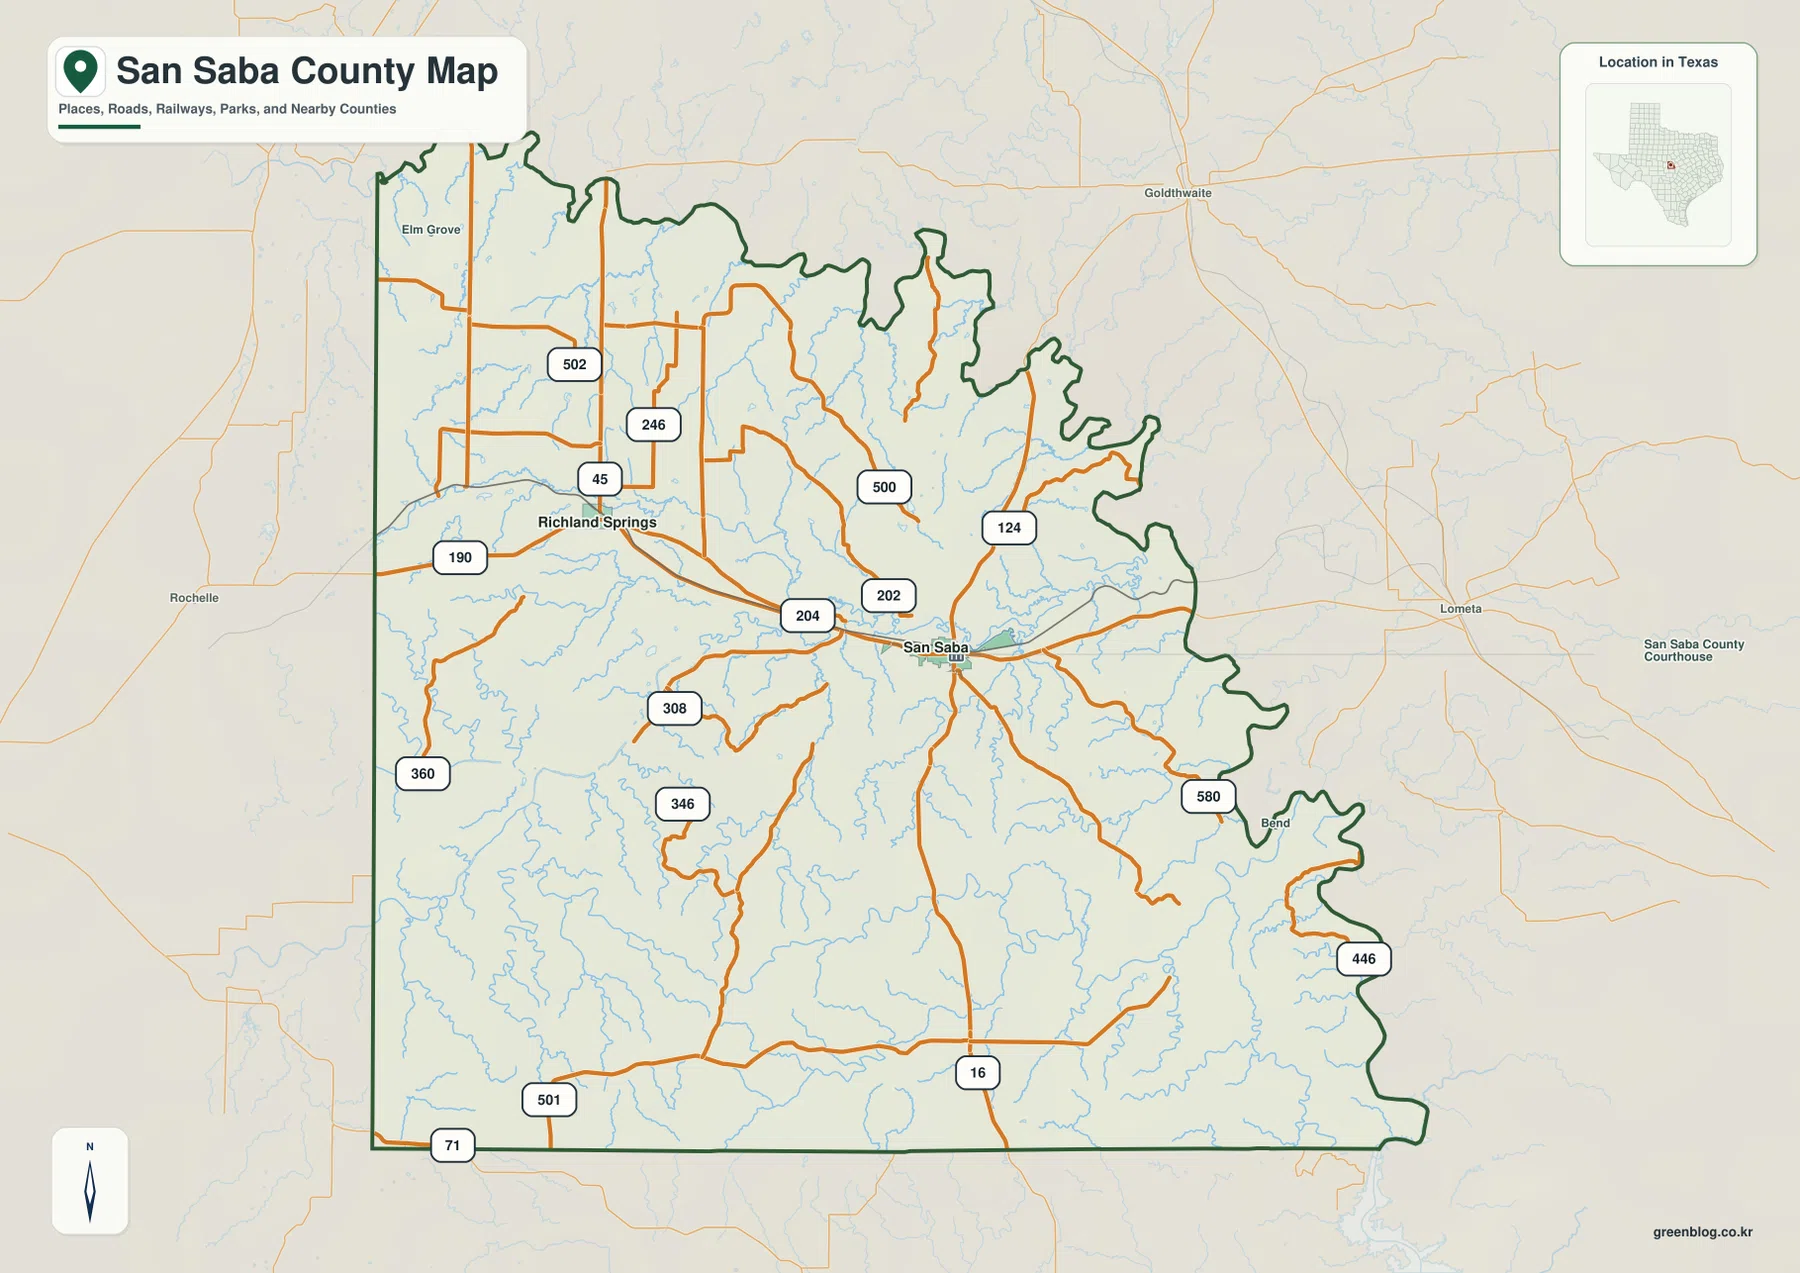
Elm Grove is labeled in the northwest, and Bend appears close to the eastern boundary. Outside the county, Goldthwaite, Lometa, and Rochelle provide additional reference points for direction. These smaller labels are useful because they show that San Saba and Richland Springs are not floating in an empty county outline. They sit within a broader road and settlement pattern that extends beyond the boundary.
The city map separates San Saba from Richland Springs without road clutter
The ranked city map highlights only two major places: San Saba and Richland Springs. San Saba is positioned in the central-eastern part of the county, while Richland Springs is farther northwest. That separation is immediately visible because the map removes most route shields and secondary place labels. It is a useful version for a classroom handout or county introduction where the goal is simply to show the main named communities.
The CITY INDEX printed along the bottom lists San Saba at 3,056 and Richland Springs at 362. Those are the values used by the supplied graphic to rank the two places. They should not be treated as guaranteed current population figures; anyone who needs the latest demographic count should check an official statistical source. For understanding the map, however, the index makes the number 1 and number 2 labels easy to interpret.
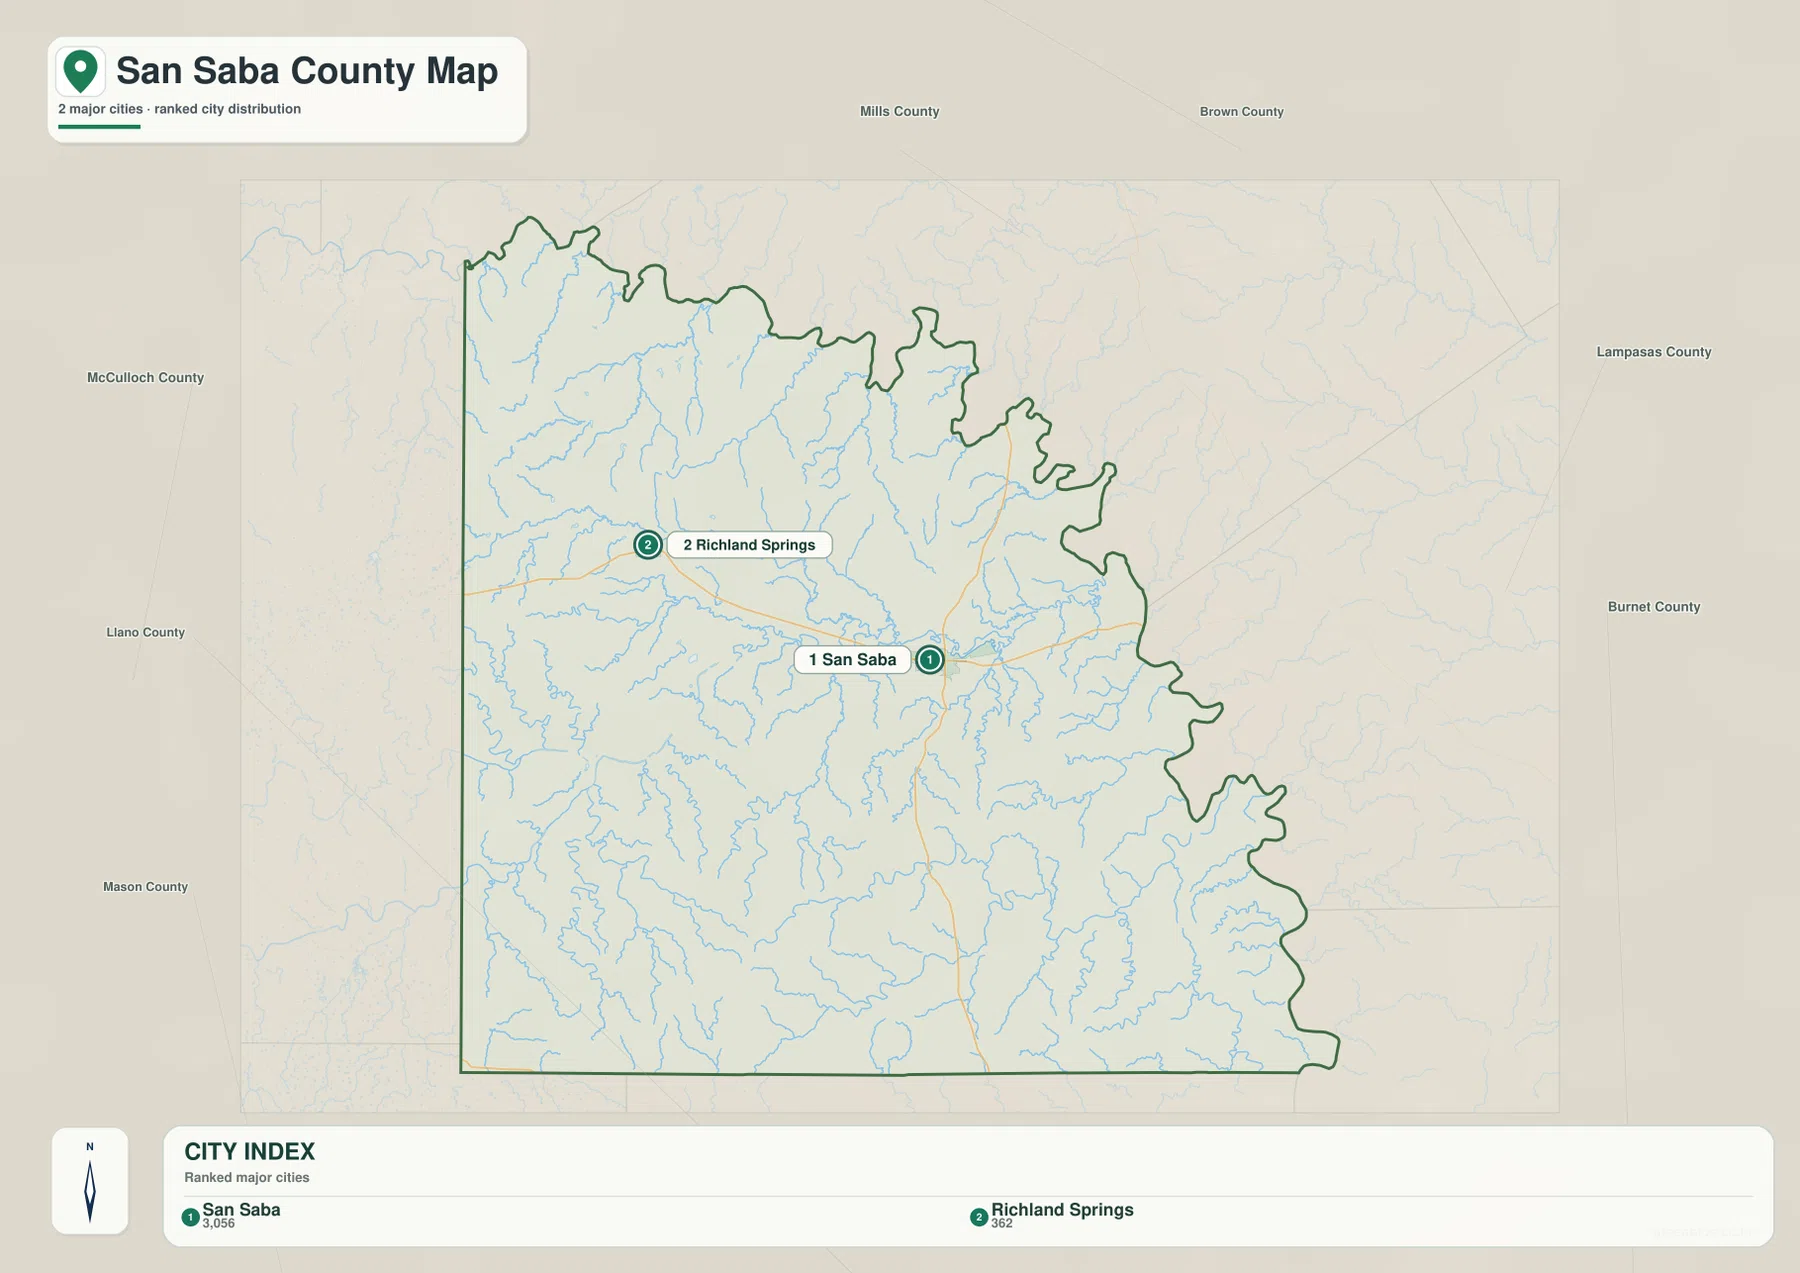
The surrounding county labels add regional context. Mills and Brown counties are shown to the north, McCulloch, Llano, and Mason counties to the west, and Lampasas and Burnet counties to the east. These labels help place the two towns within the larger area and make the northwest-to-center relationship between Richland Springs and San Saba easier to remember.
The San Saba River organizes a dense network of creeks
The terrain-and-water map gives the San Saba River the strongest visual emphasis. It crosses the middle of the county from west toward east and receives many smaller channels along the way. Richland Springs Creek and Richland Creek are labeled in the northwest and west-central area, helping connect the water network with the Richland Springs side of the county. Farther north, Wilbarger Creek and Harlow Lake stand out among the smaller blue features.
Lake Margery appears near the central river corridor, with Wallace Creek approaching from the south. Farther east, Spring Branch and Simpson Creek are labeled near the San Saba River, while Rough Creek lies to the south. The lower half of the county contains another strong set of named waterways: Buffalo Creek runs across the south-central area, Cherokee Creek joins the same general drainage zone, Marley Creek is labeled toward the southeast, and West Deep Creek appears near the southwest.
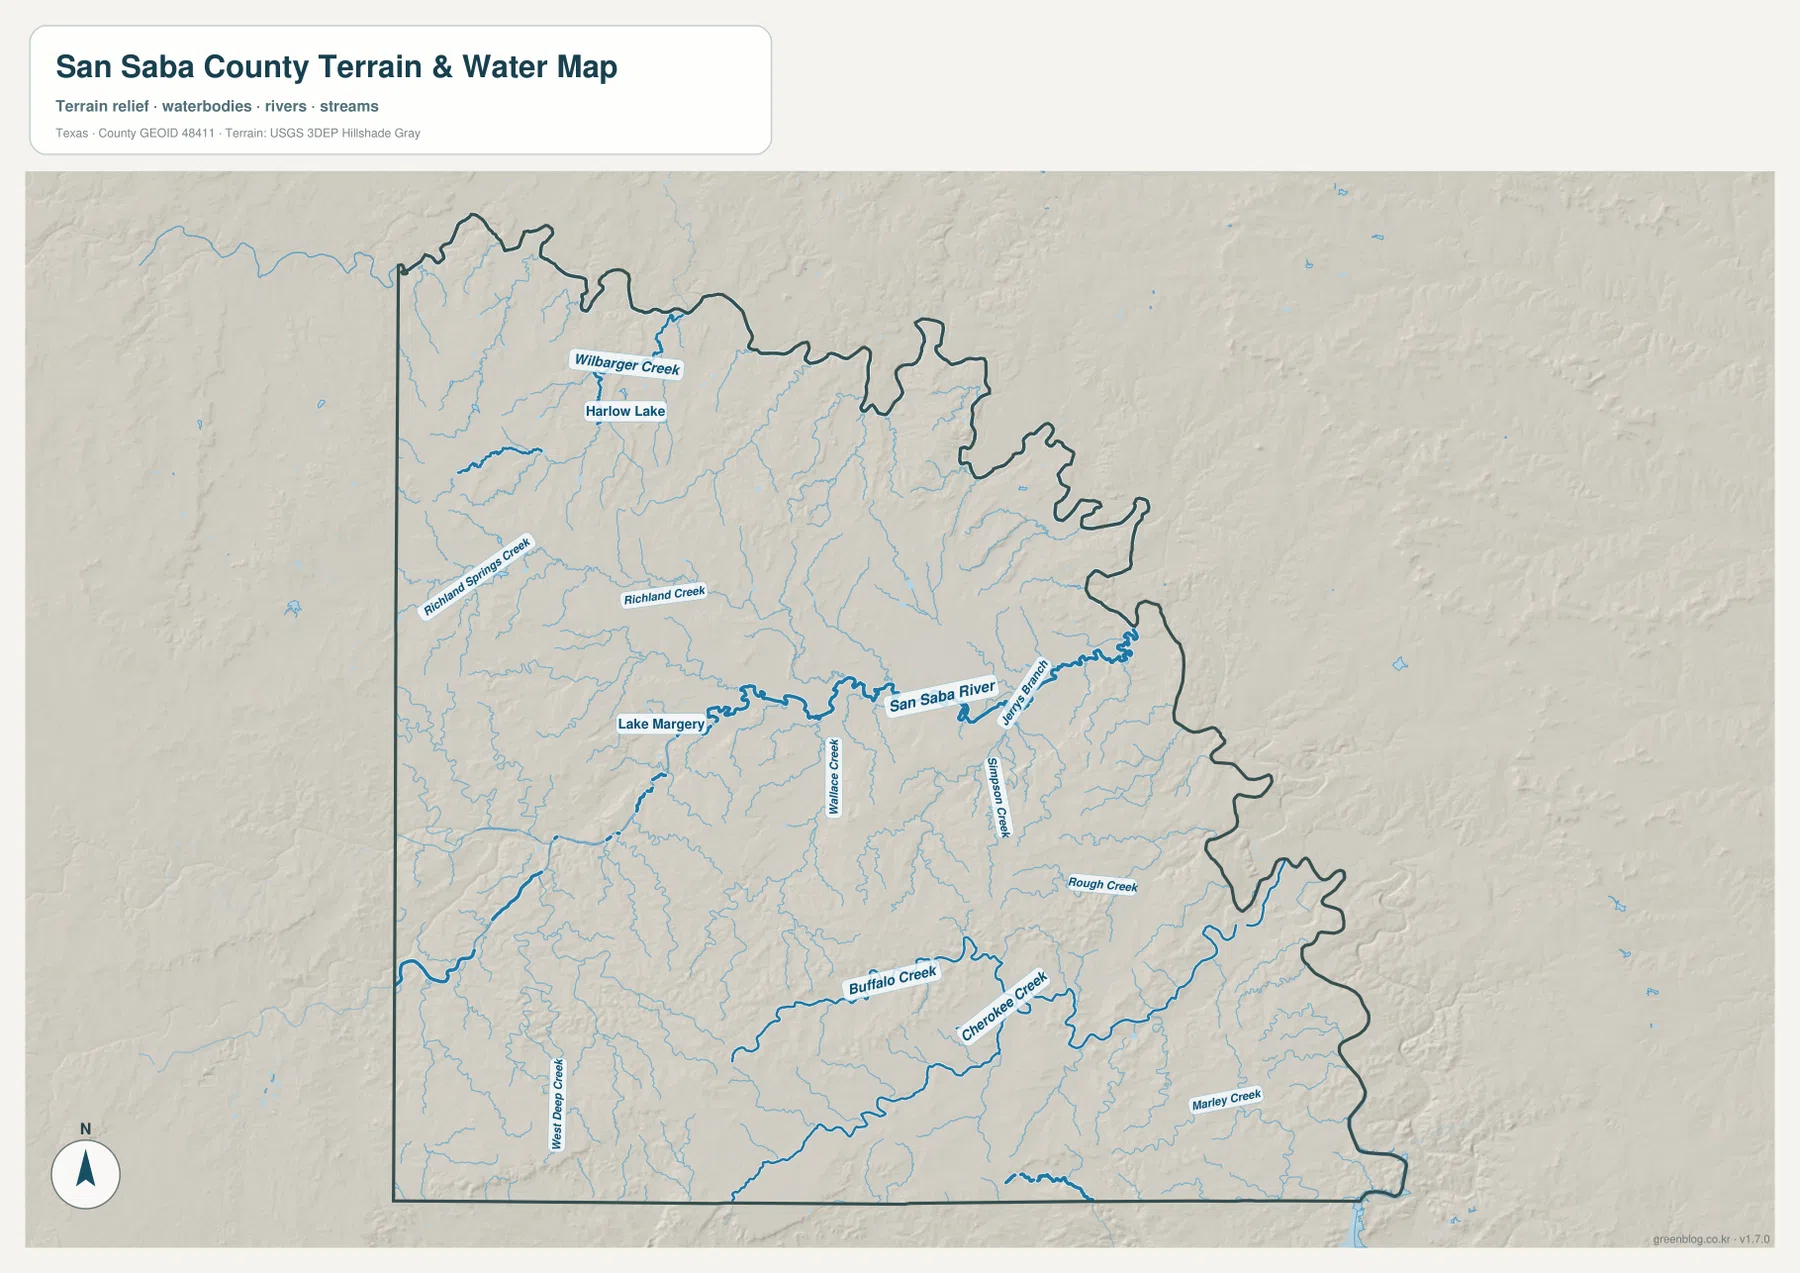
The map shows why the eastern and northern county edges are so irregular. Numerous channels and low valleys approach those boundaries, while the west and south retain longer straight lines. A simple way to read the network is to begin with the San Saba River, then separate the northern Richland Creek area from the southern Buffalo Creek and Cherokee Creek area. This avoids turning the page into a list of water names and makes the drainage pattern easier to follow.
Higher southwestern ridges give way to lower eastern river valleys
The elevation map reports an actual range of about 306 to 604 meters and a mean elevation of 443 meters. Brown and tan colors mark the higher terrain, and the strongest concentration appears in the southwest. Elevated ridges also extend through parts of the west and northwest. In contrast, broad green areas cover much of the central-east and eastern side, especially along the lower river and creek valleys.
The southwest is not represented by one isolated summit. Instead, many ridges and valleys create a rough surface that gradually becomes lower toward the east. The northern section also contains broken hills, but the colors are generally less elevated than the darkest southwestern areas. When this map is compared with the water map, many of the green corridors line up with the San Saba River and its tributaries, making the relationship between drainage and terrain easy to see.
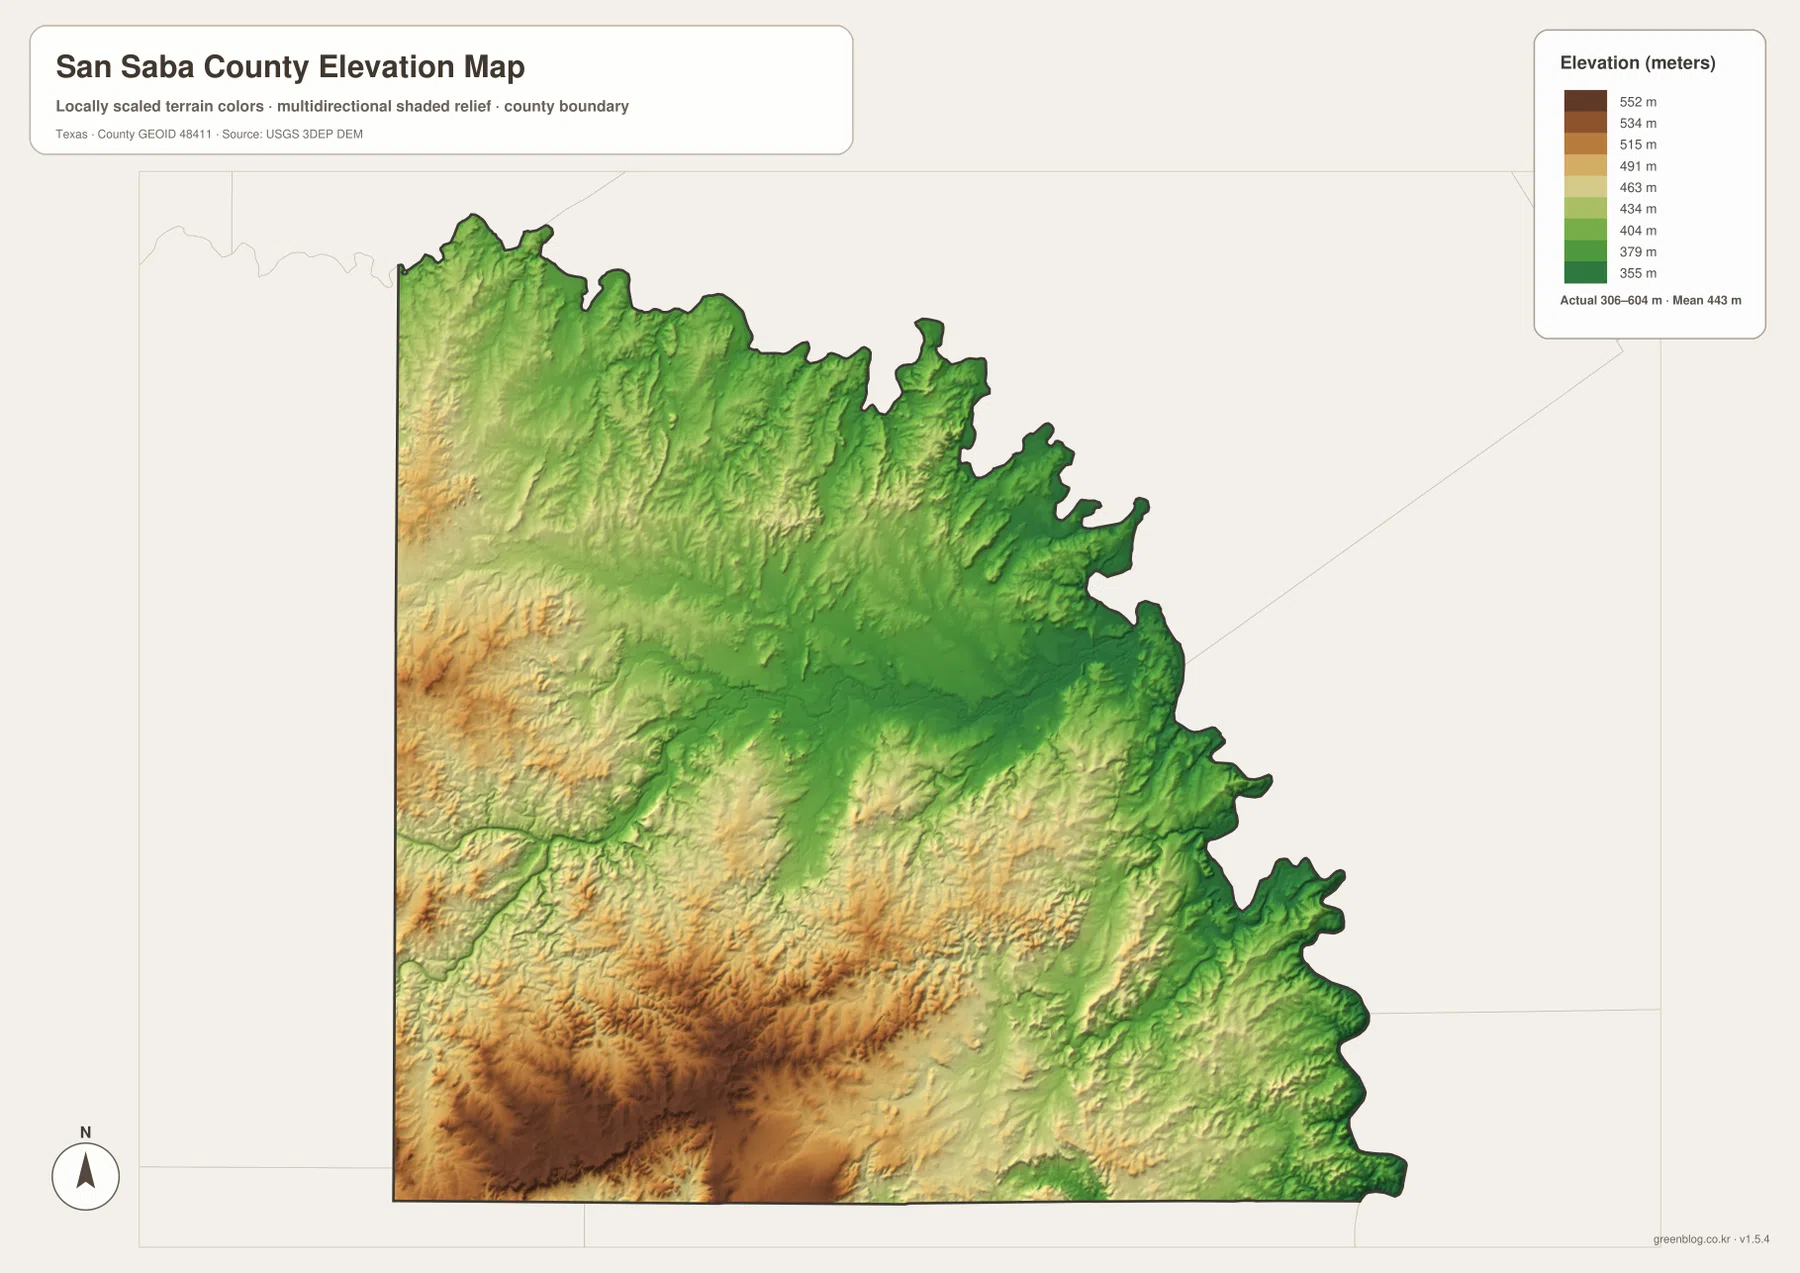
This countywide elevation surface is intended for broad terrain comparison, not parcel-level surveying or engineering design. It is useful for seeing which side of the county is relatively high, where major valleys cut through the hills, and why the river network follows lower corridors. A project that needs the exact elevation of a specific point should use the underlying elevation data or a detailed local survey instead.
Choosing the clearest view for roads, towns, water, or relief
Use the county reference map when you need San Saba, Richland Springs, route numbers, the county outline, and nearby places in one view. The ranked city map is better when only the two principal mapped cities need to stand out. Choose the water map for the San Saba River, Richland Creek, Buffalo Creek, Cherokee Creek, Harlow Lake, and Lake Margery. The elevation map is the clearest choice for comparing the high southwestern terrain with the lower eastern river valleys.
The WebP images in the article are convenient for quick viewing. For printing or editing, the ZIP below contains four matching high-resolution A3 JPG files: the county reference map, ranked city map, terrain-and-water map, and elevation map. Keeping them as separate files makes it easy to print only the map needed for a classroom handout, local reference page, presentation, or personal project.
Frequently Asked Questions
How far apart are San Saba and Richland Springs?
The supplied city map does not provide a straight-line or driving distance between the two places. It shows Richland Springs northwest of San Saba. For an exact travel distance, use a current road-routing source rather than estimating mileage from this county map.
Where does the San Saba River cross the county?
On the supplied water map, the San Saba River crosses the central part of the county from west toward east. Lake Margery and several named creeks are shown near the river corridor, while additional tributaries approach from both the north and south.
Which part of San Saba County is highest?
The elevation map places the strongest concentration of high brown terrain in the southwest, with additional higher ridges in the west and northwest. The east is generally lower. The map states an actual elevation range of about 306 to 604 meters and a mean of 443 meters.
Map File Information
The ZIP contains the four San Saba County maps in high-resolution A3 JPG format.
- Included Versions: County reference, ranked city, terrain and water, elevation
- Included Files: 4 A3 JPG maps
Related Maps
Sources and data references
County boundaries and road reference data can be checked through the U.S. Census Bureau TIGER/Line Shapefiles. Rivers, streams, and water features can be cross-checked with USGS National Hydrography, while elevation data are available through the USGS 3D Elevation Program. The city index values, road numbers, named waters, and elevation figures described above are based on the four San Saba County maps supplied in the current ZIP package.
Green Map creates custom-edited map images using open geographic data sources such as geoBoundaries, Natural Earth, OpenStreetMap, and government open data.
These maps are edited visual materials, not raw data files, and are provided for education, documents, presentations, and graphic reference.