You can download four high-resolution A3 JPG maps of Menard County, Texas, in one ZIP directly from this page. The package includes a general county map, a ranked city map, a terrain-and-water map, and an elevation map. Together they show Menard, roads 83, 190, 29, 864, 213, and 377, San Saba River, named creeks and a small lake, and an actual elevation range of about 513 to 741 meters.
Menard is the best starting point because it sits near the center of the county where roads and the San Saba River valley come together. Route 190 crosses the county through the Menard area, while Route 83 provides a north-south reference. Route 29 continues southeast, and roads 864, 213, and 377 help locate the western and southern edges. The terrain becomes increasingly rugged away from the central river valley, with high western and southwestern hills divided by numerous creek channels.
Table of Contents
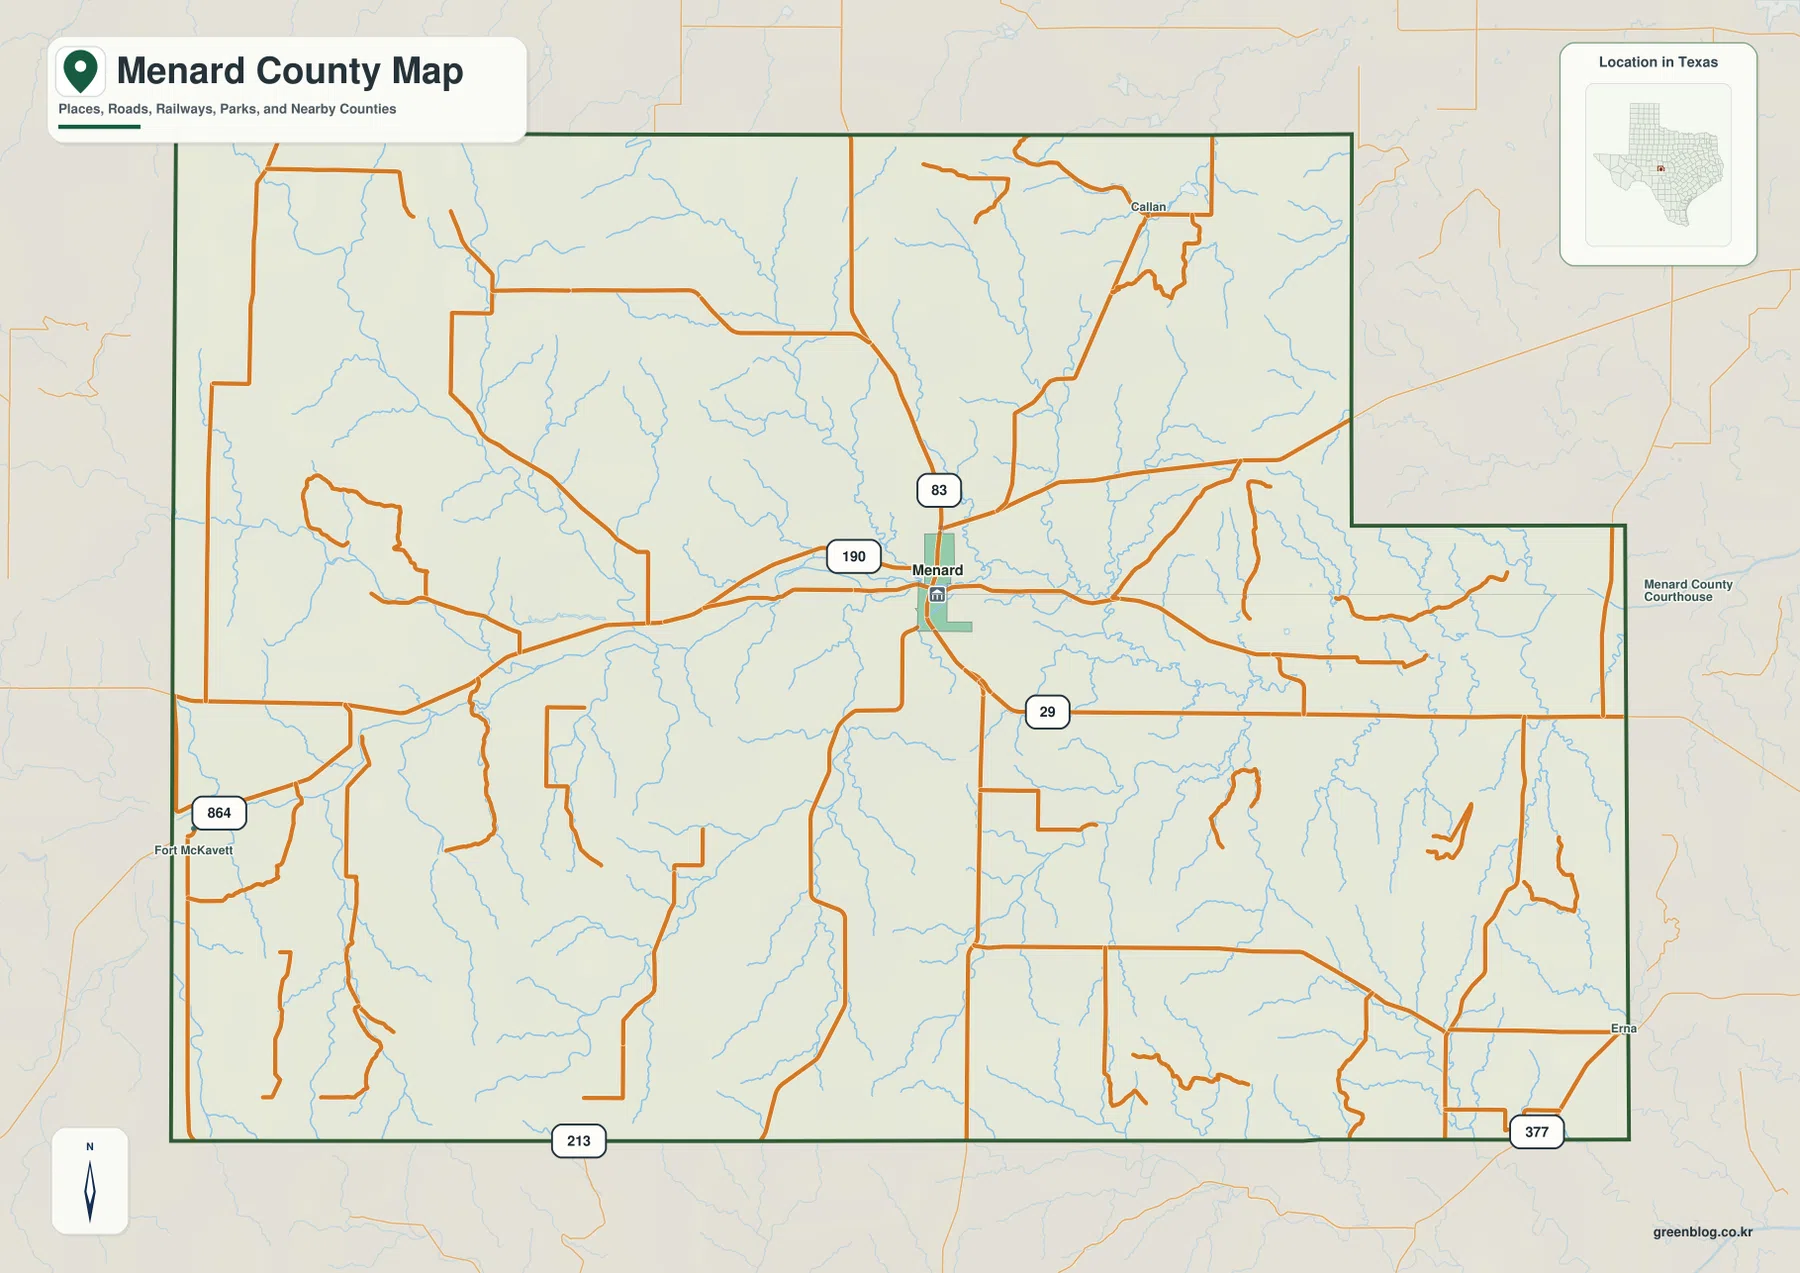
Menard and routes 83 and 190 anchor the center of the road map
Menard is the strongest settlement label on the general county map. The town appears near the center with a courthouse symbol nearby, making it easy to identify. Route 190 runs through the same broad corridor from west to east, while Route 83 is labeled just north of the town. Those two roads provide the clearest framework for finding other features across the county.
Route 29 extends southeast from the Menard area, while Route 864 is labeled near the western edge around the Fort McKavett direction. Route 213 appears along the southern boundary, and Route 377 is shown at the southeastern corner. Callan is labeled in the northeastern interior, providing another place reference away from the county seat.
The many thin blue drainage lines are just as important as the roads. Western and northern hills are cut by tributaries that descend toward the central San Saba River corridor. The general map therefore works best as an orientation layer: use the numbered roads to establish direction, then switch to the water and elevation views to understand the terrain between them.
The city index highlights Menard as the single ranked major city
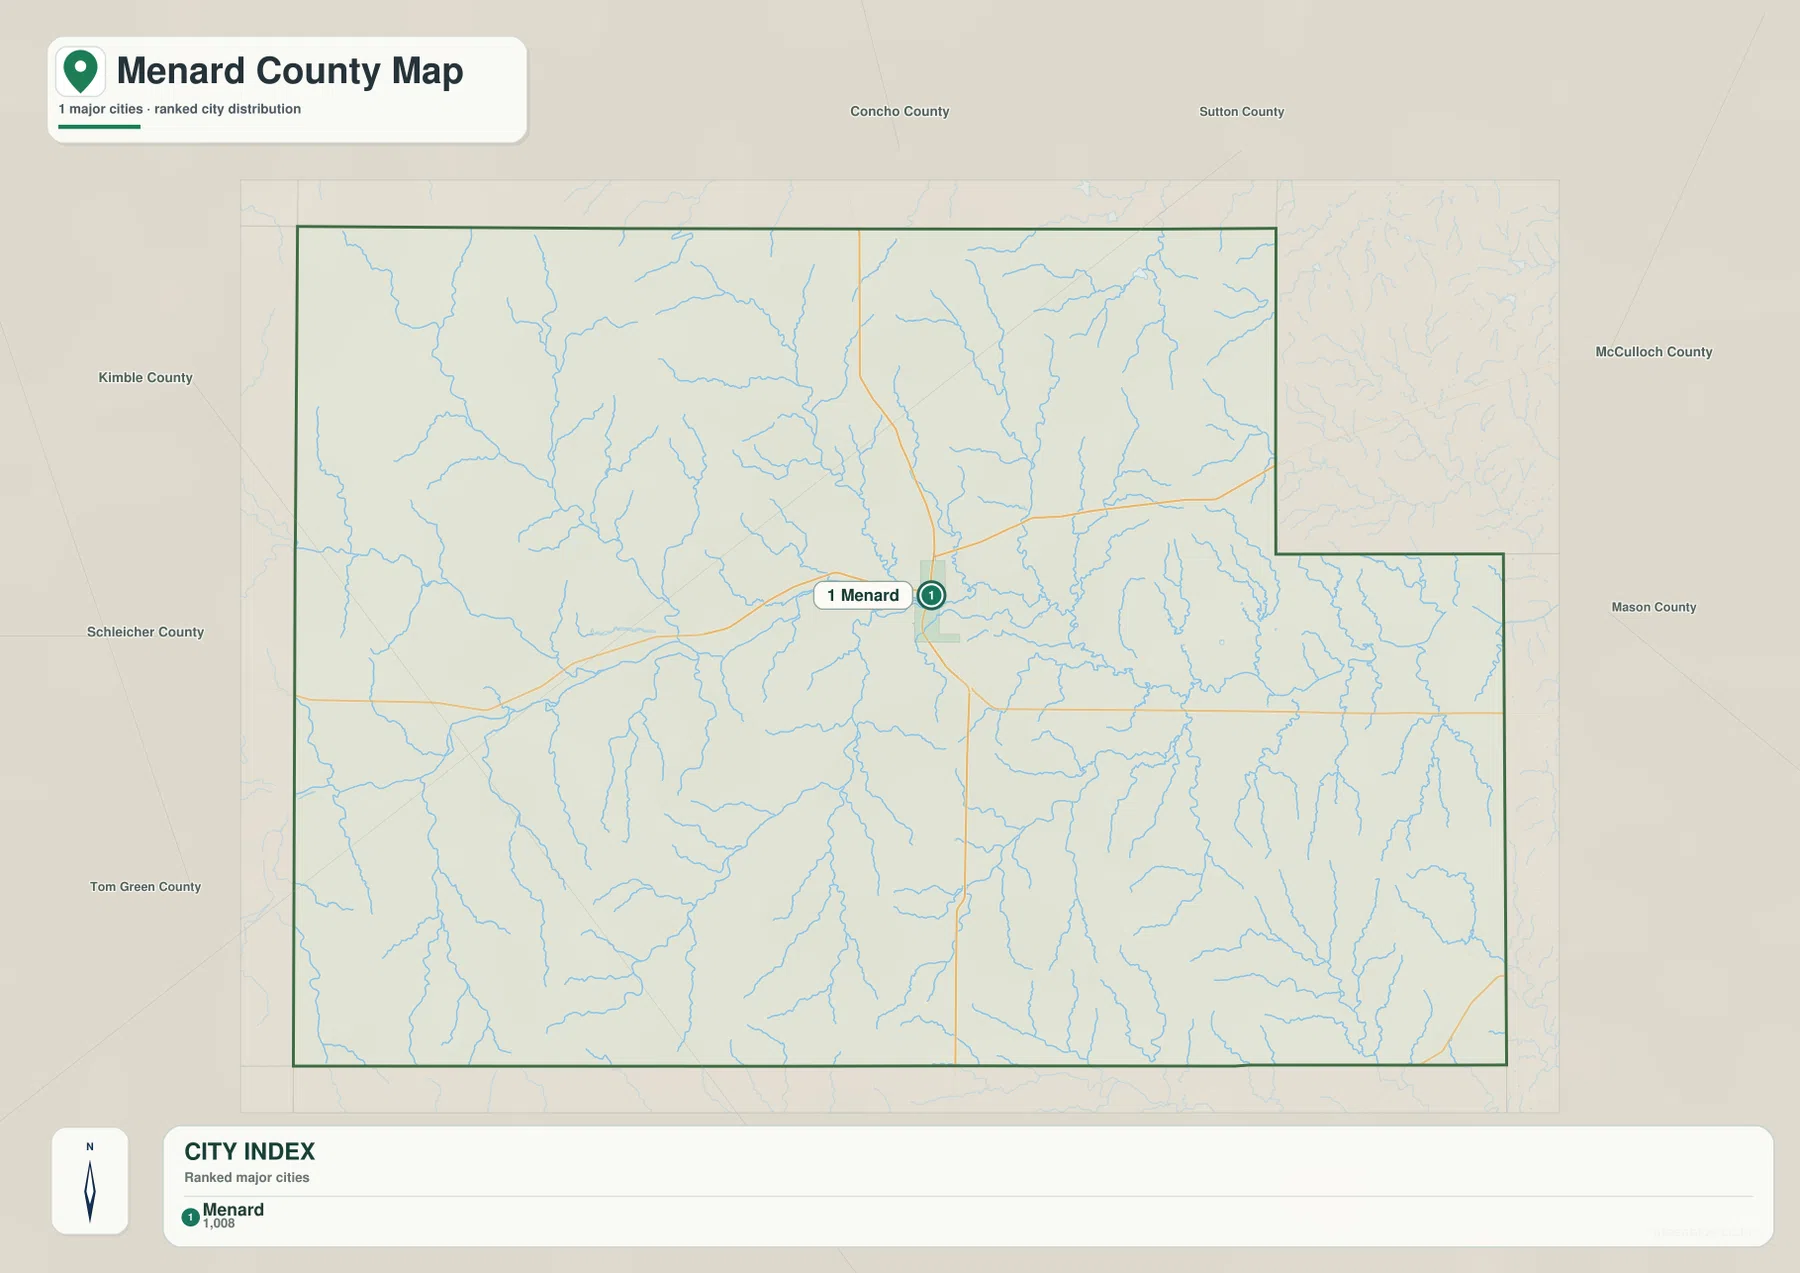
The ranked city map contains one major-city marker: Menard is number 1. The lower index also prints the value 1,008 beside the name. The supplied image does not identify a year for that figure, so this article treats it only as a value shown on the map rather than presenting it as a confirmed current population count.
With most road and place labels removed, Menard’s central position becomes very clear. The town sits close to the San Saba River corridor, while large areas of the county extend outward through creek-cut hills. The simplified map may look open, but the terrain-and-water layer shows that the surrounding interior is filled with branching drainage lines rather than featureless land.
Concho and Sutton counties are labeled to the north, McCulloch and Mason counties to the east, and Kimble, Schleicher, and Tom Green counties around the western side. These names help with regional orientation. The city map is most useful for locating Menard quickly; the general map provides road detail, and the terrain maps explain the physical landscape around the town.
San Saba River creates the main central valley through Menard County
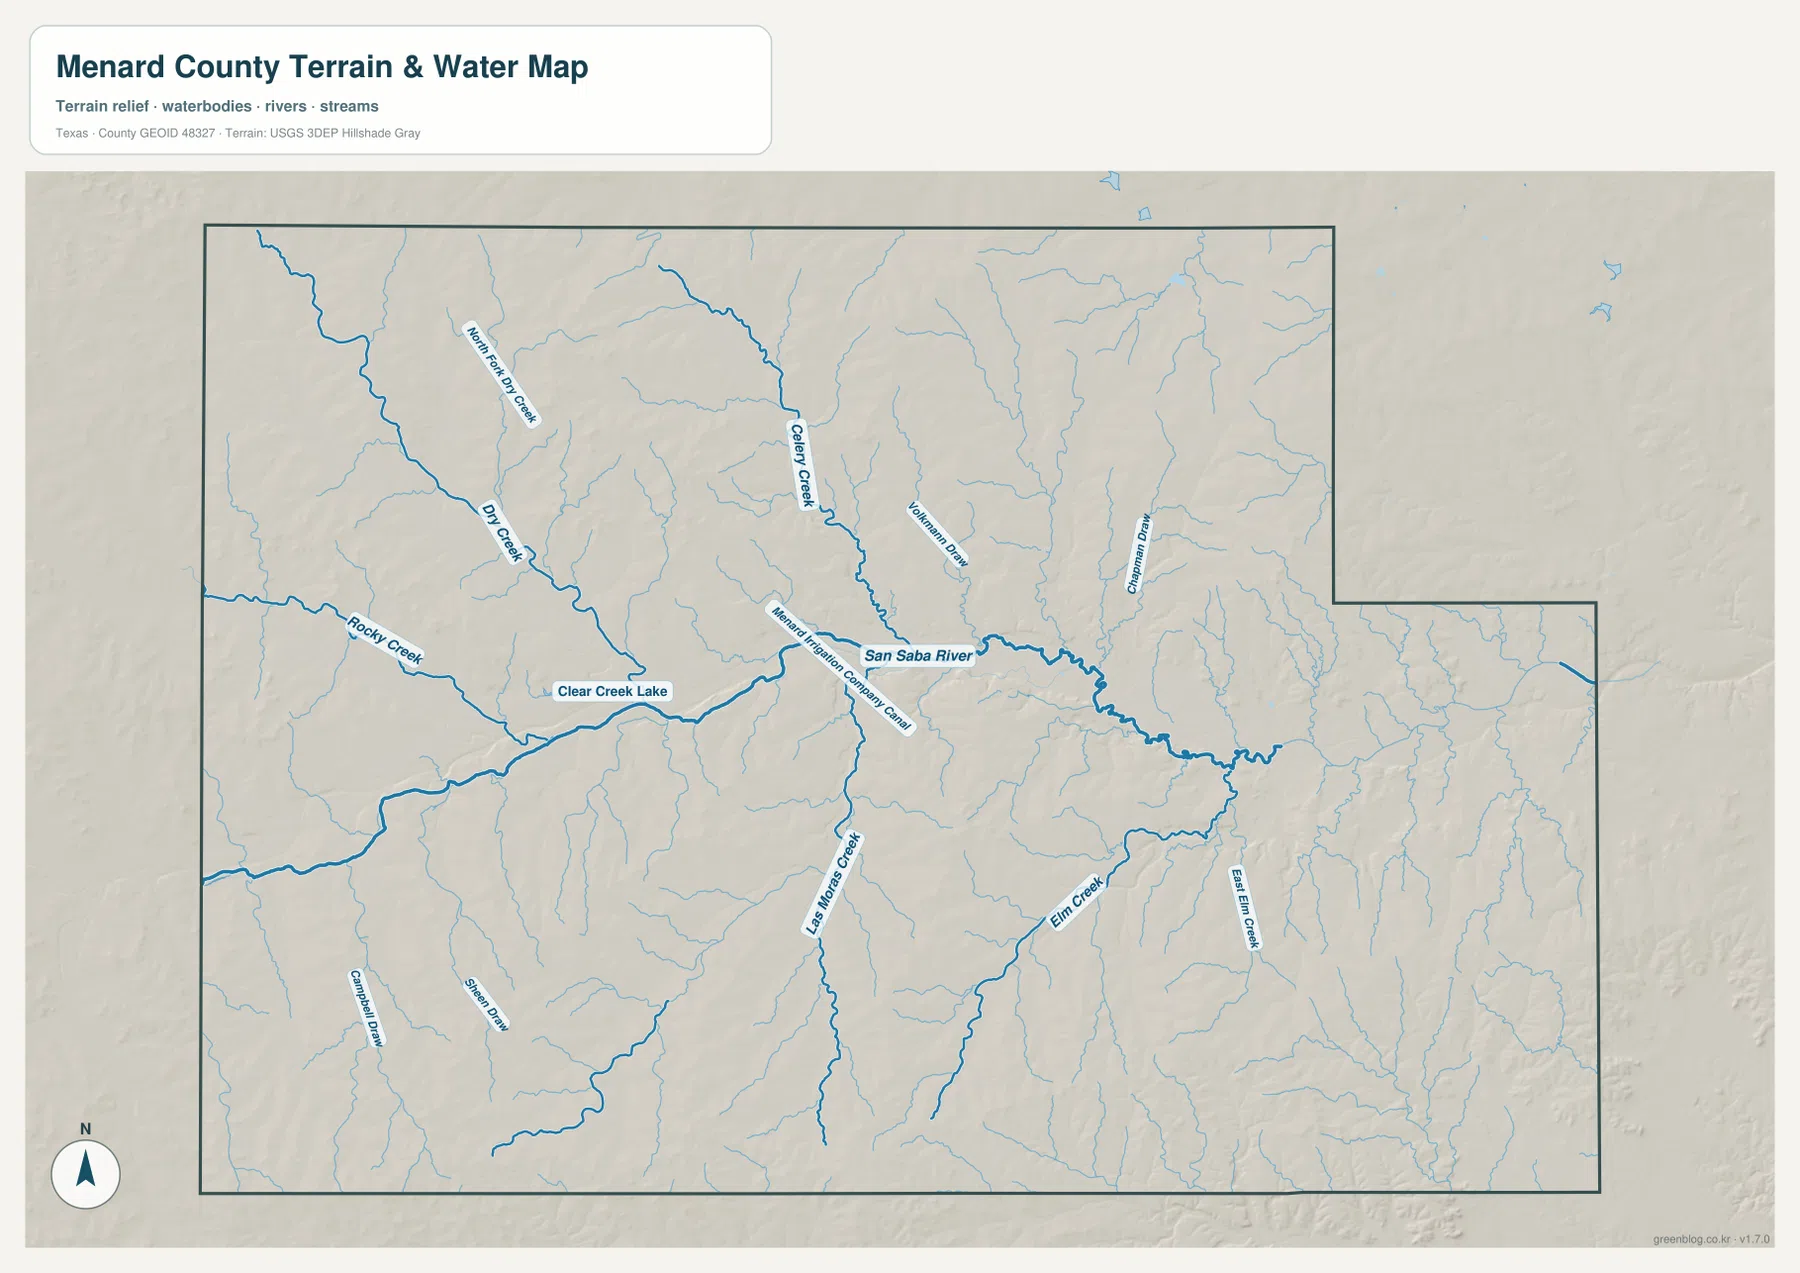
San Saba River is the most prominent named water feature on the terrain-and-water map. It enters from the west, crosses the central part of the county near Menard, and continues east through a broad winding valley. The river provides the clearest reference for understanding where the many northern and southern tributaries eventually converge.
North Fork Dry Creek and Dry Creek descend from the northwestern side, while Celery Creek approaches from the north-central interior. Johnson Draw and Cinnamon Draw are labeled farther east. Menard Irrigation Company Canal is marked close to the Menard area, providing a named artificial-water reference beside the natural river-and-creek network.
Rocky Creek and southern tributaries cut through the western and lower hills
Rocky Creek is a strong western water reference and runs toward the central drainage. Clear Creek Lake is labeled along the same broad western system. When the water map is compared with Route 864 and the Fort McKavett side on the general map, these features help locate the western hill country much more precisely.
Las Moras Creek runs northward from the southern interior, while Elm Creek and East Elm Creek occupy separate valleys farther east. Campbell Draw and Seven Draw are labeled in the southwest. The number of named tributaries helps explain why the shaded terrain appears so strongly dissected across much of the county.
The terrain-and-water map is intended for geographic reference. It can help locate San Saba River, Dry Creek, Rocky Creek, Clear Creek Lake, Celery Creek, Las Moras Creek, Elm Creek, and the canal relative to the county boundary. It is not a flood-hazard map, parcel map, legal water-boundary product, or navigation chart.
High western uplands descend into the San Saba River valley and lower east
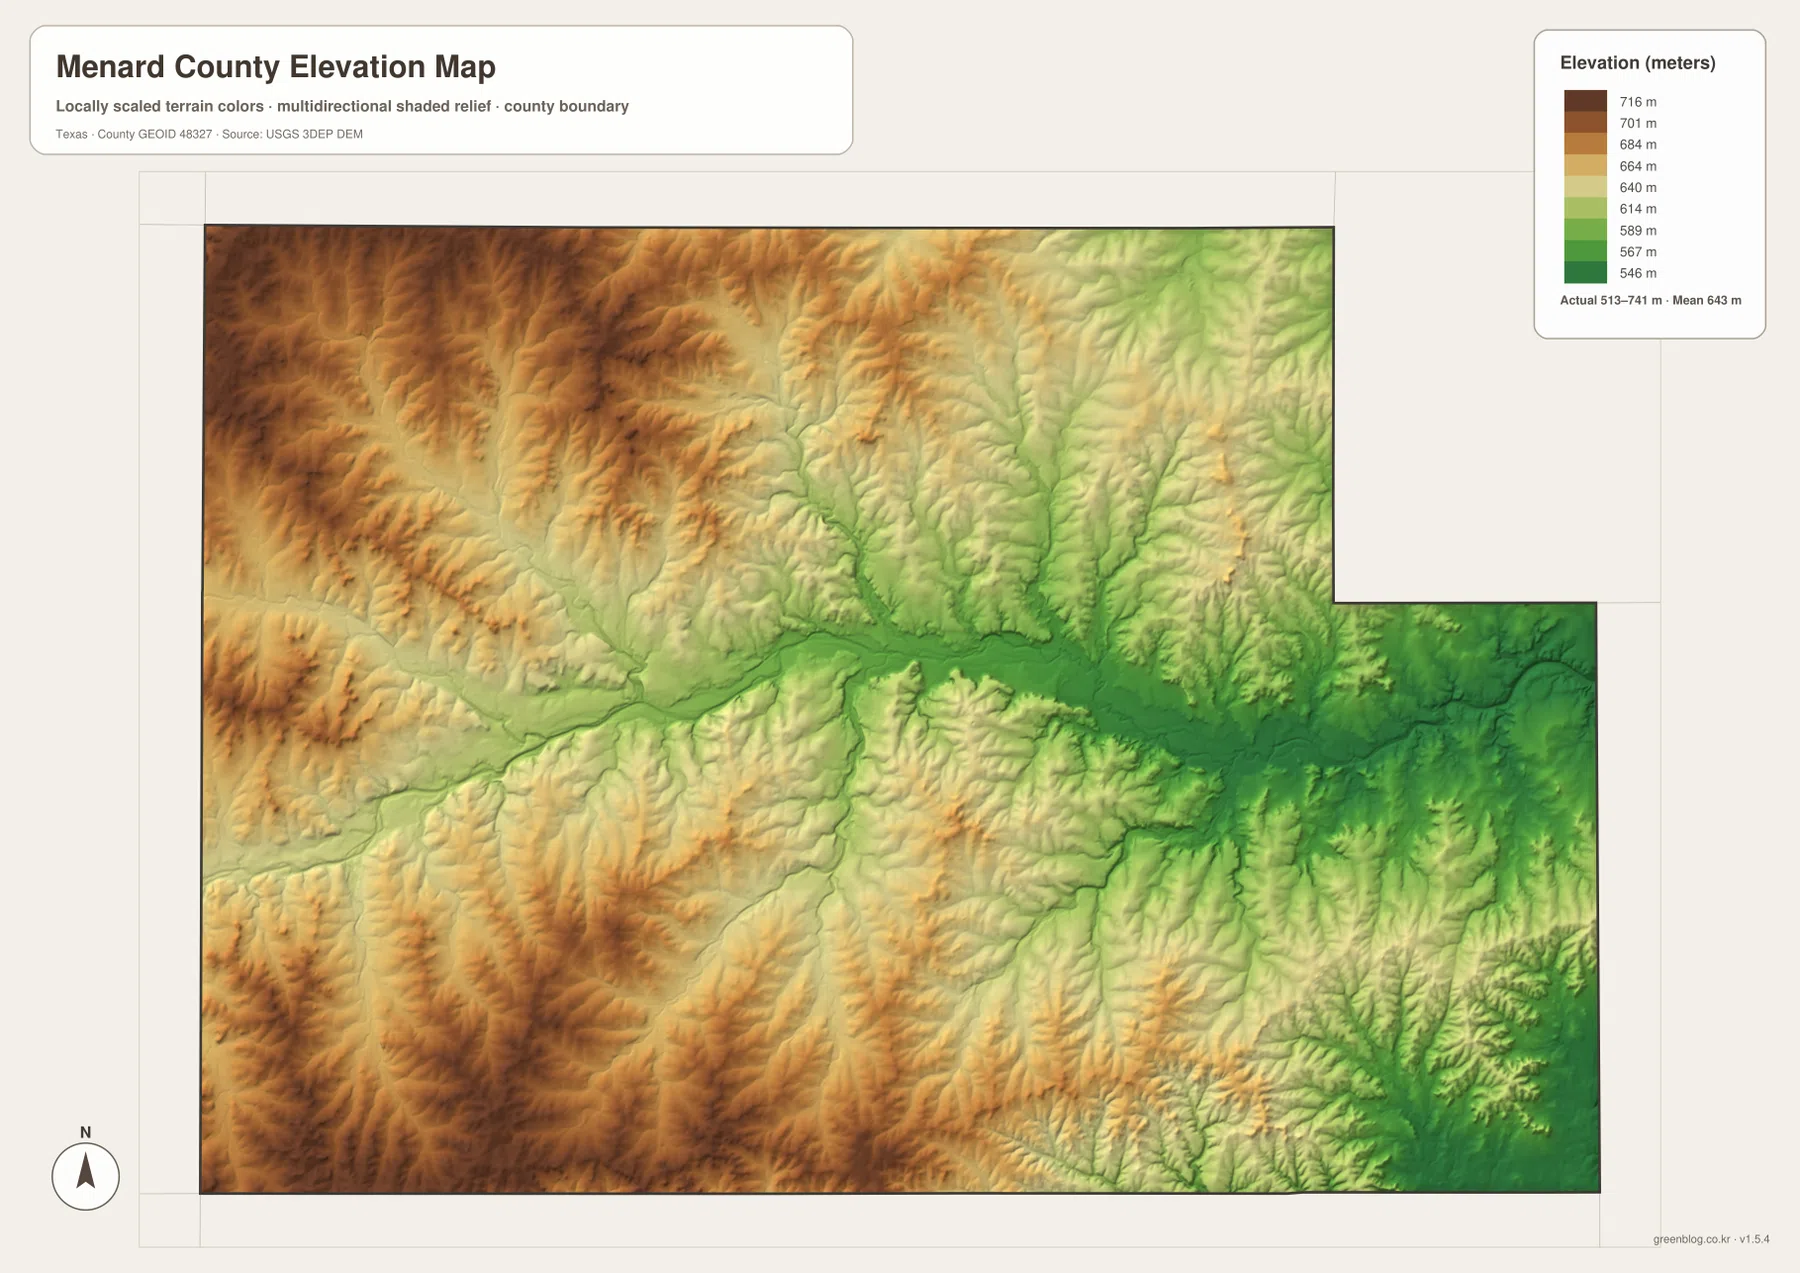
The elevation map reports an actual range of about 513 to 741 meters and a mean elevation of about 643 meters. The highest dark-brown terrain is concentrated across the west and southwest, with additional elevated ridges in the northwest. A long green low corridor follows San Saba River through the middle, and lower terrain becomes more extensive toward the eastern side.
The western uplands are deeply cut by drainage rather than forming a smooth plateau. Rocky Creek and Dry Creek occupy lower valleys between the higher ridges, while Celery Creek and smaller tributaries descend from the north. The relationship between the blue water lines and green elevation corridors is especially clear when the two maps are viewed together.
The southwest also contains broad high ground, but Las Moras Creek and nearby draws create lower paths through the hills. By contrast, the central San Saba River valley forms the widest continuous low area. The difference between the displayed minimum and maximum elevation is about 228 meters, enough to make the upland-to-river contrast obvious.
The elevation layer is best used for relative terrain comparison rather than survey-grade or engineering-grade measurement. Its main value here is to connect Menard, the San Saba River corridor, the western hills, and the lower eastern terrain in one physical view.
Comparing both sides of Menard reveals the county’s strongest terrain contrast
Start at Menard on the general map and move west along Route 190 toward the Route 864 side. On the water map, Rocky Creek, Clear Creek Lake, and Dry Creek become more prominent. The elevation map shows the same direction climbing into the county’s highest western terrain, with narrow green valleys cutting through brown uplands.
Moving east from Menard produces a different sequence. Roads 190 and 29 continue across a broader lower landscape, while San Saba River remains the central water reference and Elm Creek and East Elm Creek join from the east and southeast. The elevation colors are greener than in the west, showing how the river valley widens and the terrain drops toward the eastern side.
Use the ranked city map when only Menard needs to be located, the general map for numbered roads and outer place references, the terrain-and-water map for named creeks and the San Saba River, and the elevation map for the contrast between the western uplands and central valley. Smaller labels are often easier to inspect in the downloadable high-resolution JPG files than in the browser previews.
Frequently Asked Questions
Which city is highlighted on the Menard County city map?
Menard is the single ranked major city on the supplied city map. It lies near the center of the county and is easy to locate on the general map near routes 83 and 190. The city index also prints 1,008, but no year is shown, so this article does not present that figure as a confirmed current population count.
Which water features are easiest to identify?
San Saba River is the strongest central reference. Dry Creek and Celery Creek approach from the north, Rocky Creek and Clear Creek Lake are in the west, Las Moras Creek comes from the south, and Elm Creek and East Elm Creek are labeled on the eastern side.
What elevation range is shown for Menard County?
The supplied elevation map reports an actual range of about 513 to 741 meters and a mean elevation of about 643 meters. The west and southwest are generally higher, while the San Saba River valley and eastern side occupy lower terrain.
Sources and Reference Data
- U.S. Census Bureau TIGER/Line Shapefiles — official county-boundary and road geometry for geographic reference.
- USGS National Hydrography — official resources for rivers, creeks, lakes, and channels.
- USGS 3D Elevation Program — official elevation resources used for terrain information.
- USGS The National Map Viewer — an official viewer for comparing geographic layers.
Map File Information
Download four high-resolution A3 JPG maps of Menard County, Texas, in one ZIP file.
- Included Files: county map, ranked city map, terrain and water map, elevation map
- File Type: JPG
Related Maps
- Schleicher County Texas map
- Sutton County Texas map
- Runnels County Texas map
- Tom Green County Texas map
- San Saba County Texas map
Green Map creates custom-edited map images using open geographic data sources such as geoBoundaries, Natural Earth, OpenStreetMap, and government open data.
These maps are edited visual materials, not raw data files, and are provided for education, documents, presentations, and graphic reference.