This Tom Green County Map set is centered on San Angelo, then follows the county northwest toward Carlsbad and Grape Creek, south toward Christoval, and outward through the branches of the Concho River. Download the high-resolution A3 JPG map ZIP from the box below when you need printable or editable files; it contains separate county-reference, ranked-city, terrain-and-water, and elevation maps.
San Angelo is the dominant settlement in Tom Green County, but the surrounding terrain is varied enough that the road map alone does not tell the whole story. Carlsbad and Grape Creek lie to the northwest, Christoval is far to the south, and the county stretches west through a narrow extension. The North, Middle, and South Concho rivers approach the San Angelo area from different directions, while the elevation map shows high ground in the west, northwest, and south surrounding a lower central and eastern river corridor.
Table of Contents
San Angelo is the best starting point for roads and outlying places
On the county reference map, San Angelo sits slightly north of the county’s central area and is surrounded by the densest road network. Route shield 87 is easy to find on the east side, while 277 runs south toward Christoval. Other visible labels include 67 to the southwest, 208 to the north, 306 just south of the urban core, and 570 to the east. These routes give the San Angelo area several clear outward directions before the smaller roads are considered.
Grape Creek appears northwest of San Angelo, and Carlsbad is farther along the same broad direction. The two places are separated by different stream and road corridors, so they work well as distinct references for the northwestern part of the county. Christoval lies much farther south along the 277 direction and near the South Concho River valley, making it the clearest southern settlement reference on the supplied map.
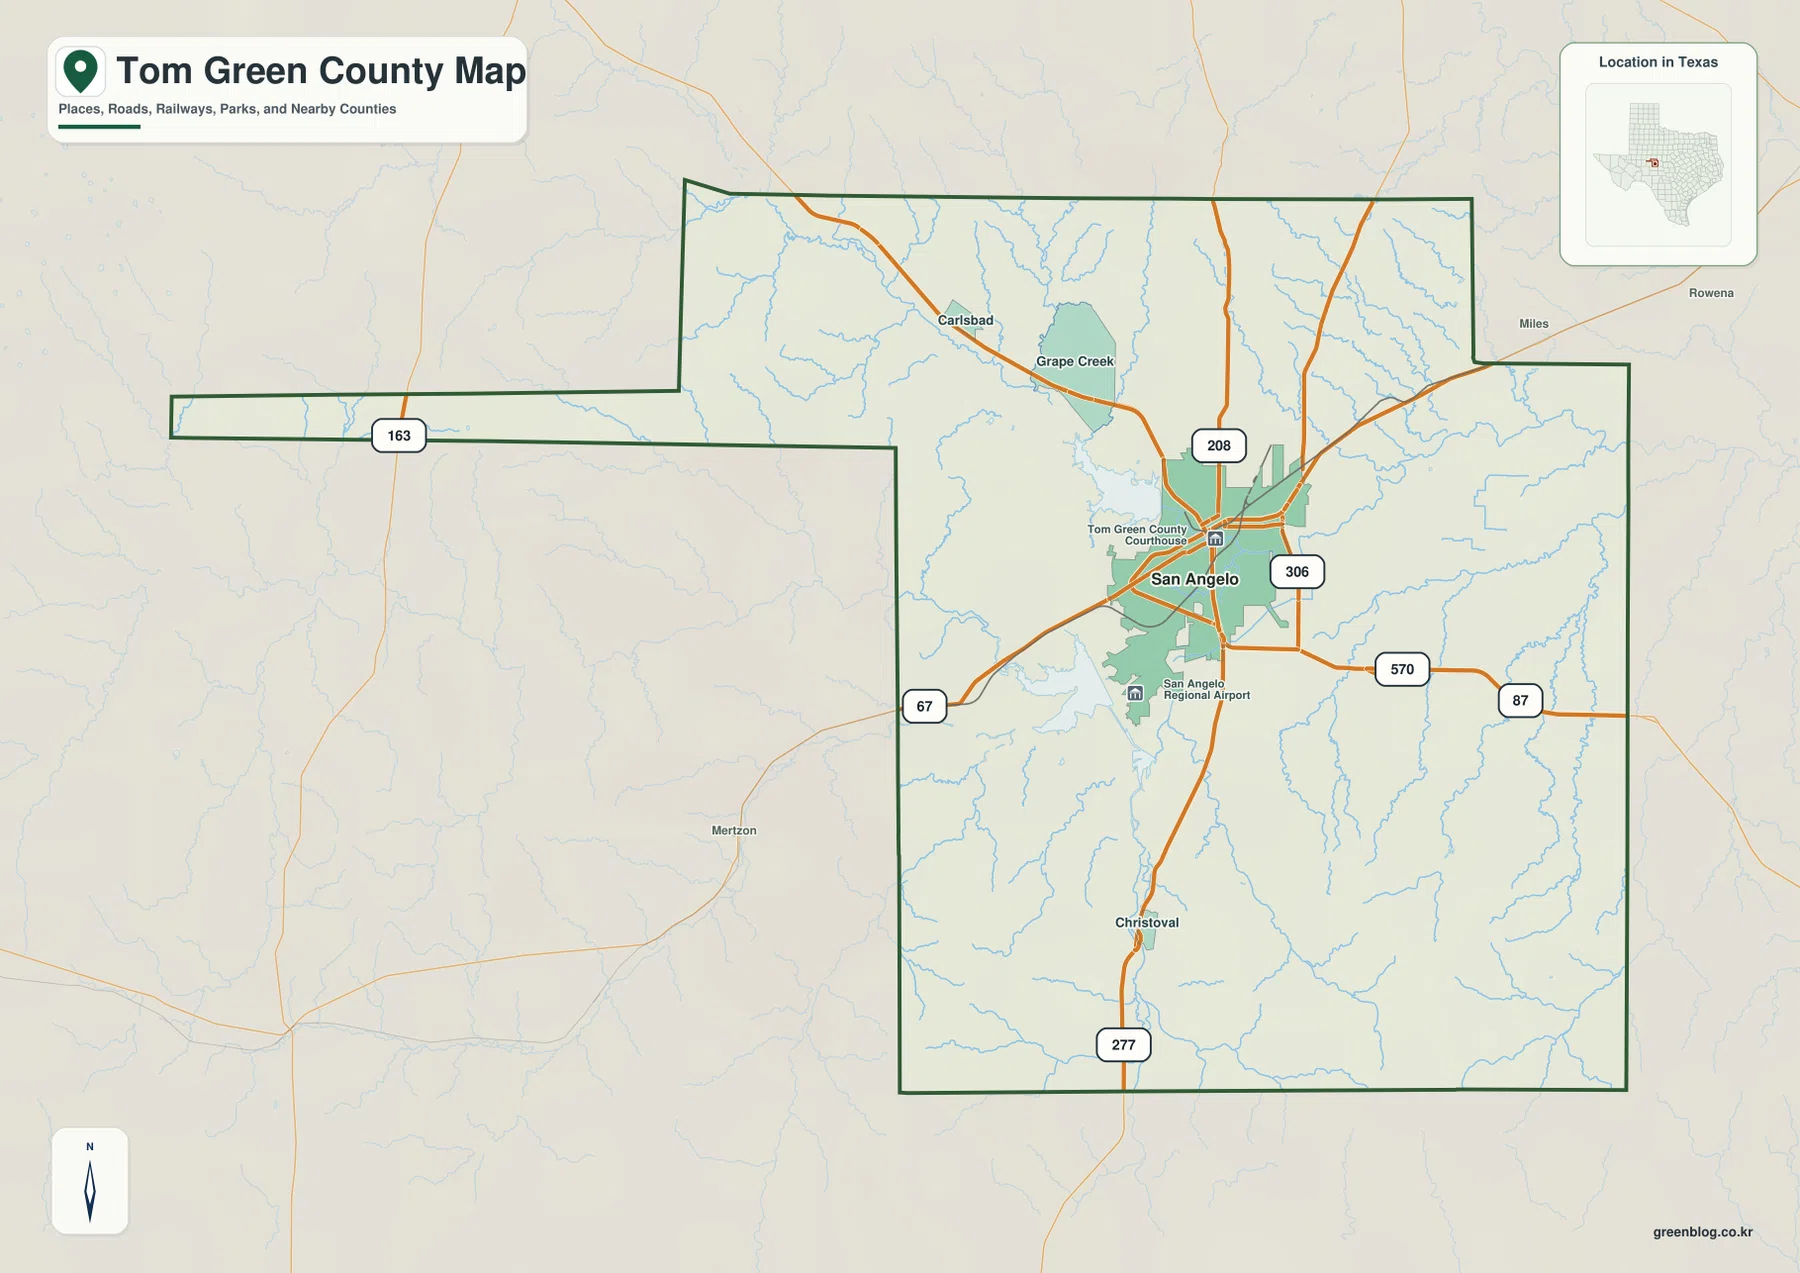
The western boundary has a distinctive long, narrow extension rather than a simple rectangular shape, and route 163 crosses that outer section. This makes the county’s footprint unusually easy to recognize. It also highlights the contrast between the dense road pattern around San Angelo and the sparse western extension, where drainage and relief become more visually prominent than settlement labels.
The ranked city view emphasizes San Angelo alone
The city map highlights just one major mapped city: San Angelo. With secondary settlement labels removed, the urban area stands out slightly north of center while streams and the main road pattern remain faintly visible around it. This view is useful when the goal is not to compare several towns, but simply to show where the county’s principal population center sits within the much larger rural landscape.
The CITY INDEX prints a map value of 99,674 for San Angelo. That figure explains why San Angelo is the only ranked major city in this graphic and should be treated as the value used by the supplied map rather than a guaranteed current population estimate. Current demographic work should rely on an official statistical source. For geographic reading, the important point is San Angelo’s strong central role within the county.
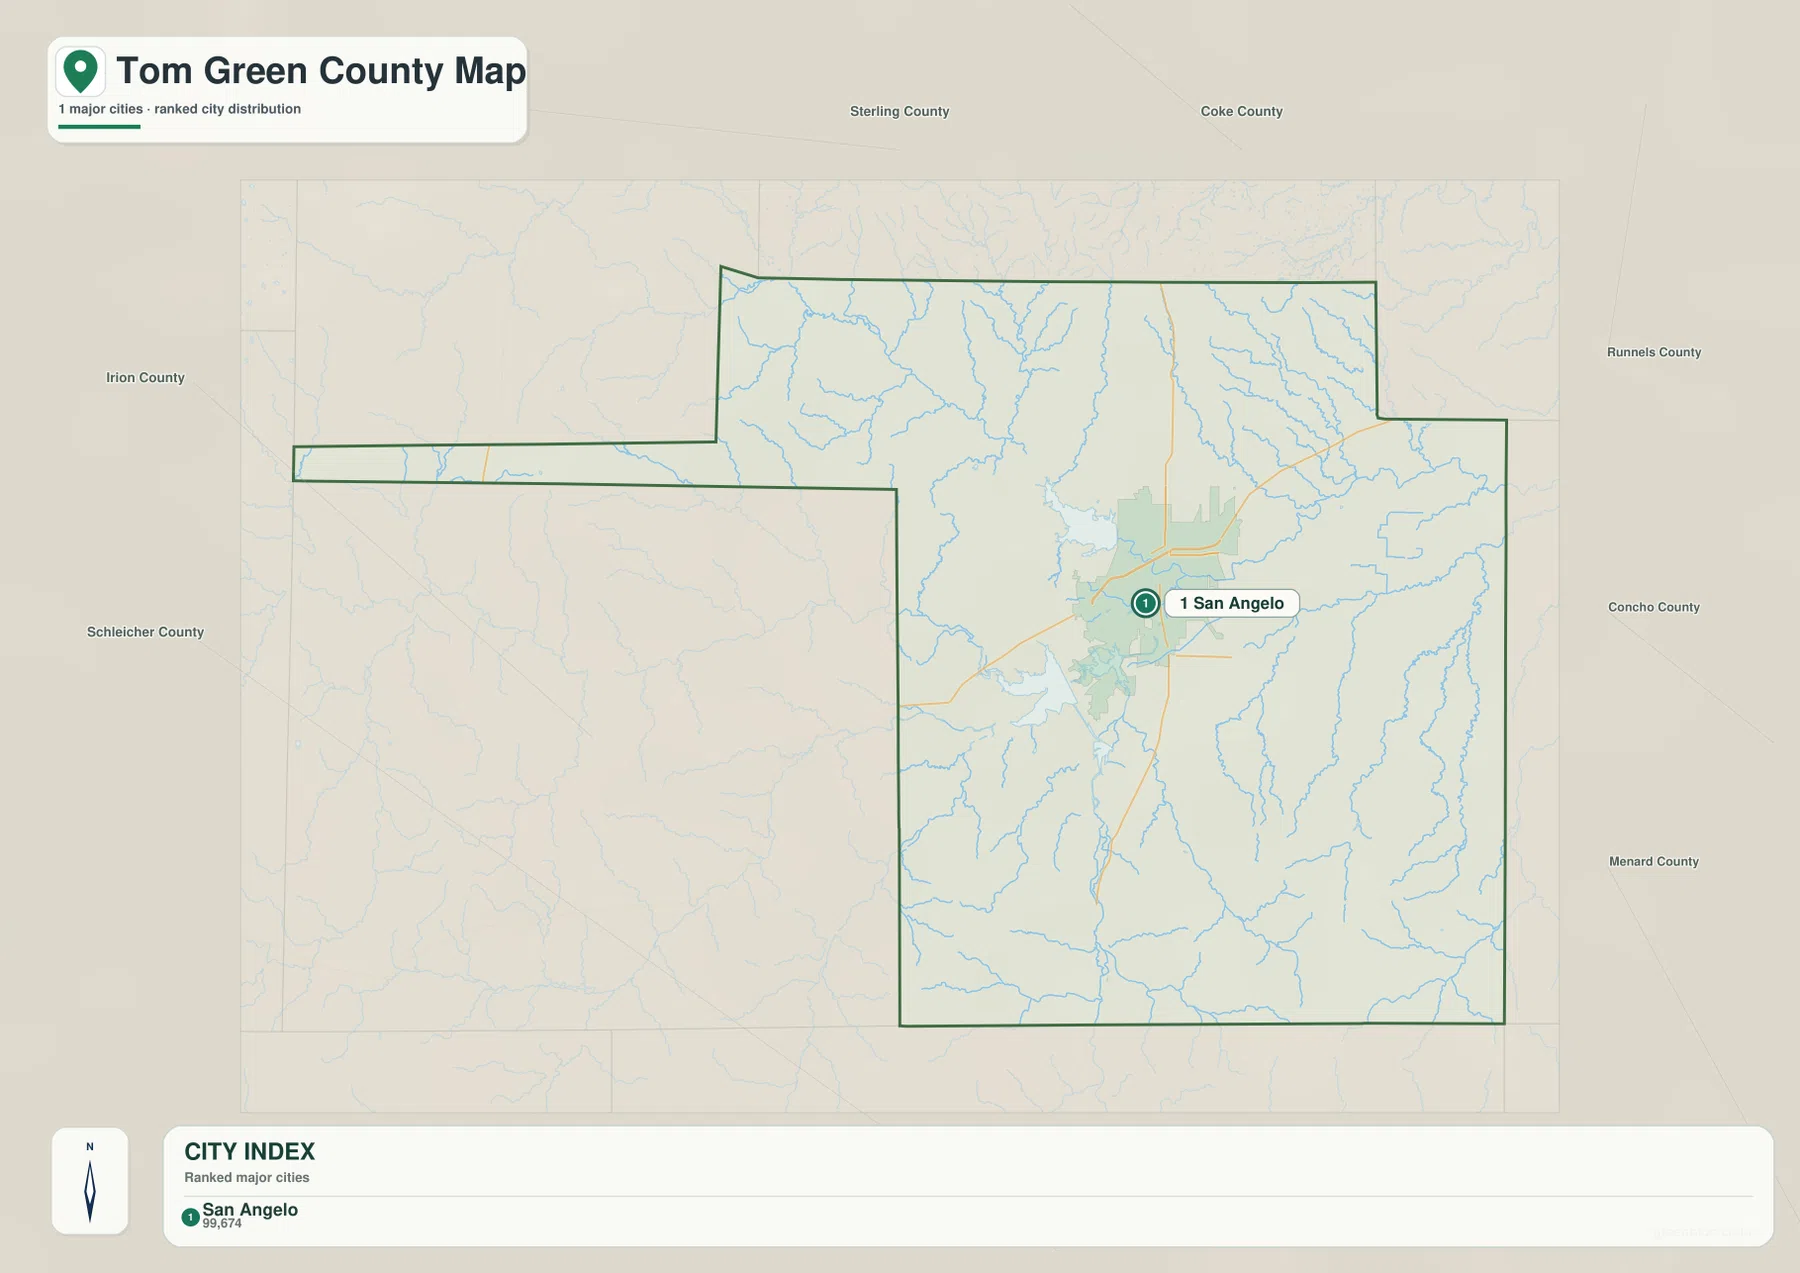
The surrounding county labels add useful regional context. Sterling and Coke counties appear to the north, Runnels and Concho counties lie to the east, Menard County is southeast, Schleicher County southwest, and Irion County west. Those positions show why San Angelo functions as the map’s main internal reference: it lies between several county directions rather than near one extreme edge.
Three Concho branches approach San Angelo from different directions
The terrain-and-water map is organized around the Concho River system. North Concho River descends from the northwest toward the San Angelo area. Middle Concho River approaches from the west, while South Concho River comes north from the southern part of the county. These three named branches provide a much clearer picture of the county’s natural layout than a generic statement that several rivers meet near the city.
Several reservoirs and lakes make the western side especially easy to navigate. O C Fisher Lake is northwest of San Angelo near the North Concho corridor, while Twin Buttes Reservoir lies southwest. Lake Nasworthy is closer to the city on the southwestern side, and Parkview Lake appears as a smaller nearby reference. Their separation helps distinguish the northwestern and southwestern water systems rather than treating all of the reservoirs as one group.
East of San Angelo, the Concho River becomes the main large channel. Minnie Creek and Dry Lipan Creek are labeled farther south and east, and Lipan Creek follows another prominent drainage line near the eastern side. Pecan Creek appears in the southern interior near the South Concho system. The simplest way to organize the map is to follow the three Concho branches toward San Angelo first, then trace the Concho River and smaller creeks outward to the east and south.
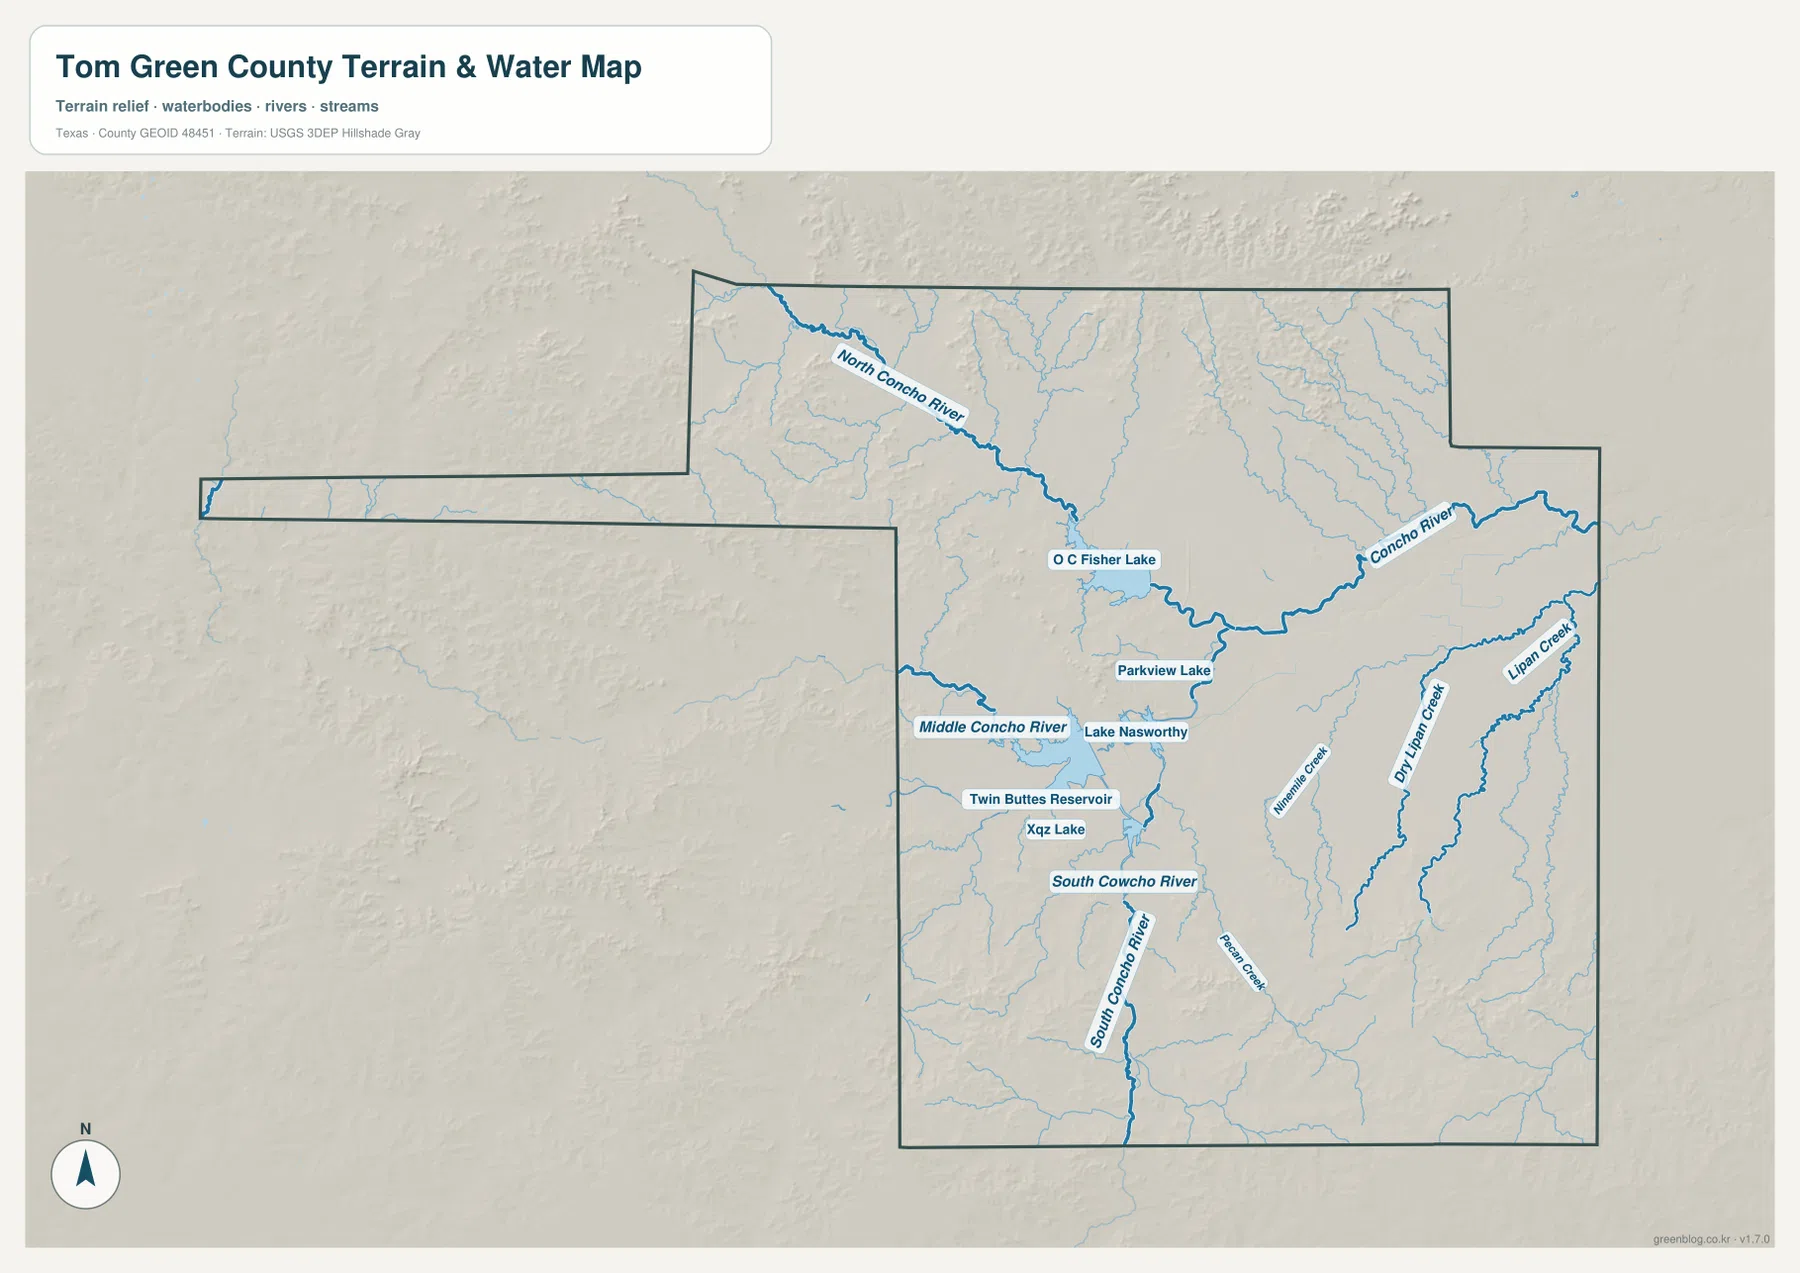
This layer is intended for geographic water and terrain reference rather than flood-risk analysis, parcel boundaries, navigation, or reservoir-management decisions. Its main value here is to show how the Concho branches approach San Angelo, where the named reservoirs sit relative to the city, and which lower valleys continue eastward across the county.
High western and southern hills surround a lower Concho corridor
The elevation map reports an actual range of about 504 to 793 meters and a mean elevation of 632 meters. The darkest brown high ground is concentrated in the western extension and northwest, with additional rugged high terrain across the south and southeast. Broad green lowlands dominate the east-central and northeastern parts of the county, especially along the Concho River corridor.
The high ground is not one continuous plateau. North Concho River cuts through the northwestern hills in a lower green valley, and the South Concho system creates similar low corridors in the southern interior. Around San Angelo, the relief becomes gentler and more open before dropping toward the east. Farther south and southeast, ridge blocks rise again, so the county cannot be described as a simple west-to-east slope.
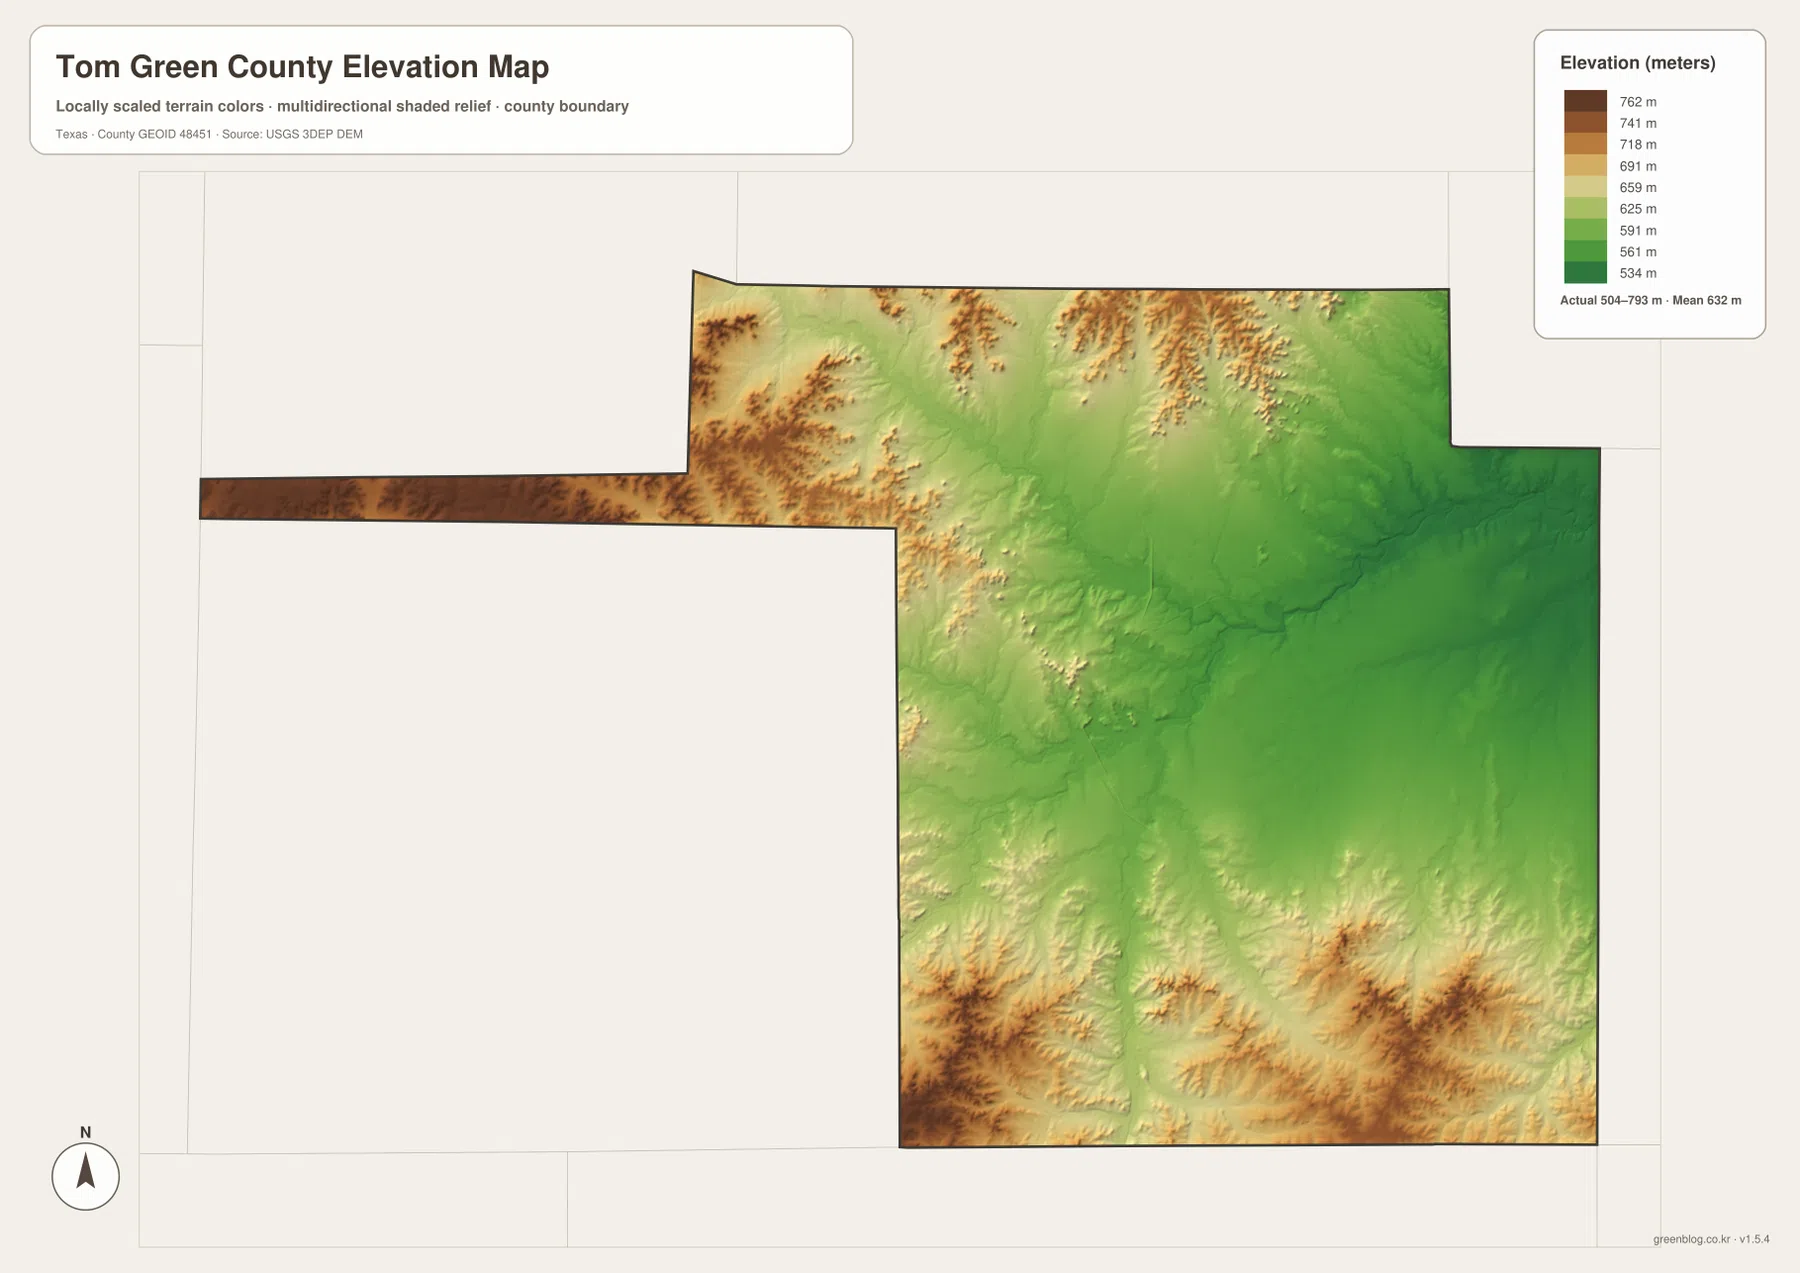
This countywide elevation surface is designed for broad terrain comparison rather than parcel surveying, engineering, or construction design. It is useful for seeing why the Carlsbad and Grape Creek side looks more rugged, where the Concho valleys cut through the hills, and how the lower San Angelo-to-east corridor contrasts with the higher southern terrain. Exact site elevation should be checked with detailed source data or a local survey.
Choose the view by whether roads, river branches, or relief matters most
Use the county reference map when San Angelo, Carlsbad, Grape Creek, Christoval, major road labels, and the unusual western county extension need to appear together. The ranked city map is cleaner when San Angelo alone should stand out. The terrain-and-water view is the best place to compare the three Concho branches, the Concho River, and the reservoirs, while the elevation map makes the western hills and lower central-eastern corridor easiest to understand.
The downloadable ZIP contains four separate high-resolution A3 JPG files for Tom Green County: county reference, ranked city, terrain and water, and elevation. You can inspect the lighter WebP versions in the article first and then use the larger JPG files for printing, classroom material, presentations, or an editable local-reference document.
Frequently Asked Questions
Where is Christoval compared with San Angelo?
Christoval is south of San Angelo on the supplied reference map. Route 277 and the South Concho River both provide useful references in the same general direction.
Where are O C Fisher Lake and Twin Buttes Reservoir?
O C Fisher Lake is northwest of San Angelo, while Twin Buttes Reservoir is southwest. Lake Nasworthy is also southwest of the city and lies closer to the urban area.
What elevation range is shown for Tom Green County?
The supplied elevation map states an actual range of about 504 to 793 meters and a mean elevation of 632 meters. Western, northwestern, and southern terrain is higher, while the central and eastern Concho corridor is lower.
Map File Information
The ZIP contains the four Tom Green County maps in high-resolution A3 JPG format.
- Included Versions: County reference, ranked city, terrain and water, elevation
- Included Files: 4 A3 JPG maps
Related Maps
Sources and data references
Roads, settlement locations, and the Tom Green County boundary can be cross-checked with the U.S. Census Bureau TIGER/Line Shapefiles. The Concho River branches, reservoirs, lakes, and named creeks can be checked against USGS National Hydrography, while terrain height data are available through the USGS 3D Elevation Program. City index values, route references, named waters, and the 504–793 meter elevation range described above are based on the Tom Green County maps supplied in this package.
Green Map creates custom-edited map images using open geographic data sources such as geoBoundaries, Natural Earth, OpenStreetMap, and government open data.
These maps are edited visual materials, not raw data files, and are provided for education, documents, presentations, and graphic reference.