Polk County has two obvious settlement centers inside a county that is still mostly forest and farmland. Forest covers 56.78% of the supplied 2025 classification, agriculture 22.85%, and developed land 12.76%. The largest built clusters sit in the west-central and east-central parts of the county, matching the Cedartown and Rockmart contexts, while broad wooded areas remain around them. This Polk County Georgia Land Cover Map is useful for comparing those two centers with the rural land between and beyond them.
The page includes four WebP views for land cover, vegetation, impervious surface, and the 1985–2025 endpoint comparison. Four original 2480 × 1754 JPG maps are available in one ZIP for county profiles, forest-farm comparisons, local planning context, lessons, and presentations.
Table of Contents
Cedartown and Rockmart create two separate hard-surface centers
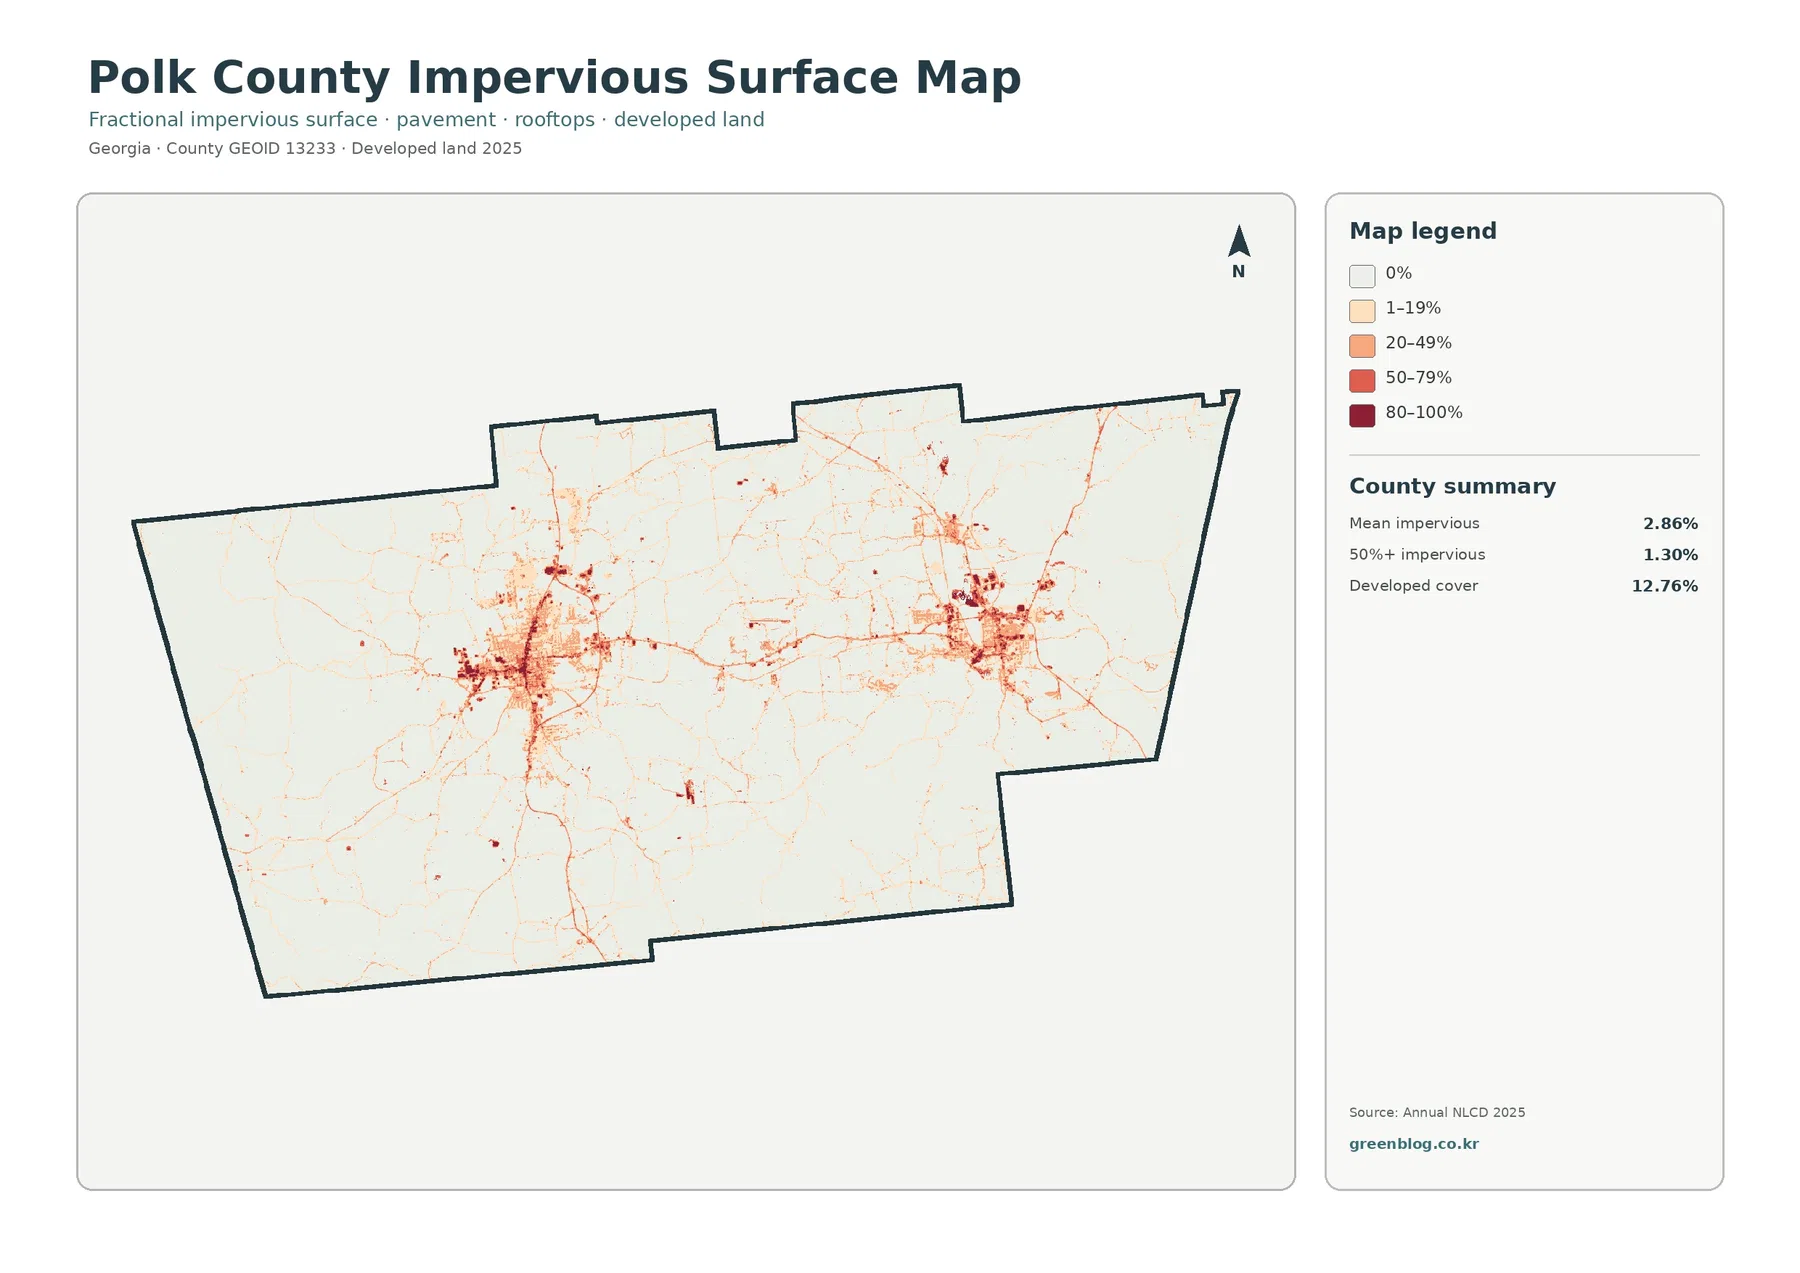
The strongest western cluster lies in the west-central county. Polk County’s official history identifies Cedartown as the county seat, giving that built concentration a clear local reference. Darker impervious cells form a compact core, while lower values spread outward through neighborhoods, commercial areas, and road-shaped lines.
A second large concentration sits farther east. Georgia’s Department of Community Affairs plans Polk County together with Cedartown, Rockmart, and Aragon, and the eastern built cluster matches the Rockmart side of the county. The two centers are connected by developed traces, but large stretches of forest, agriculture, and lower-density land remain between them.
Mean impervious cover is 2.86%, and 1.30% of Polk County reaches 50% impervious surface or higher. Developed land covers 12.76%, a broader class that can include lawns, trees, yards, and exposed soil. The impervious layer isolates roofs, pavement, parking areas, and other hard surfaces.
Forest covers more than half the county despite the two urban clusters
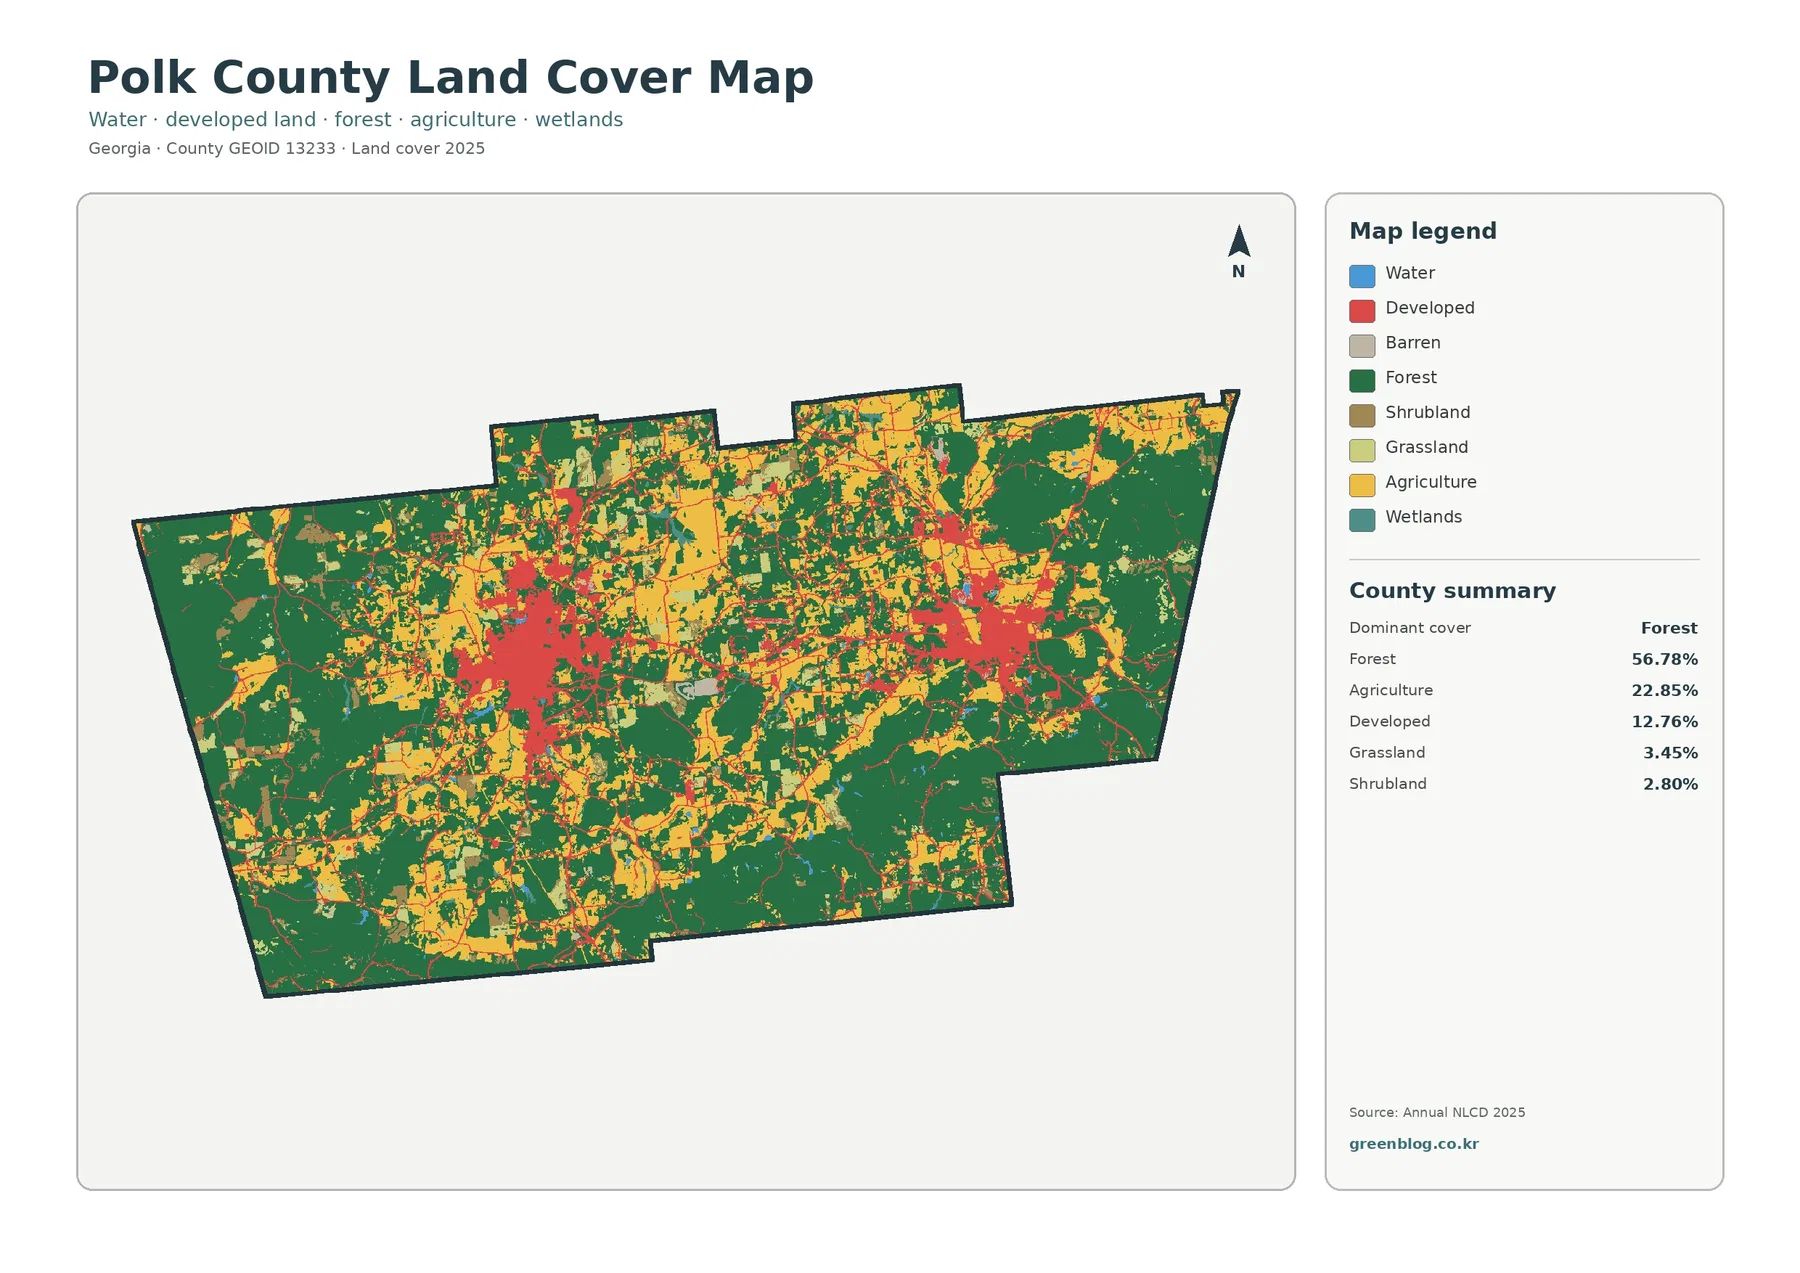
Forest is the largest class at 56.78%. Broad dark-green areas occupy the southwest, southeast, eastern edge, and parts of the northwest. Woodland also threads through the central part of the county, breaking up farms and developed areas instead of disappearing near the main settlements.
Agriculture accounts for 22.85%. Yellow farm blocks are common through the north and center and appear throughout the west and south as well. The county therefore reads as a forest-and-farm landscape with settlement centers inserted into it, not as two cities surrounded by empty undeveloped land.
Grassland adds 3.45%, shrubland 2.80%, wetlands 0.62%, and open water 0.39%. The small water and wetland shares mean that the countywide pattern is driven much more by woodland, working land, and development than by major lakes or broad wetland systems.
The vegetation view makes the rural land between the cities easier to see
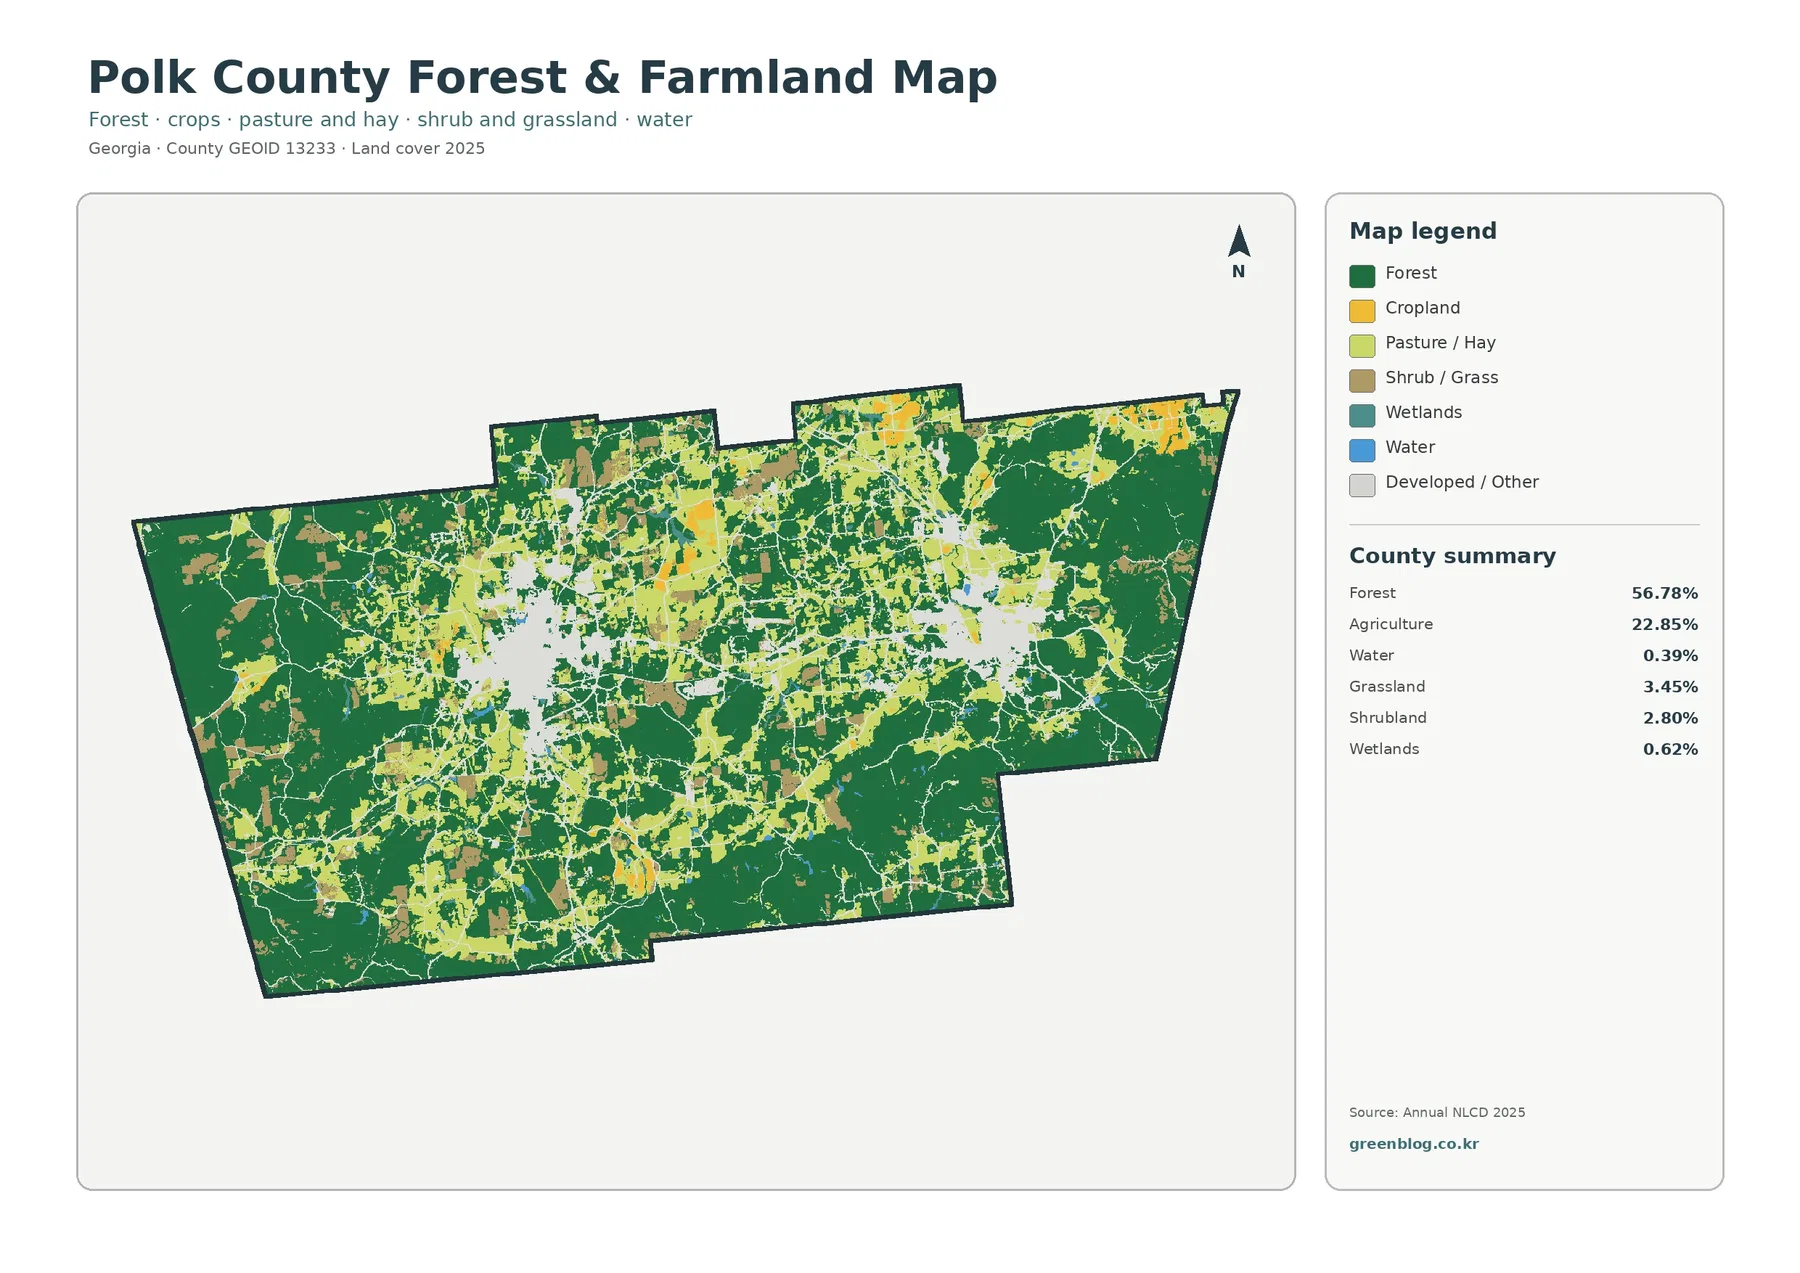
With developed cover muted, the southwest and southeast become broad wooded areas, while the north and center show more agricultural openings. Cedartown and Rockmart remain visible as lighter gaps, but the rural land around them becomes the dominant feature. Forest and farms repeatedly meet along irregular edges rather than forming separate east and west zones.
Polk County Extension provides soil and water testing, feed and forage testing, and practical agriculture and natural-resource education. That county-specific service context supports the importance of farming and land management without allowing a yellow cell to be labeled as a particular crop or farm.
Grassland and shrubland also matter when interpreting open land. Pale green and brown areas are not automatically cropland, and the raster cannot identify pasture ownership or specific farm boundaries. County-scale comparison is appropriate; farm-level analysis needs more detailed agricultural or parcel data.
Road-shaped development links the centers without turning the county into one continuous city
The impervious view contains east-west hard-surface traces between the two major centers and north-south lines through the settlement areas. The raster itself contains no route names or traffic counts, so exact roads require Census or local transportation data.
Smaller hard-surface points occur in the north and along rural roads, but they do not approach the size of the two primary clusters. The large white areas on the impervious map show how quickly the county returns to low-pavement forest and farm land outside settlement centers.
The 1985–2025 comparison extends far beyond places classified to developed
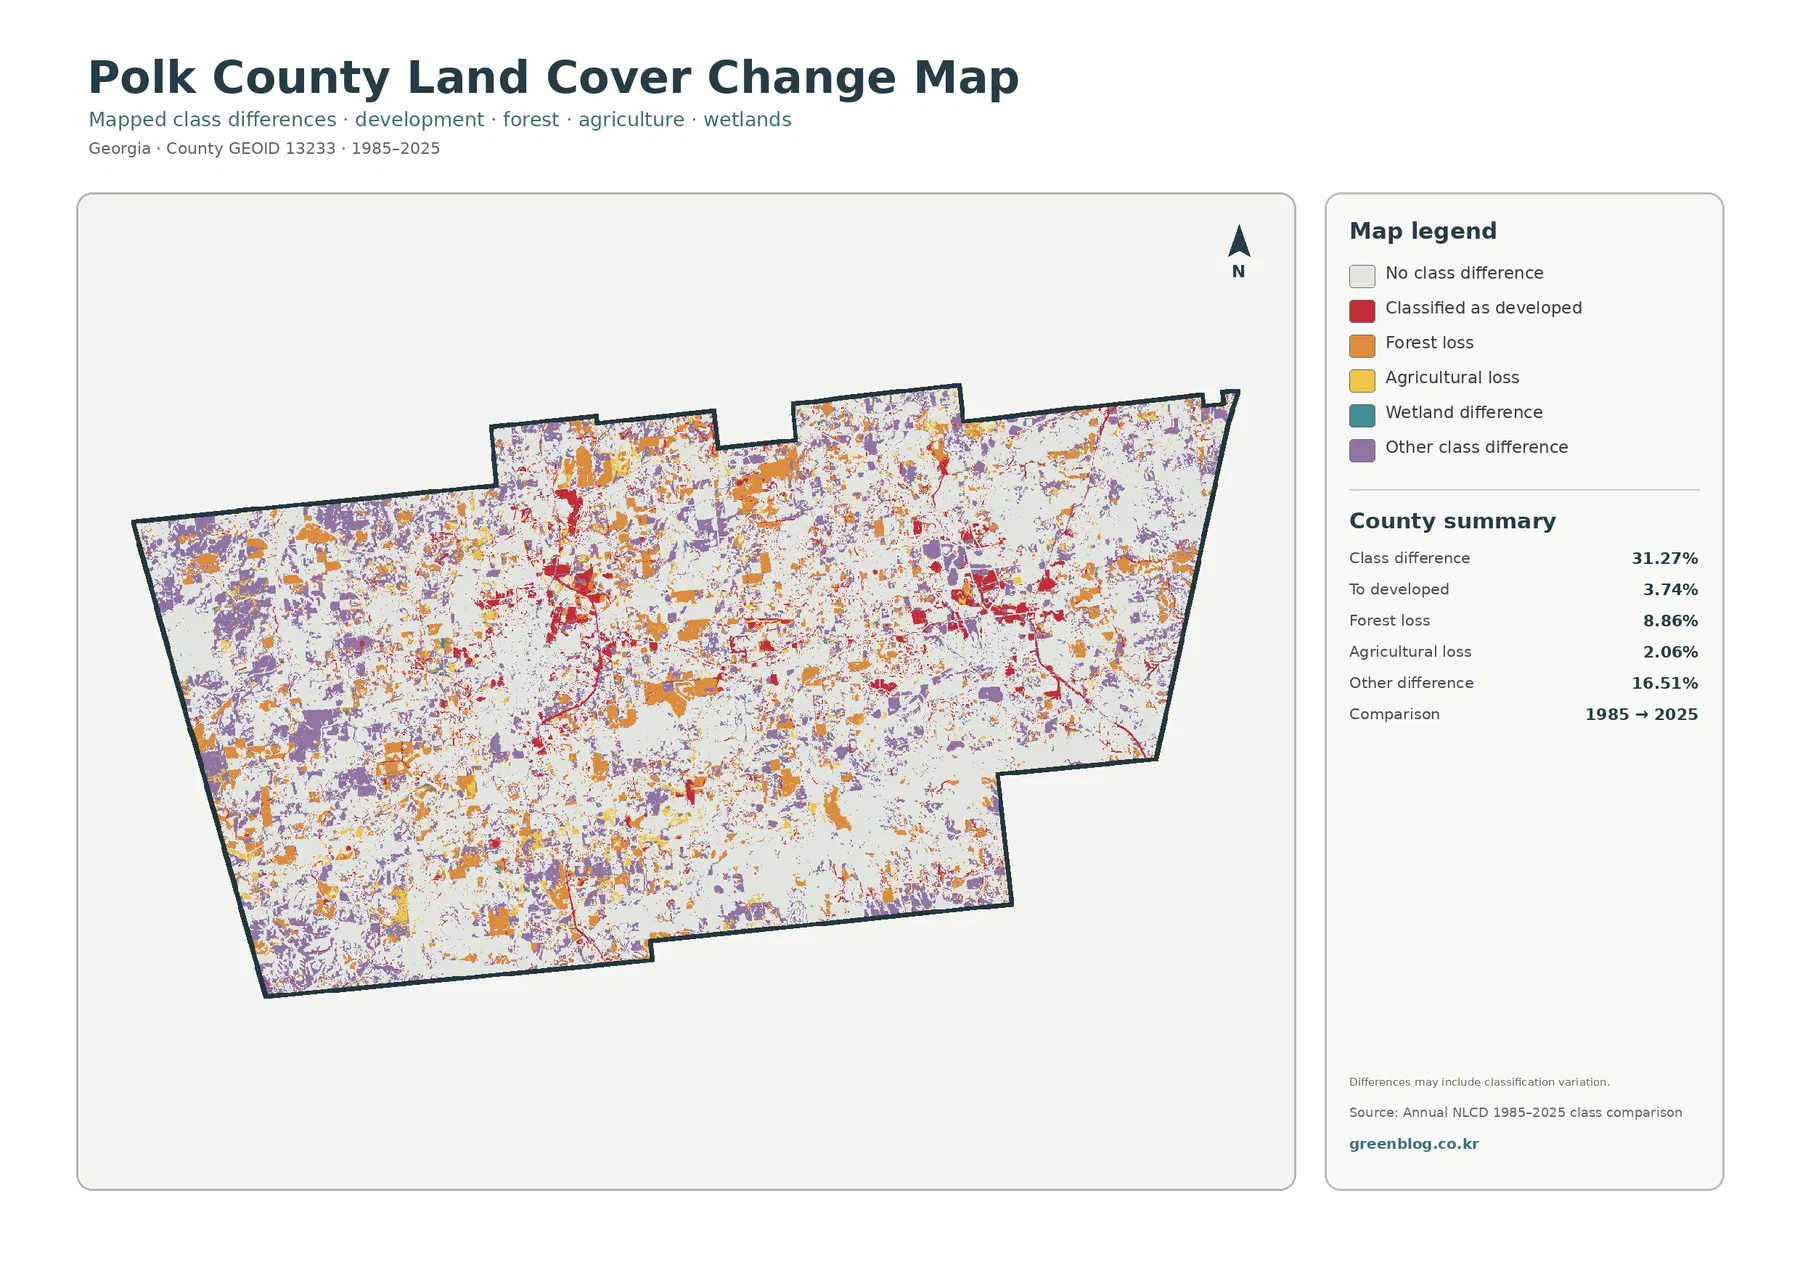
The total endpoint class difference is 31.27%. That figure counts raster cells assigned different categories in 1985 and 2025. It is not an urbanization rate and does not mean that 31.27% of Polk County was damaged or permanently converted.
The printed summary lists 16.51% other difference, 8.86% forest loss, 3.74% classified to developed, and 2.06% agricultural loss. Developed-change red is most visible around Cedartown, Rockmart, and several road-oriented areas. Forest-loss orange and other-difference purple spread much more widely across the north, west, south, and east.
Wetland difference appears in the legend without a separately printed percentage. The missing rate should not be reconstructed by subtracting the listed categories from 31.27%. Classification variation may also contribute to some patches, so intermediate imagery and local forestry, farming, or development records are needed before assigning a cause.
Aragon and smaller settlements sit inside the same forest-and-farm setting
The joint comprehensive plan includes Aragon with Cedartown and Rockmart. Smaller developed pockets in the northern part of the maps fit a county with additional towns and unincorporated settlements beyond the two main centers. They are surrounded by much larger areas of forest and working land.
Thirty-meter land cover is not a zoning, ownership, or parcel map
Annual NLCD assigns one predominant class to each 30-meter cell, so field edges, tree rows, roads, mixed yards, ponds, and farm structures can look simplified.
Green does not identify forest ownership or protected land, yellow does not define a farm parcel, and red does not show Cedartown or Rockmart zoning. Property, permitting, municipal-boundary, and legal land-use questions require current county, city, or Census records.
Choosing the four JPG maps for Polk County
Use the 2025 countywide map first when the goal is to show the forest majority, agricultural land, and the two main settlement centers together. The vegetation view is better for farm-versus-forest comparisons. Choose the impervious map for Cedartown, Rockmart, and road-oriented hard surfaces, and reserve the endpoint map for a separate discussion of 1985–2025 classification differences.
Each JPG measures 2480 × 1754 pixels and suits reports, lessons, and presentations. Test a proof before large-format printing because the package does not mark them as A3 high-resolution assets.
Frequently Asked Questions
What is the dominant land-cover class in Polk County?
Forest is the largest class in the supplied 2025 summary at 56.78%. Agriculture follows at 22.85% and developed land at 12.76%, with Cedartown and Rockmart forming two clearly separated built centers.
Why is developed land 12.76% while mean impervious cover is only 2.86%?
Developed classes can include lawns, trees, yards, and exposed ground around buildings and roads. The impervious layer measures harder surfaces such as roofs, pavement, and parking areas.
Does the 31.27% endpoint difference measure urban growth or forest clearing?
No. It counts all cells with different class labels in 1985 and 2025. The summary separately lists 3.74% classified to developed, 8.86% forest loss, 2.06% agricultural loss, and 16.51% other difference.
Sources and Reference Data
- MRLC Annual NLCD CONUS Collection 1.2 – official MRLC release confirming the 2025 product year and 1985–2025 coverage for the conterminous United States
- USGS Annual NLCD Land Cover Classification – definitions for forest, agriculture, developed land, and related classes
- U.S. Census Bureau TIGER/Line Shapefiles – authoritative county, place, and transportation layers for comparison
- Polk County – History of Polk County – official county background identifying Cedartown as the county seat
- Georgia DCA – Polk County Joint Comprehensive Plan – official planning context for Polk County, Aragon, Cedartown, and Rockmart
- UGA Extension – Polk County Agriculture & Natural Resources – local soil, water, feed, forage, and agriculture resources
Map File Information
The ZIP contains four original JPG maps for comparing Polk County's 56.78% forest cover, 22.85% agriculture, Cedartown and Rockmart development, impervious surfaces, and 1985–2025 class differences.
- Included Files: Four JPG land-cover maps described on this page
- File Type: ZIP containing four JPG maps
- Intended Use: Printing, education, presentations, and map-based projects
Related Maps
- Appling County Georgia Land Cover Map
- Atkinson County Georgia Land Cover Map
- Bacon County Georgia Land Cover Map
Green Map creates custom-edited map images using open geographic data sources such as geoBoundaries, Natural Earth, OpenStreetMap, and government open data. These maps are edited visual materials, not raw data files, and are provided for education, documents, presentations, and graphic reference.