California is a useful example of why a statewide average can hide more than it reveals. The state contains some of the densest urban counties in the United States, yet it also includes enormous mountain, desert, forest, and rural areas with very few residents per square mile. The supplied map set separates those patterns into five different questions: where people are concentrated at census-tract scale, which cities are largest, which counties contain the most people, which counties grew or declined between 2010 and 2020, and how county density differs from county population.
Four of the maps use the 2024 American Community Survey 5-year estimates with 2024 Census geography. The change map is different: it compares 2010 and 2020 decennial Census population counts. Keeping those time frames separate matters. A 2010–2020 change percentage is not a 2024 growth estimate, and a large population circle is not automatically a sign of high density.
Table of Contents
The tract map shows where California is actually crowded
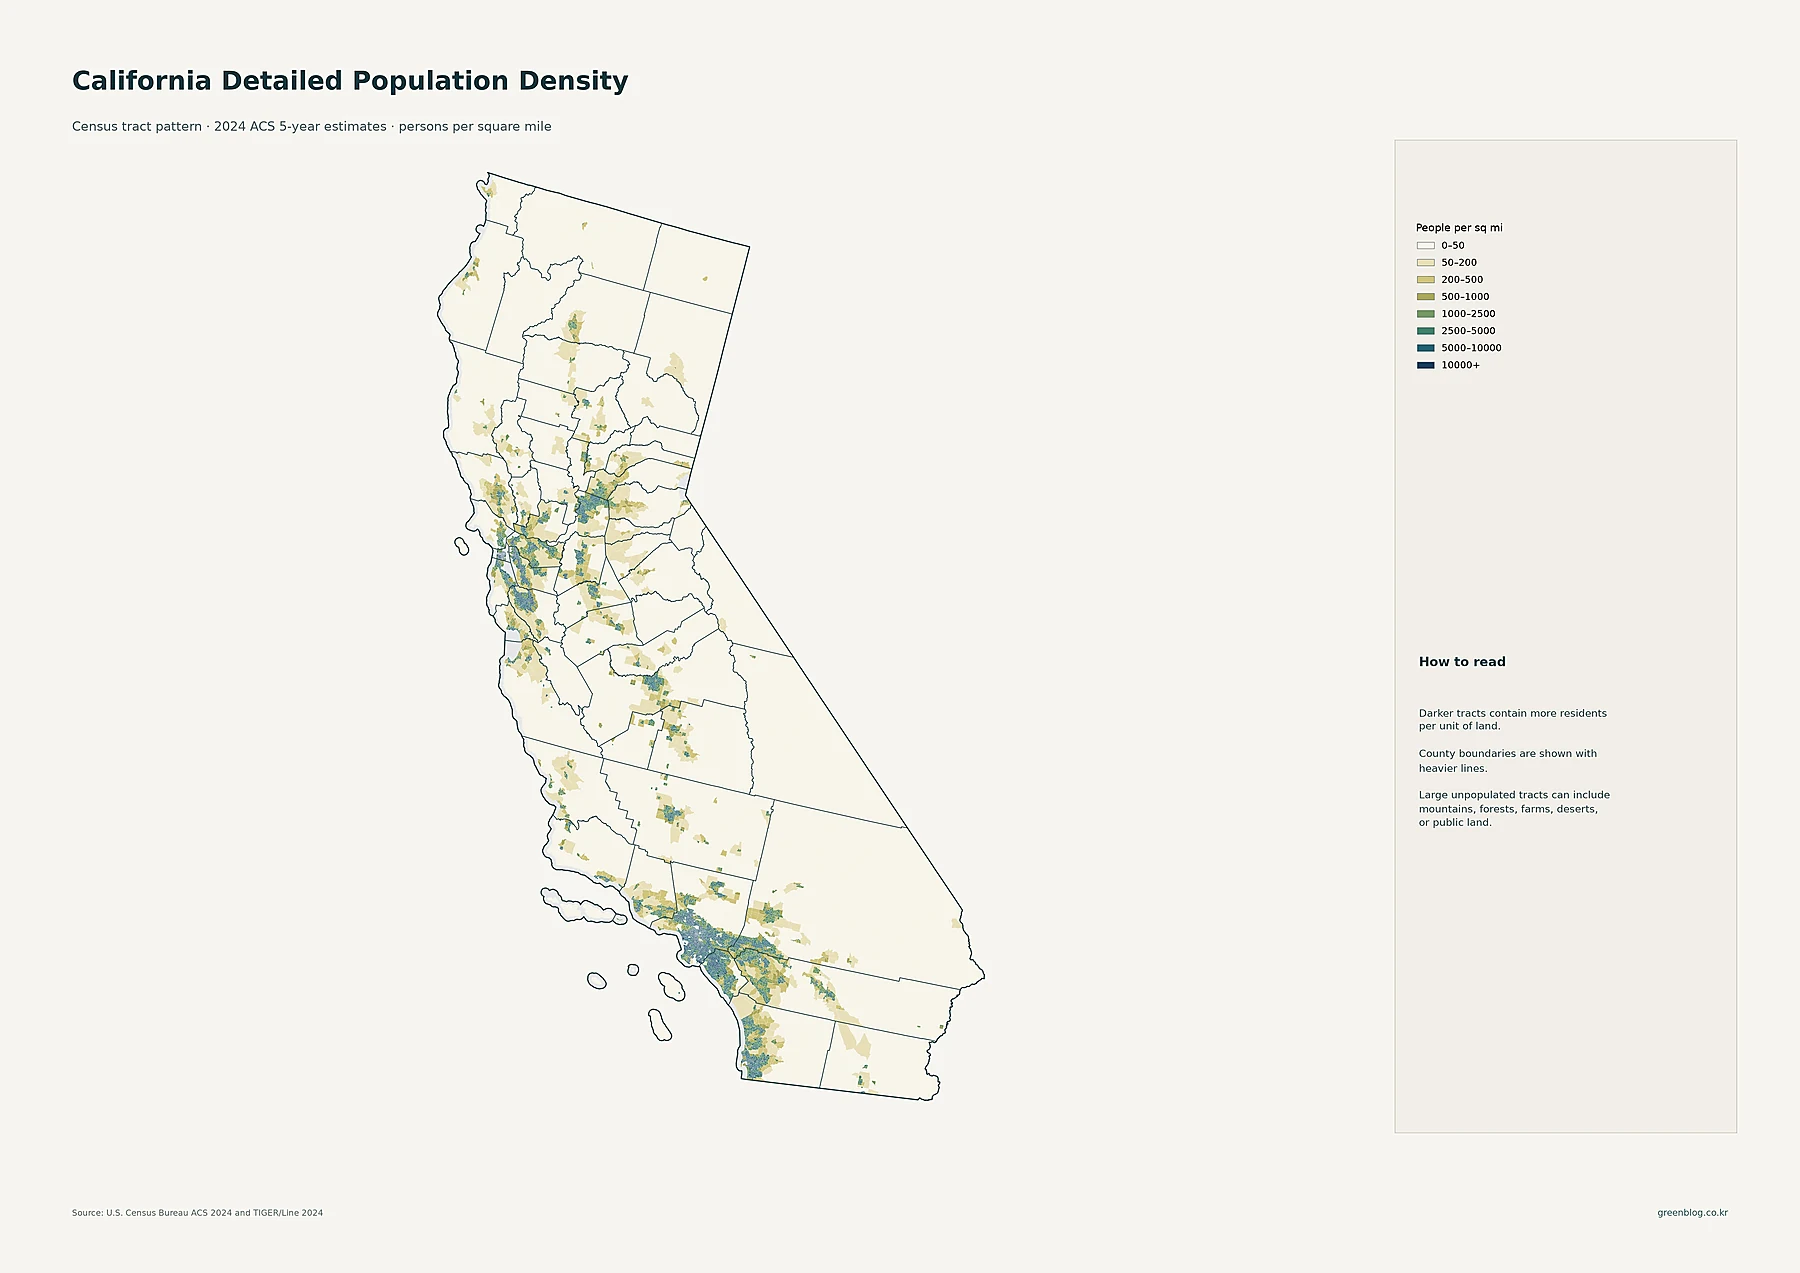
At census-tract scale, California’s settlement pattern becomes much sharper than it appears on a county map. The darkest concentration covers the Los Angeles and Orange County urban area, with another strong cluster around San Diego. In Northern California, dense tracts line the San Francisco Peninsula, East Bay, and South Bay around San Jose. Sacramento also stands out clearly, while smaller but visible concentrations follow Central Valley cities such as Stockton, Modesto, Fresno, and Bakersfield.
Large portions of the far north, the Sierra Nevada, the eastern side of the state, and the southeastern desert remain in the lightest density classes. That does not mean every light tract is literally empty. The map itself notes that large, lightly populated tracts can contain mountains, forests, deserts, or public land. In other words, the detailed map is best read as a measure of residents per unit of land, not as a simple yes-or-no map of settlement.
City circles answer a different question than the density shading
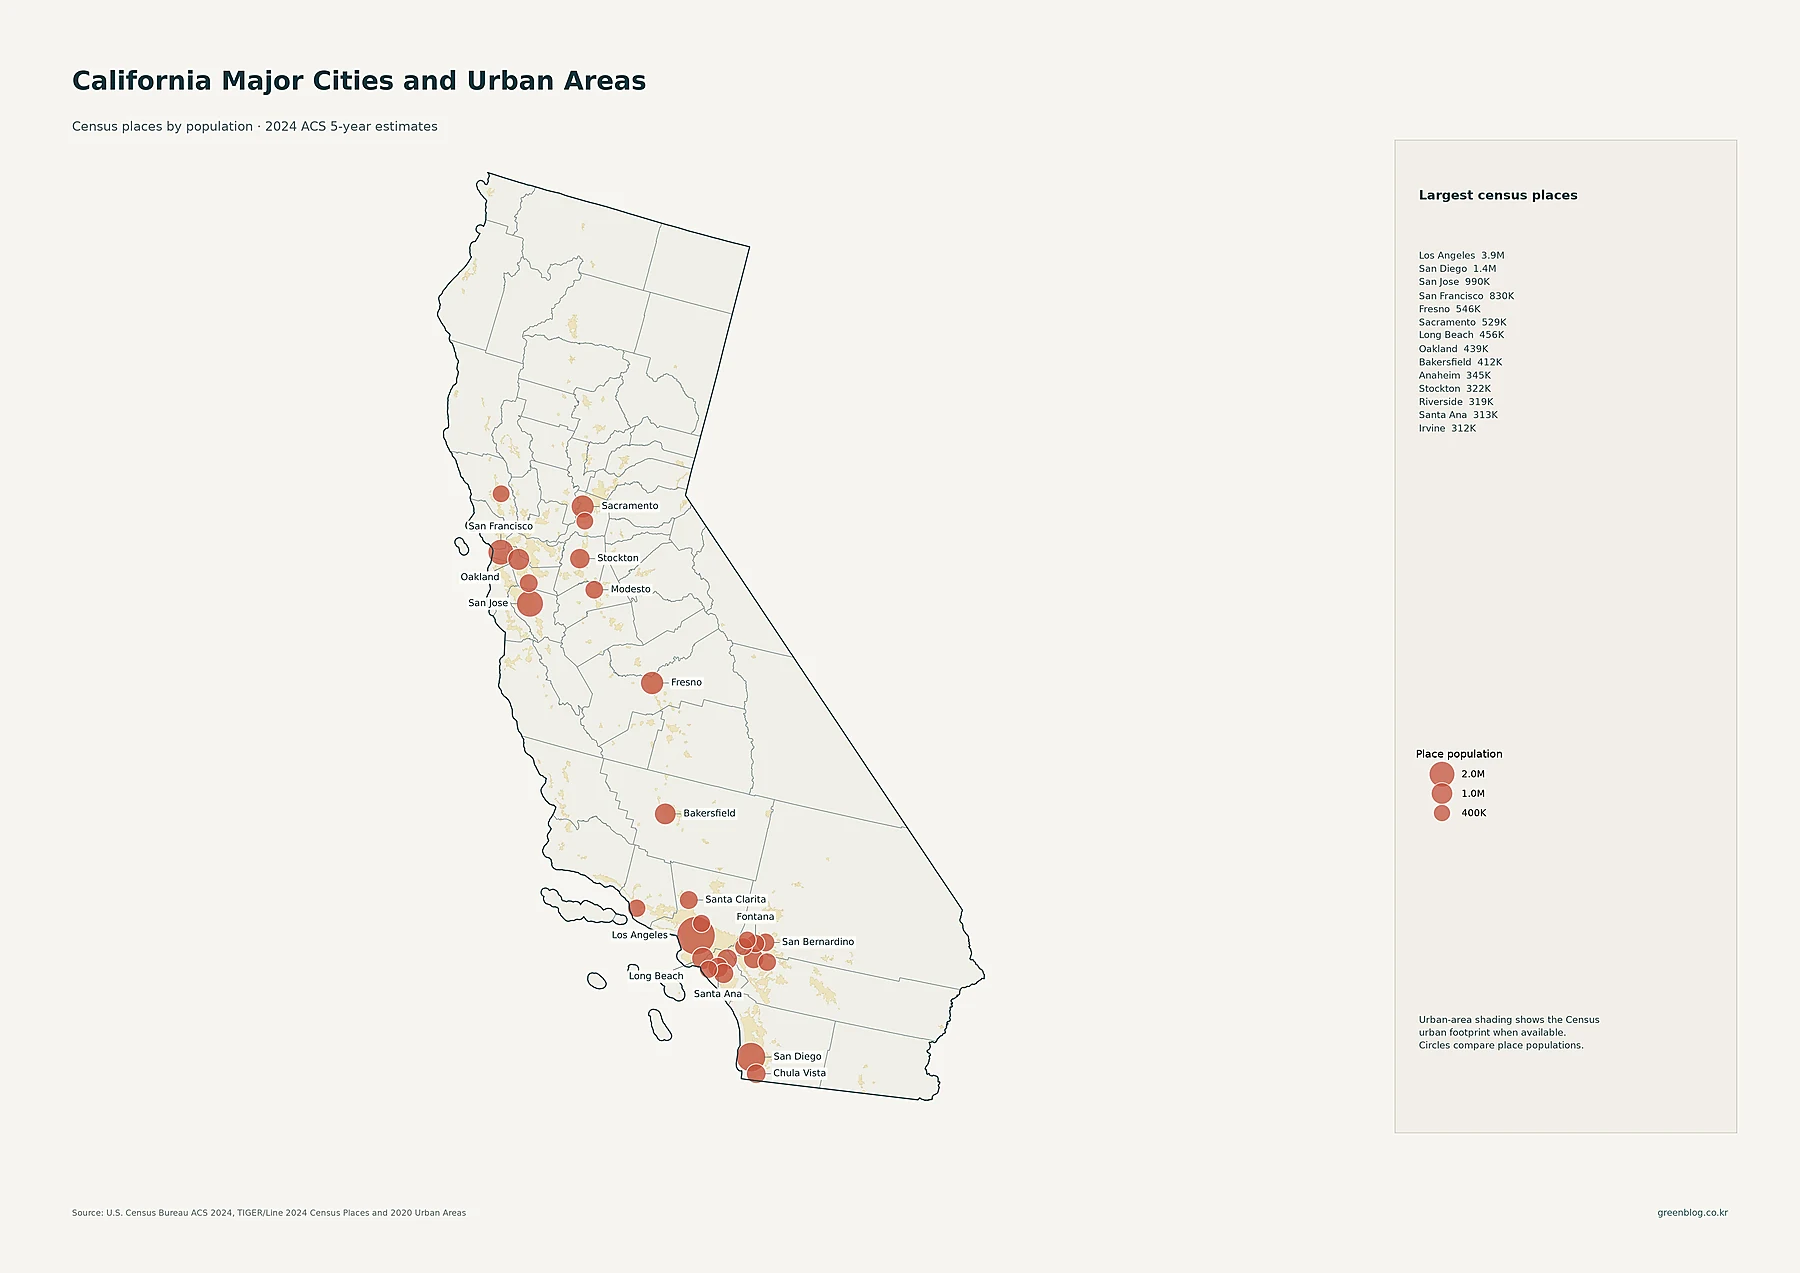
The major-cities map uses proportional circles for census-place population. Los Angeles is the largest place in the supplied data at 3,857,263 residents. San Diego follows at 1,389,526, then San Jose at 990,138 and San Francisco at 830,235. Fresno and Sacramento are each above half a million, while Long Beach, Oakland, Bakersfield, Anaheim, Stockton, Riverside, Santa Ana, and Irvine form the next tier visible in the legend and map.
The pale background urban footprint comes from 2020 Census urban-area geography, while the circles compare 2024 ACS place populations. That distinction prevents a common mistake: a city circle is not the population of the whole metropolitan area. The Los Angeles urbanized region contains many separate incorporated places, and the Bay Area likewise contains San Francisco, Oakland, San Jose, Fremont, and many smaller places. The map is therefore most useful for seeing the relationship between major municipal populations and the broader urban footprint around them.
County totals reveal the scale of Southern California
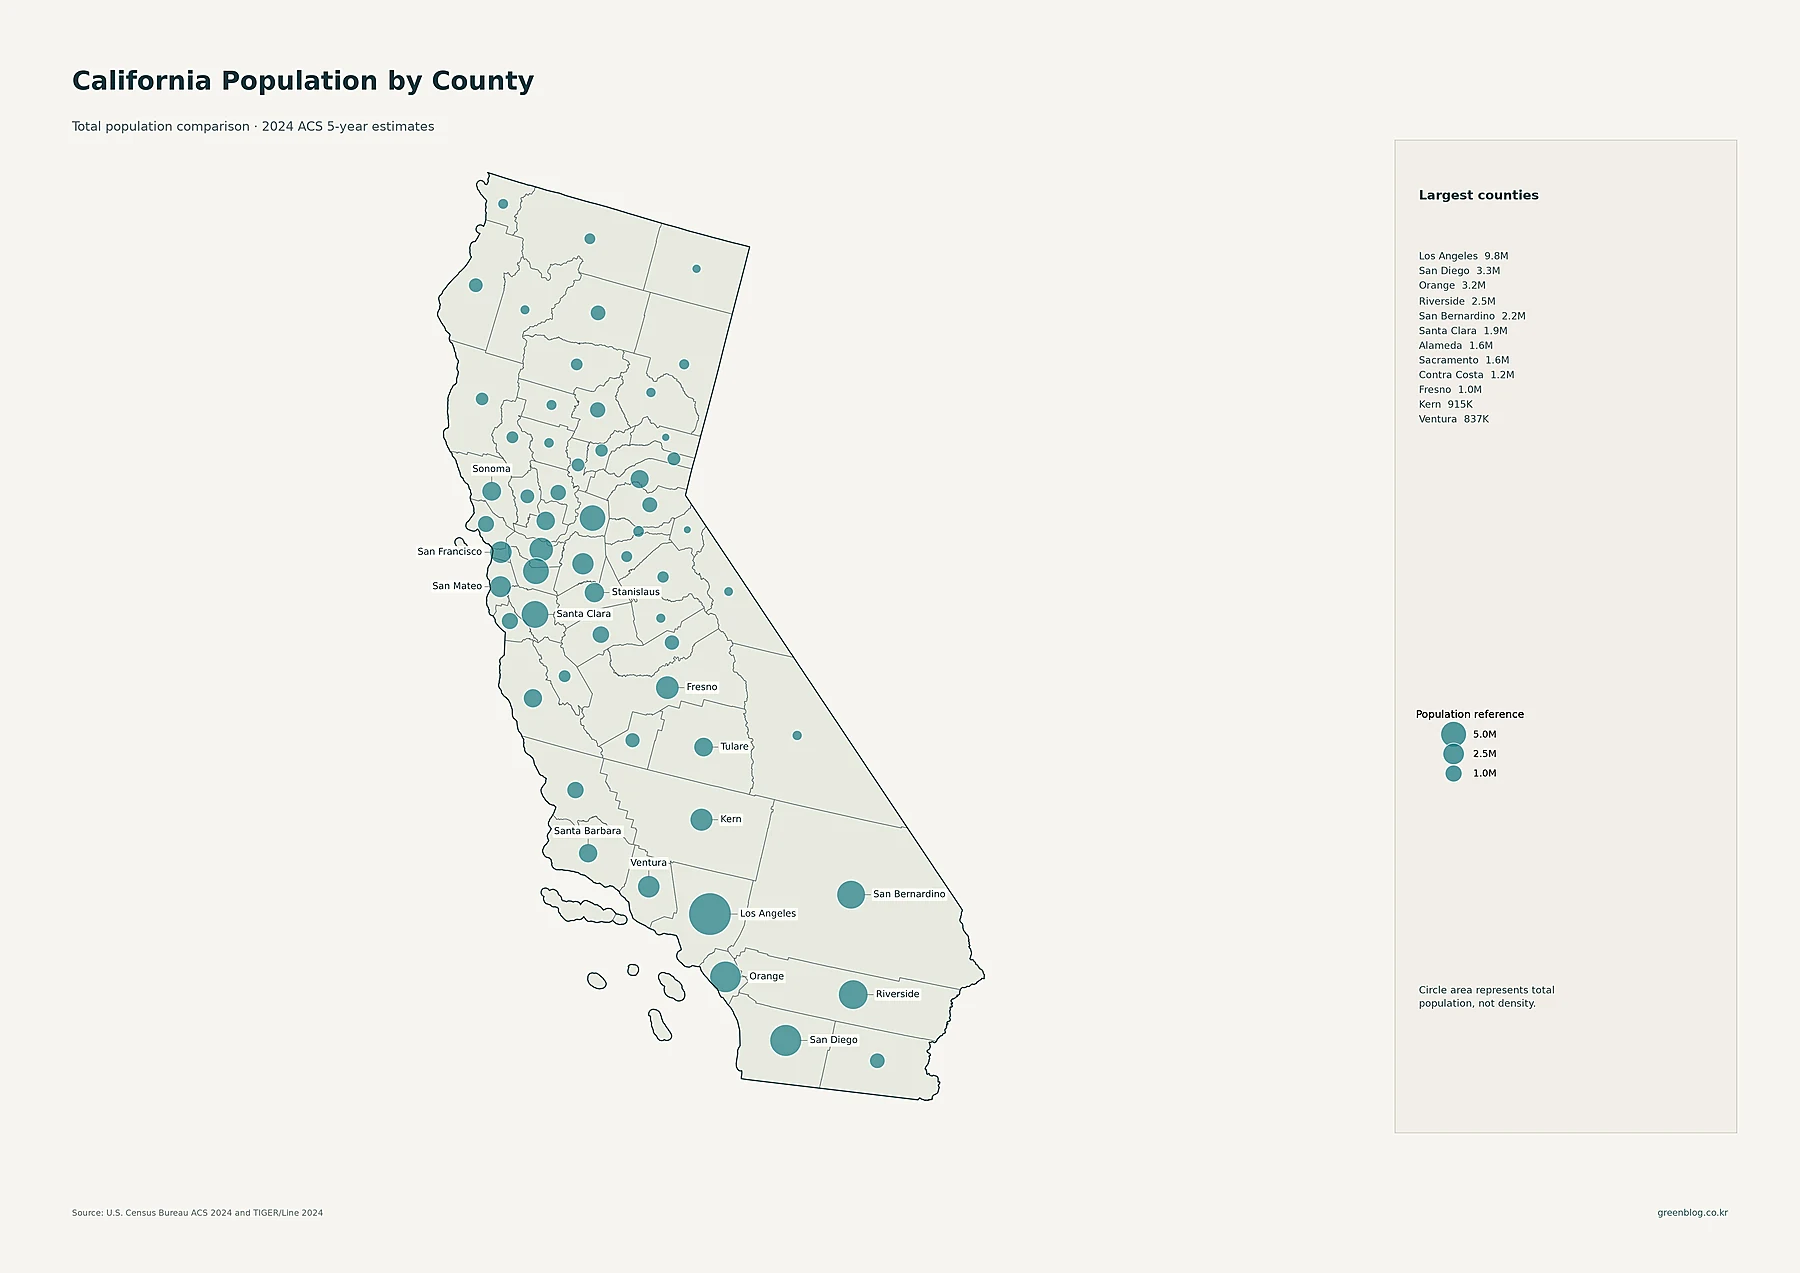
County population is dominated by Southern California. Los Angeles County is estimated at 9,808,667 residents in the supplied 2024 ACS dataset. San Diego County has 3,288,774 and Orange County 3,165,820. Riverside reaches 2,478,600 and San Bernardino 2,197,104. In the north, Santa Clara, Alameda, Sacramento, and Contra Costa each exceed one million residents, while Fresno and Kern anchor major population centers in the Central Valley.
| County | 2024 ACS population | People per sq. mi. |
|---|---|---|
| Los Angeles | 9,808,667 | 2,415.8 |
| San Diego | 3,288,774 | 781.1 |
| Orange | 3,165,820 | 3,992.9 |
| Riverside | 2,478,600 | 343.8 |
| San Bernardino | 2,197,104 | 109.5 |
| Santa Clara | 1,902,047 | 1,473.2 |
| Alameda | 1,649,473 | 2,236.7 |
| Sacramento | 1,594,006 | 1,651.3 |
The table makes the difference between population and density concrete. San Bernardino County has more than 2.1 million residents, yet its large land area produces an average density of only about 109.5 people per square mile. San Francisco County, by contrast, has about 830,000 residents but an average density of roughly 17,783.8 per square mile. A county can be very populous without being uniformly dense, and a smaller county can rank near the top in density.
The 2010–2020 map separates percentage growth from population size
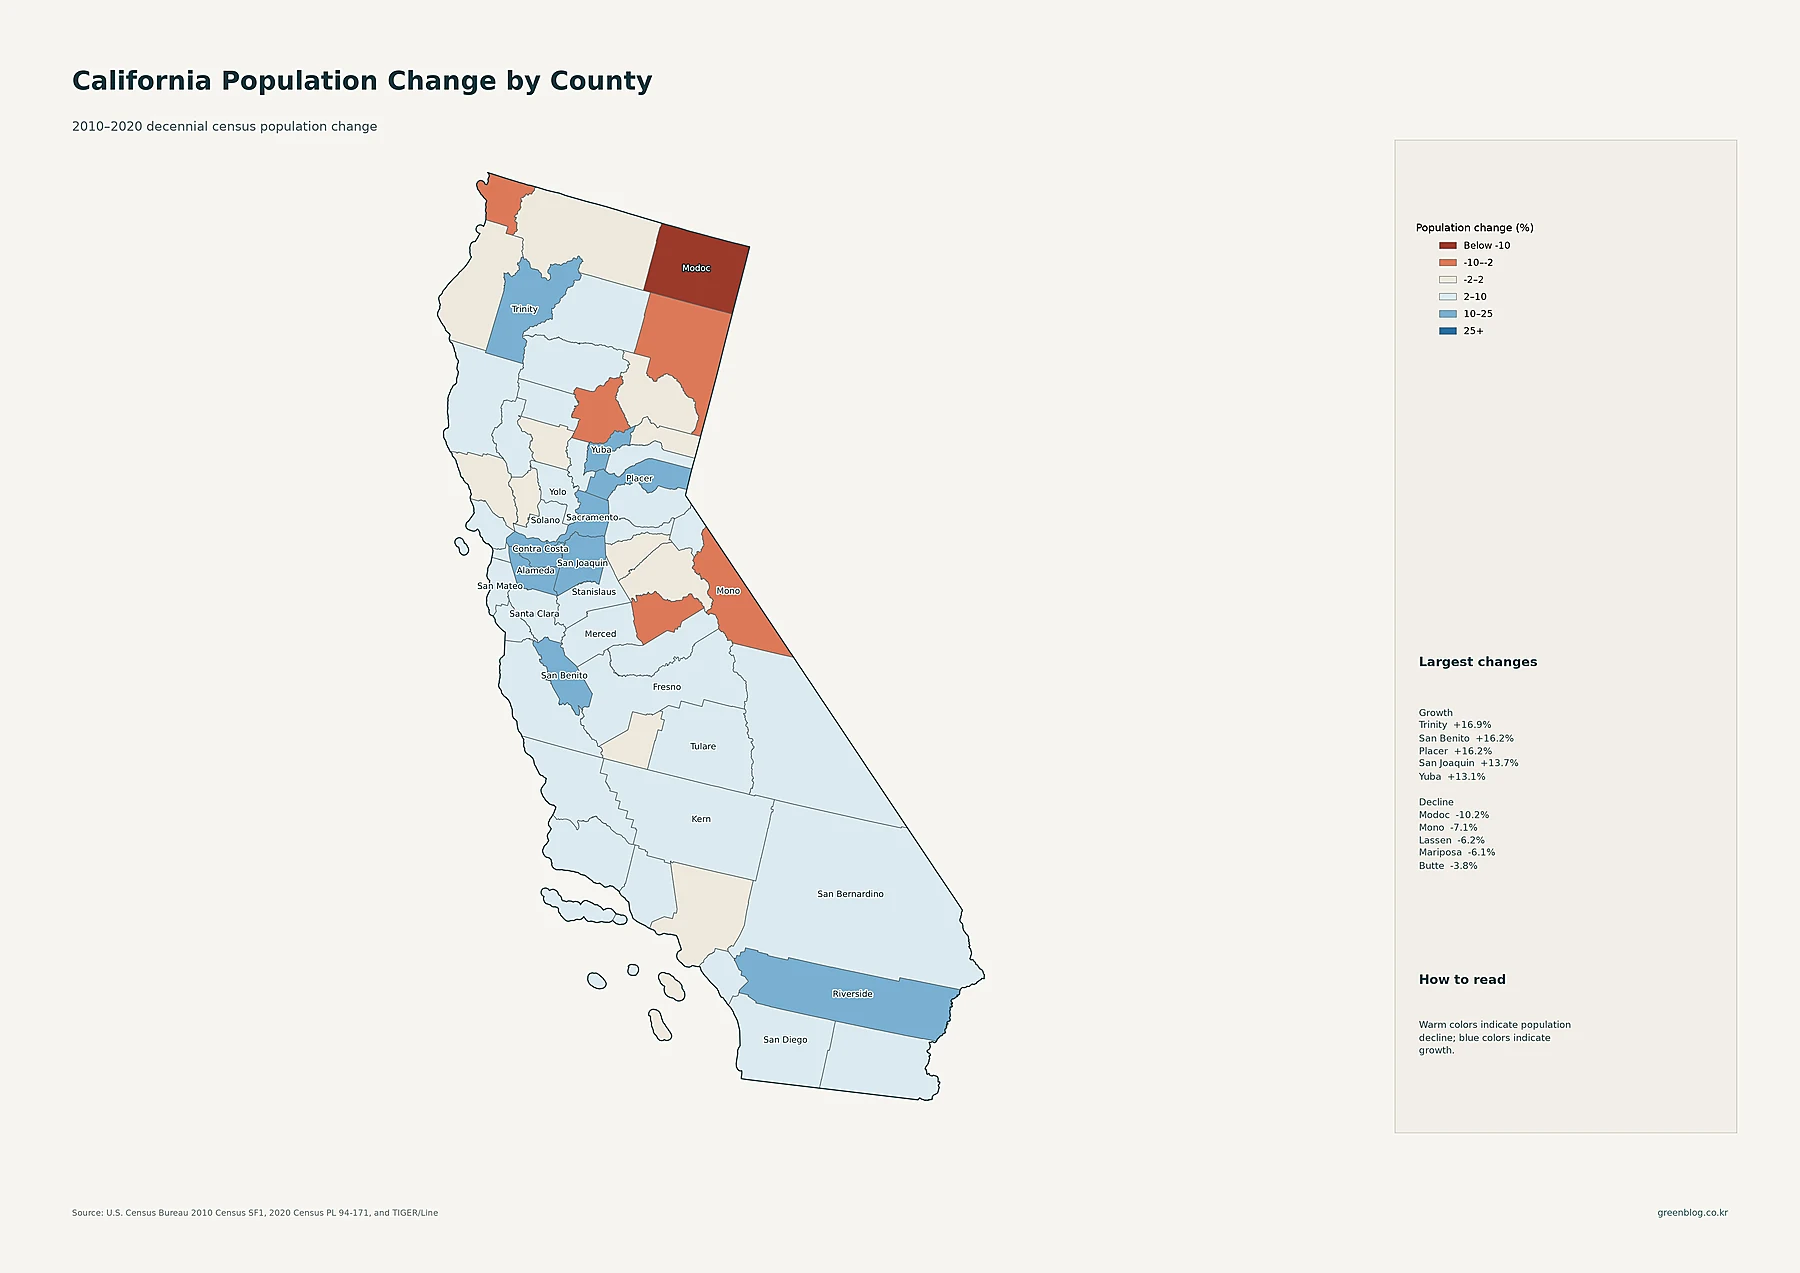
The decade-change map shows a mixed pattern rather than a single statewide direction. The largest percentage gains listed on the map are Trinity at +16.9%, San Benito at +16.2%, Placer at +16.2%, San Joaquin at +13.7%, and Yuba at +13.1%. The largest declines are Modoc at -10.2%, Mono at -7.1%, Lassen at -6.2%, Mariposa at -6.1%, and Butte at -3.8%.
Percent change needs context. Trinity rose from 13,786 people in 2010 to 16,112 in 2020, so a relatively modest numerical gain produces a large percentage increase. Riverside County grew by about 10.4% from a much larger starting population. Those are two different forms of growth. The map does not establish why any county gained or lost residents, so it should be used to identify where change occurred rather than to infer economic, housing, or migration causes without separate evidence.
County density highlights compact urban counties and broad low-density interiors
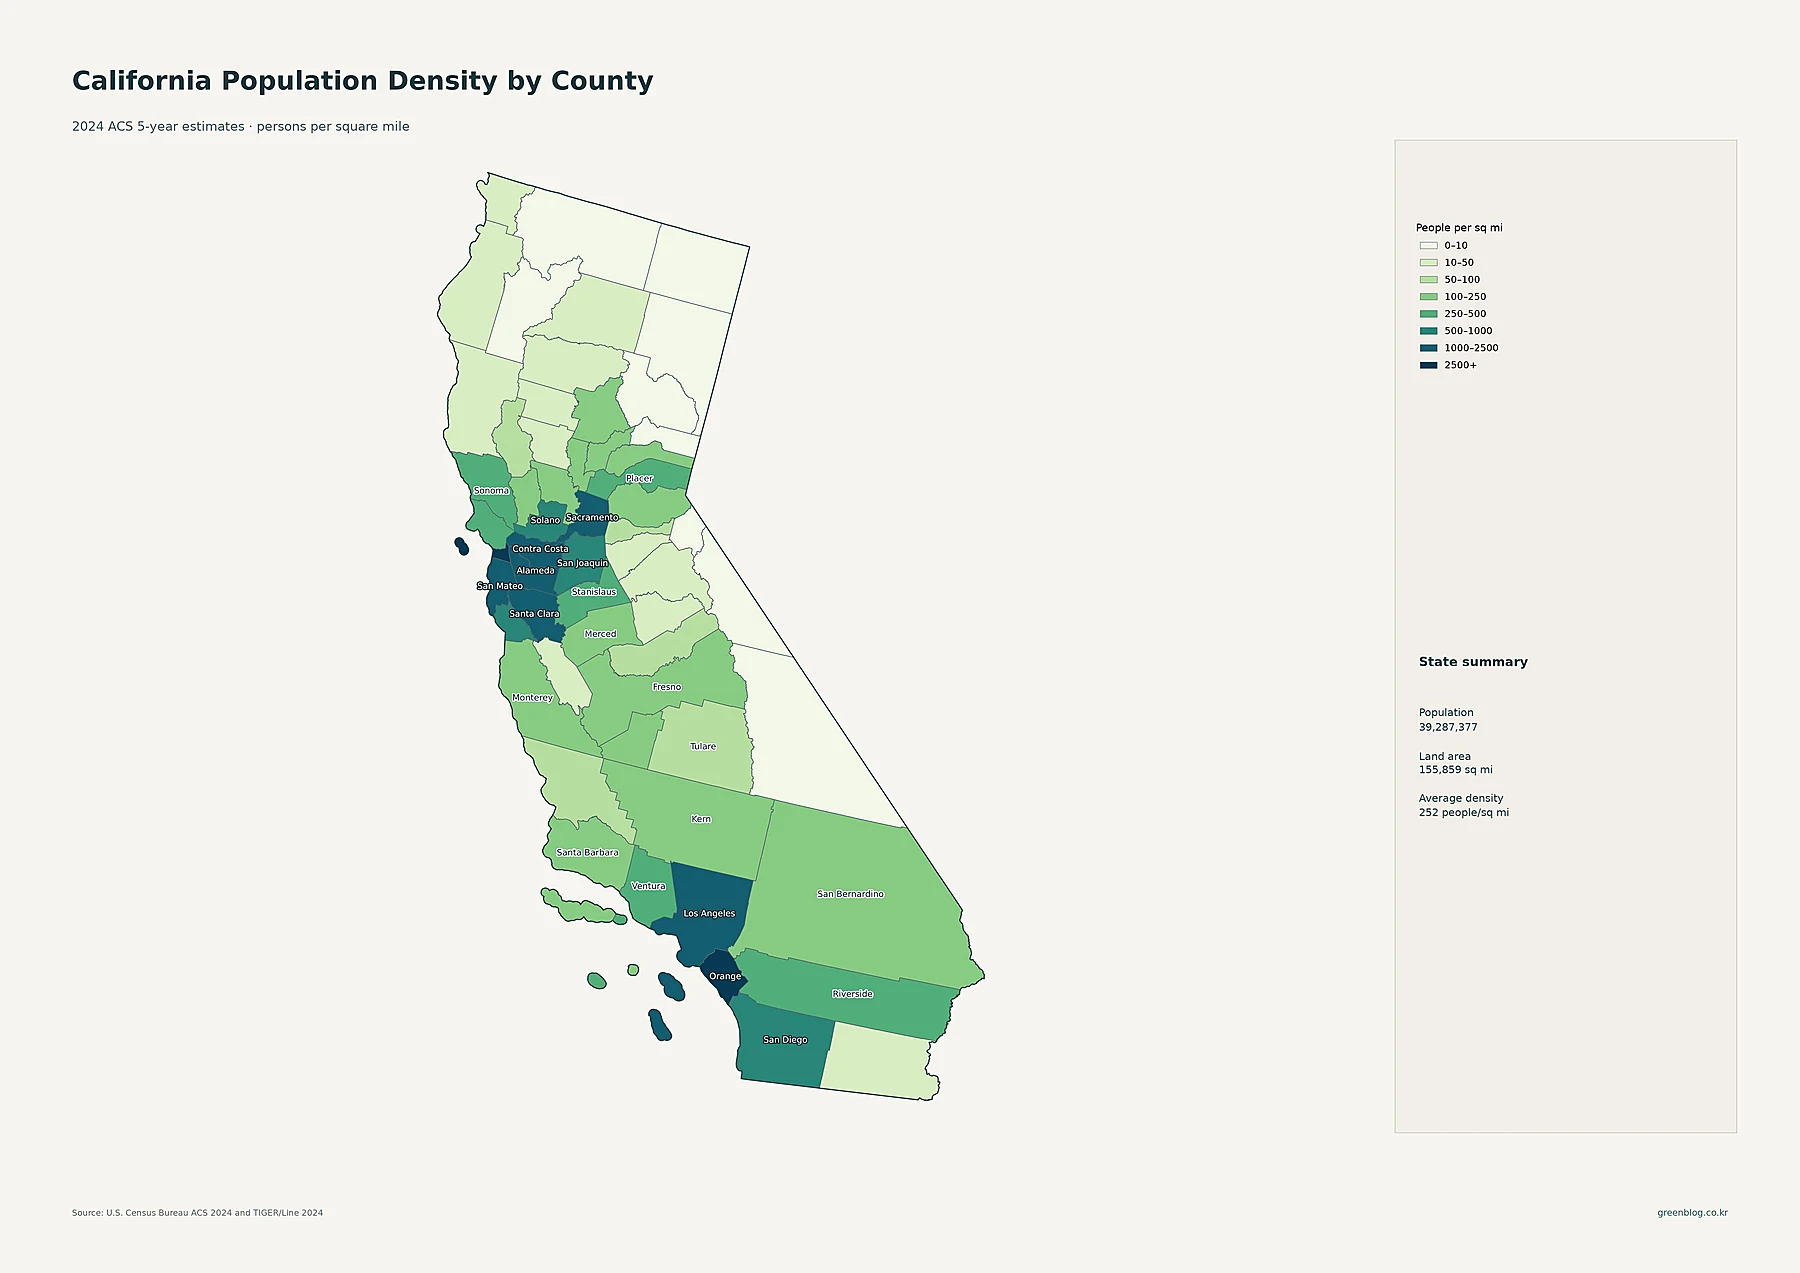
San Francisco is the clear county-density outlier at about 17,783.8 people per square mile. Orange County follows at about 3,992.9, Los Angeles at 2,415.8, and Alameda at 2,236.7. San Mateo, Sacramento, Contra Costa, and Santa Clara are also above roughly 1,400 people per square mile. These counties form the darkest cluster around the Bay Area, Sacramento, and the Los Angeles–Orange County core.
The map’s state summary reports a population of 39,287,377, a mapped area of 155,859 square miles, and an average density of about 252 people per square mile. That average is useful as a statewide reference but not as a picture of how Californians are distributed. The tract map shows why: dense urban neighborhoods occupy a small share of the land while very large mountain and desert tracts pull the statewide average downward.
What each map is best used for
- Detailed density: locate the specific tracts where residents are most concentrated inside and between major urban areas.
- Major cities: compare census-place population and see how individual cities sit within the broader 2020 urban footprint.
- County population: identify counties that contain the largest total number of residents.
- 2010–2020 change: compare the direction and percentage of decennial population change by county.
- County density: compare how concentrated county populations are after accounting for land area.
Reading the maps together resolves apparent contradictions. Los Angeles County is both very populous and densely settled, but San Bernardino combines a large population with a much lower countywide density. San Francisco is smaller in total population than Los Angeles, San Diego, or Orange County, yet it is dramatically denser because the county covers a compact area. These relationships are difficult to see from a single population map.
Download the California population map collection
California population and density map set
The collection includes the detailed density map, major cities and urban areas, county population, 2010–2020 county change, and county population density.
Frequently asked questions
Which California county has the highest population density in this dataset?
San Francisco County ranks first in the supplied 2024 ACS-based county dataset at approximately 17,783.8 people per square mile. Orange, Los Angeles, and Alameda are also high-density counties, but they are far below San Francisco’s countywide average.
Does the largest circle on the county map show the densest county?
No. The proportional circles show total population. Los Angeles County has the largest circle because it has the largest 2024 ACS population estimate in the dataset. The separate county-density map is the correct map for comparing residents per square mile.
Can the 2010–2020 change map be treated as a 2024 trend map?
No. It is a decennial comparison between the 2010 Census and 2020 Census. The other maps use 2020–2024 ACS 5-year estimates and 2024 geography. They can be interpreted together, but their dates and statistical products should remain clearly separated.
Related Maps
Sources
- U.S. Census Bureau — 2020–2024 American Community Survey 5-Year Estimates
- U.S. Census Bureau — 2024 TIGER/Line Shapefiles
- U.S. Census Bureau — 2010 Census Summary File 1 and Decennial Data
- U.S. Census Bureau — 2020 Census Redistricting Data (P.L. 94-171)
The figures and values above come from the project dataset and the official sources cited on the maps. ACS figures are survey estimates, while the 2010 and 2020 values used for the decade-change map are decennial Census counts; these are different statistical products and are not interchangeable.
Green Map creates custom-edited map images using open geographic data sources such as geoBoundaries, Natural Earth, OpenStreetMap, and government open data. These maps are edited visual materials, not raw data files, and are provided for education, documents, presentations, and graphic reference.