Agriculture dominates the Boone County Illinois Land Cover Map set. The 2025 summary assigns 78.48% of the county to agriculture, while developed land accounts for 14.42%, forest 4.44%, wetlands 1.98%, and barren land 0.31%. The broad farm matrix is interrupted by a large built-up area in the south-central part of the county and by narrower wooded and wet corridors near the Kishwaukee River system.
This page includes four views of the same county: current land cover, forest and farmland, impervious surface and developed land, and a 1985–2025 class-difference comparison. The WebP images are arranged for quick reading in the article, and the four original 2480 × 1754-pixel JPG maps are available together in one ZIP download for county profiles, agriculture lessons, environmental presentations, and change comparison.
Table of Contents
A countywide farm pattern makes the developed clusters easy to spot
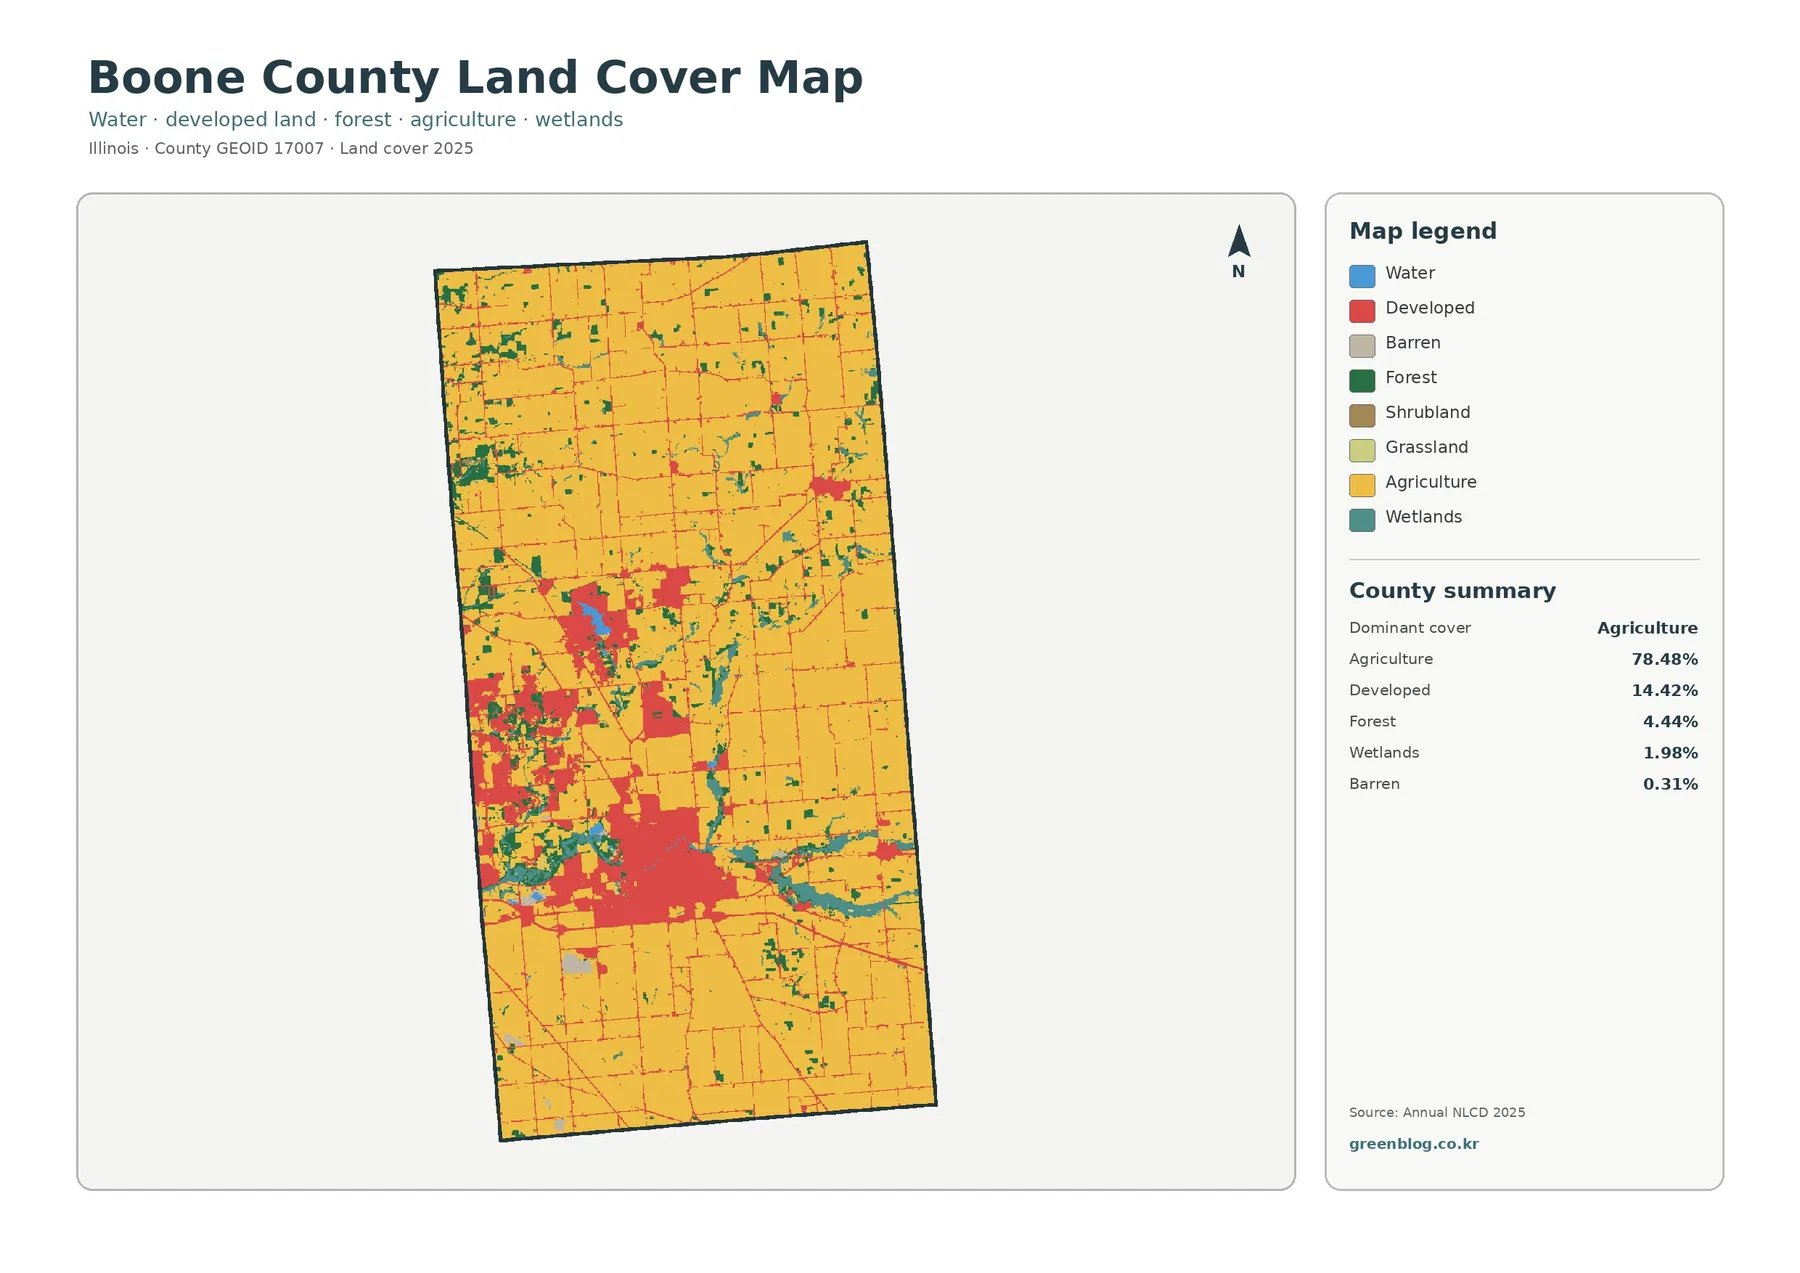
Yellow agricultural cover extends across nearly every part of Boone County. Large blocks fill the north and east, continue through the south, and surround most of the developed areas in the middle. At 78.48%, agriculture is not simply the largest category; it is the continuous setting against which the other classes stand out.
Developed land is the clear second-place class at 14.42%. The strongest concentration occupies the south-central portion of the county, with another sizable cluster to the west and smaller developed areas farther north and east. Belvidere is the county’s principal urban center, and the University of Illinois Extension maintains its Boone County office there. The large south-central cluster is therefore reasonably associated with the Belvidere area, although the color edge is not a municipal boundary.
Land cover is a surface classification rather than a zoning or property map. A developed cell can contain lawns, trees, and bare soil in addition to buildings or pavement. Agricultural color identifies a predominant surface class, not the owner, parcel boundary, crop, or legal land use of a field.
The impervious map separates hard surfaces from the broader developed class
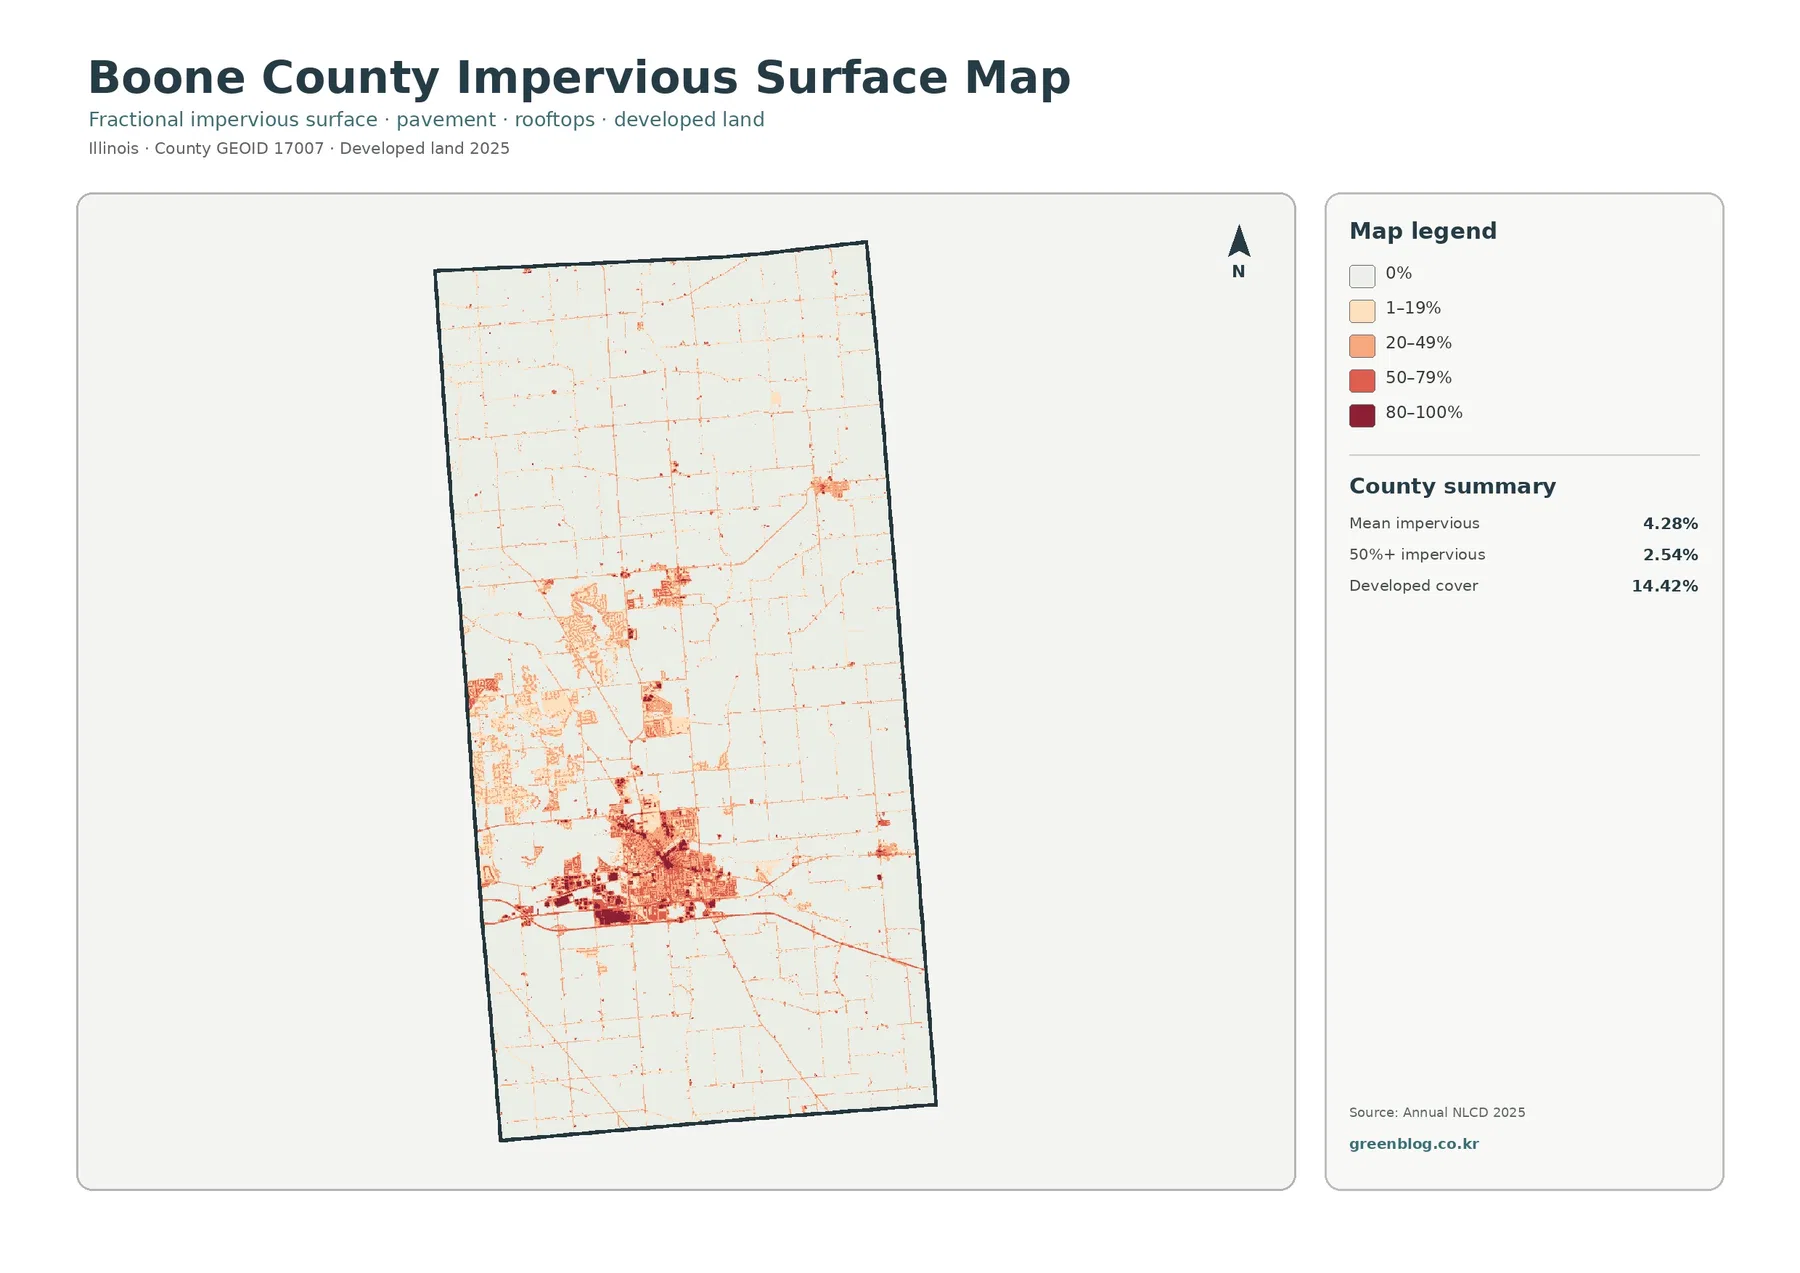
Boone County’s mean impervious cover is 4.28%, and 2.54% of the county is mapped at 50% impervious or greater. Those values are far below the 14.42% developed share because developed land can include permeable surfaces. Impervious cover narrows the question to roofs, pavement, parking areas, and other hard surfaces that do not readily absorb rainfall.
The deepest tones collect in the same south-central area that dominates the general developed-land map. Smaller dark patches appear to the west and north, while the surrounding farm country is mostly zero or low impervious cover. The contrast makes it easier to see why a countywide average can remain modest even when several local centers have much higher hard-surface intensity.
Kishwaukee River conservation areas explain several narrow forest-and-wetland bands
Forest covers 4.44% and wetlands 1.98%, small shares compared with agriculture. Their location gives them more visual importance than the percentages alone suggest. Dark green and teal patches repeatedly appear along narrow corridors through the center and west, where they separate or border farm blocks and developed areas.
The Boone County Conservation District describes Spencer Conservation Area on the western edge of Belvidere as bordering the Kishwaukee River for nearly a mile and a half. Its lowlands contain flood-tolerant trees such as silver maple, sycamore, and willow, along with wetlands associated with an older river channel. That local description matches the kind of wooded and wet river-bottom pattern visible near the main developed area.
The forest-and-farmland view removes urban color and reveals how continuous the cropland is
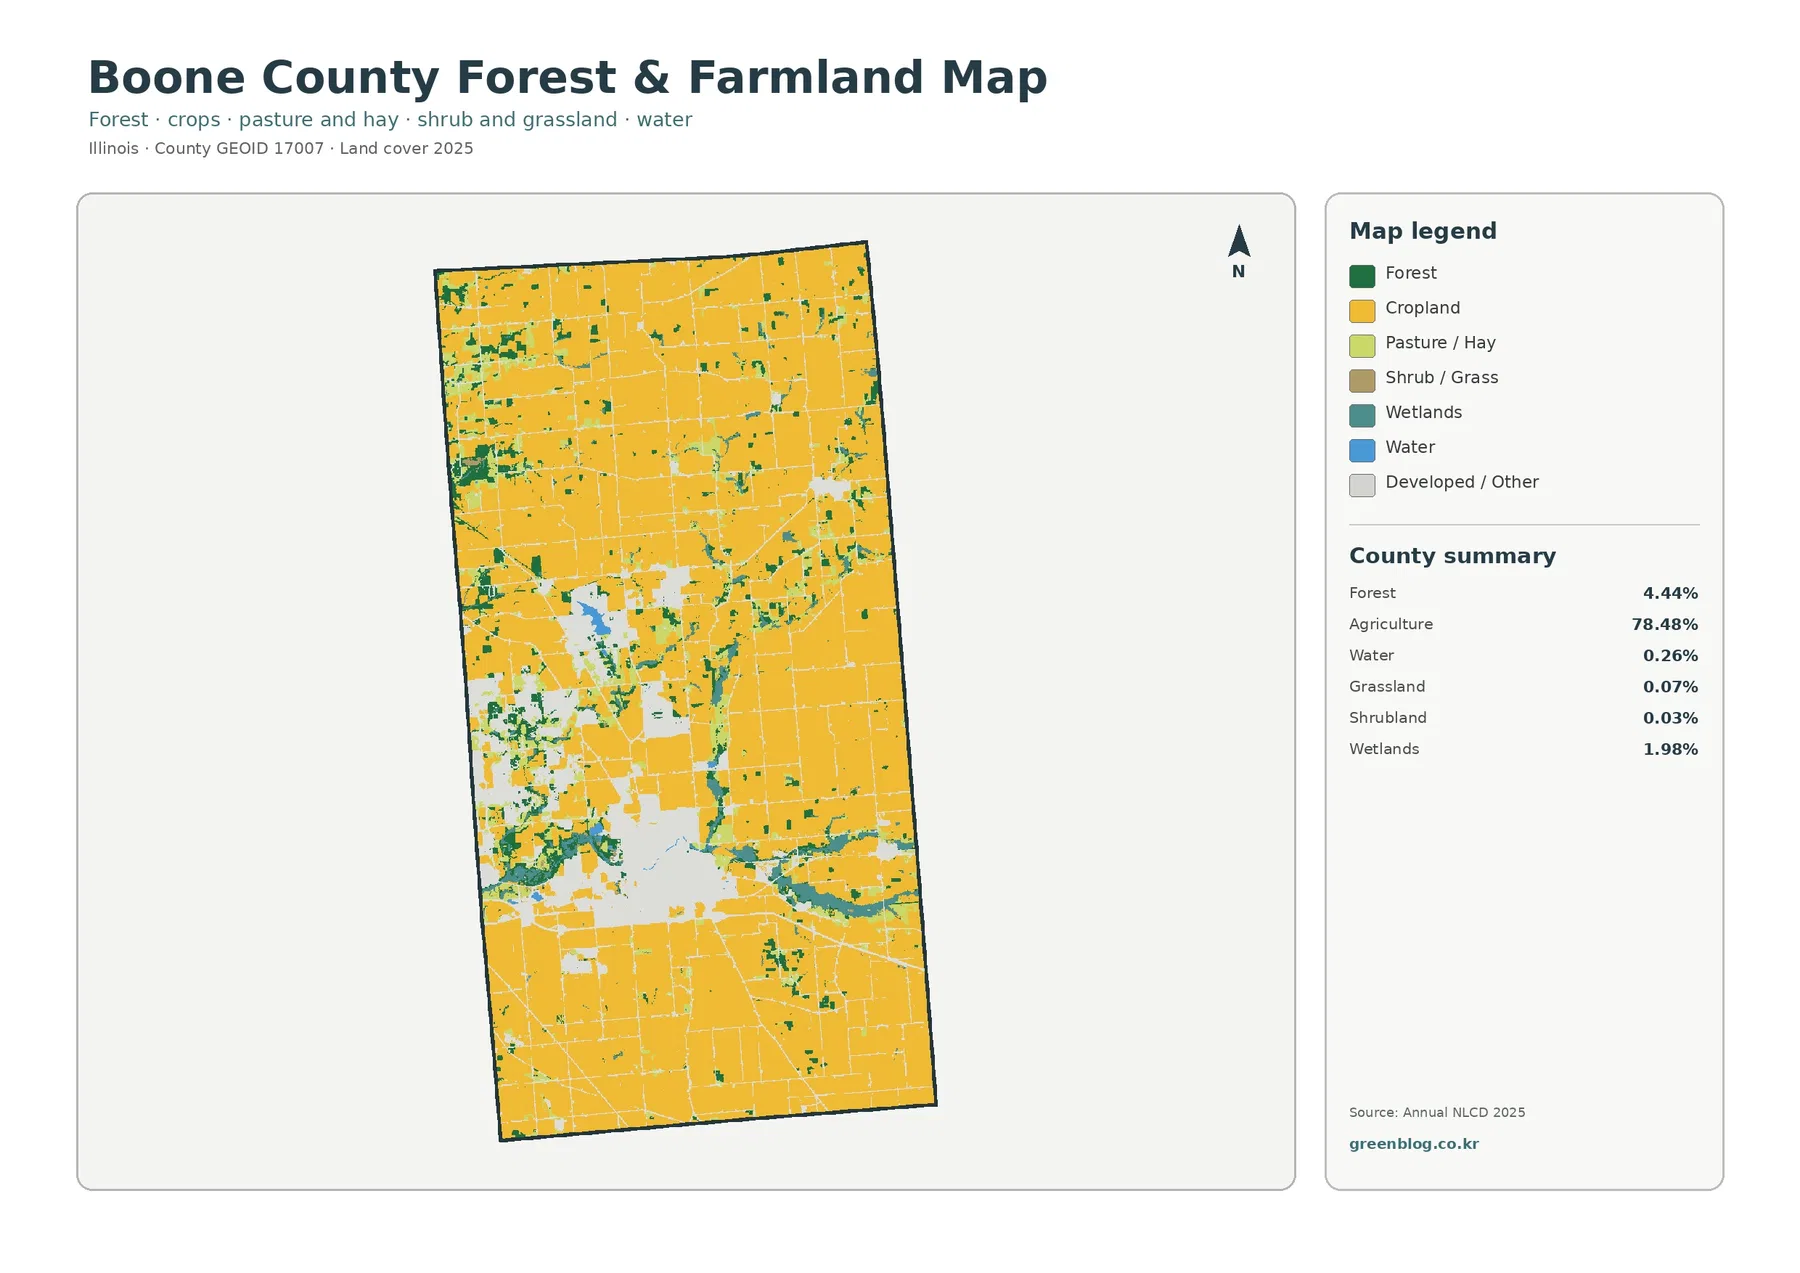
Once developed and miscellaneous surfaces are faded, agriculture becomes even more continuous. The large south-central urban area appears as a pale opening surrounded by cropland, and the western developed zone breaks into a lighter patchwork within the same farm-dominated setting. Forest and wetland bands become easier to follow because the red urban class is no longer competing for attention.
Forest remains only 4.44%, but its patches are concentrated along waterways and at the edges of some farm blocks. Wetlands at 1.98% often sit beside these wooded areas. Grassland is 0.07% and shrubland 0.03%, so open grass and shrub cover are minor components in the supplied summary rather than defining features of the county.
Most 1985–2025 difference is classified as development or other change
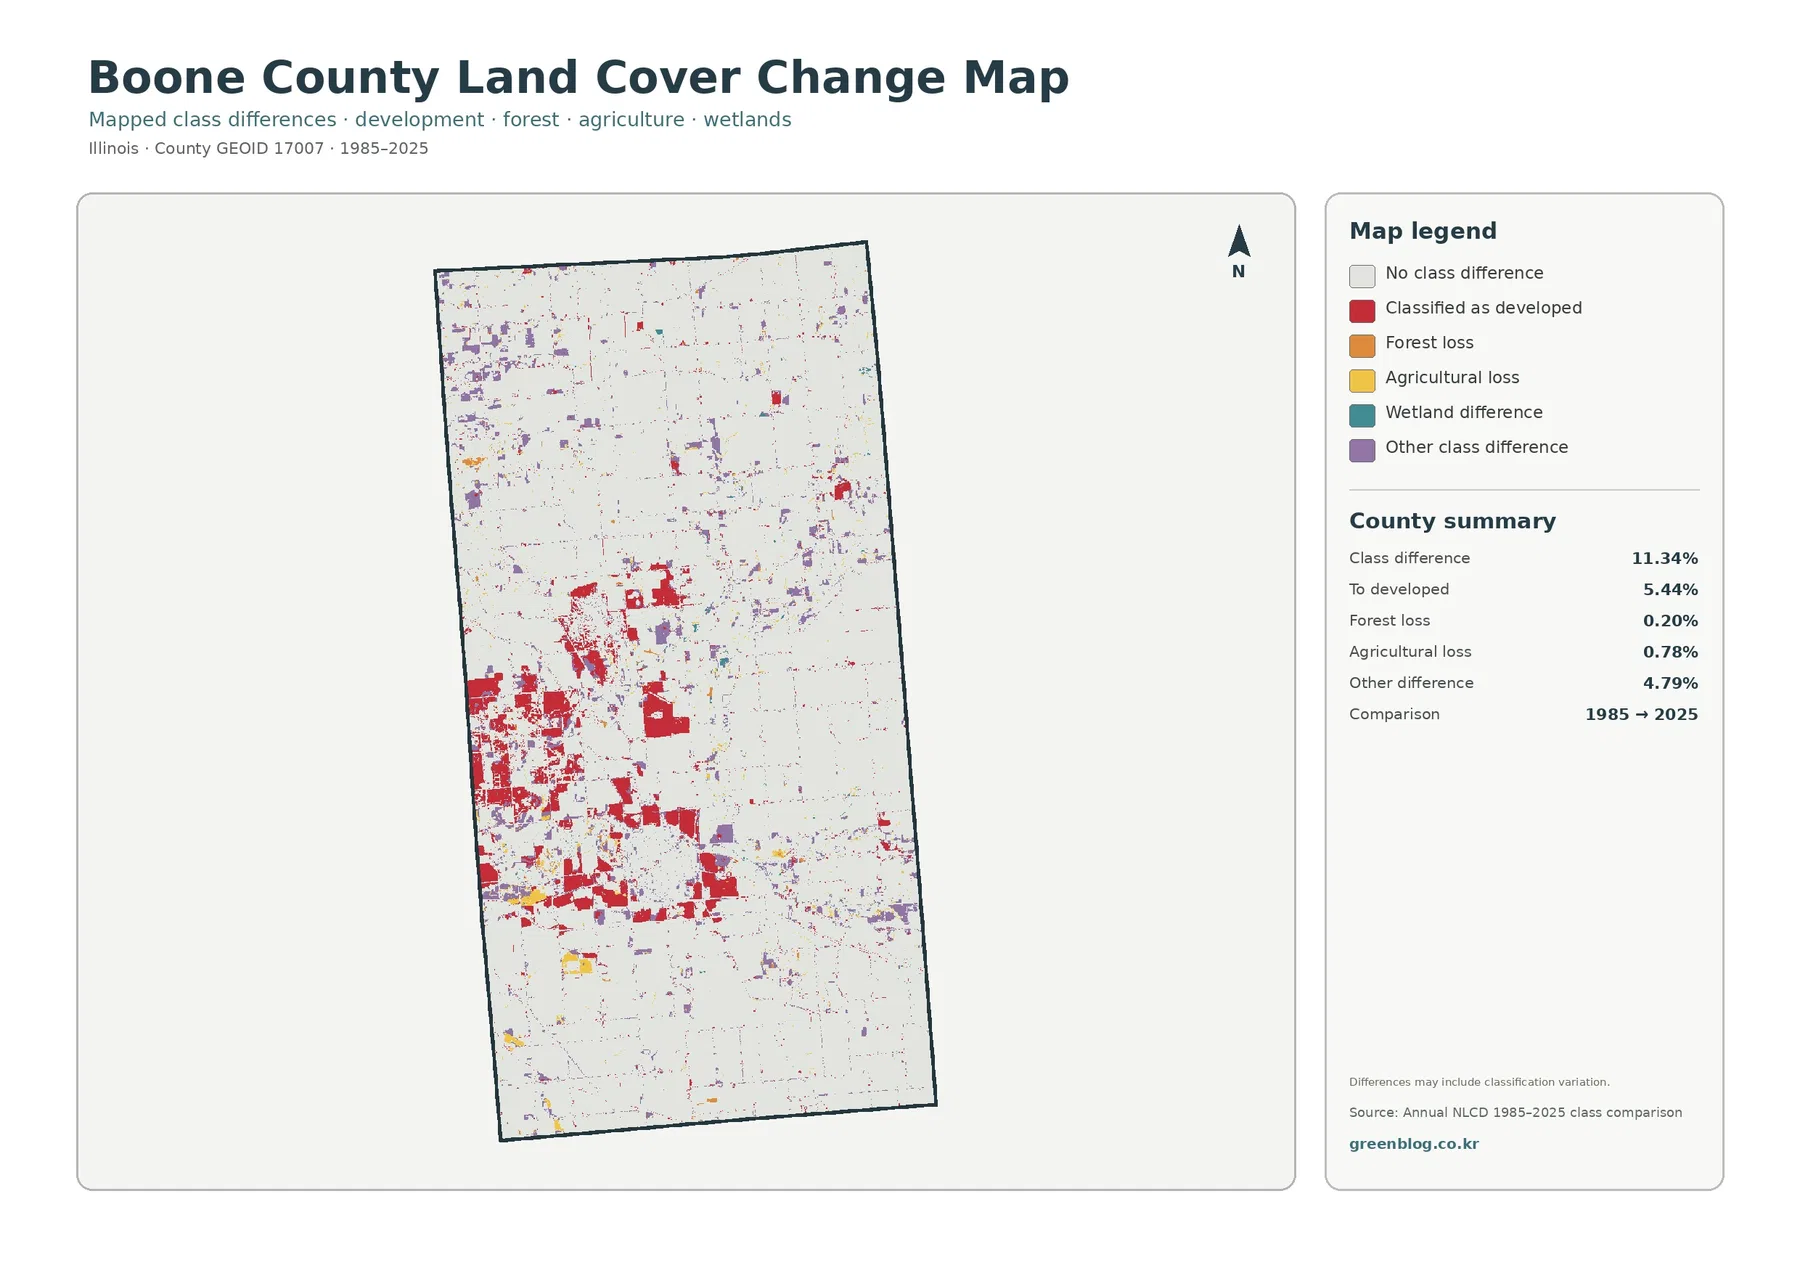
The endpoint comparison reports 11.34% total class difference. The listed components are 5.44% classified as developed, 0.20% forest loss, 0.78% agricultural loss, and 4.79% other difference. Wetland difference appears in the legend without its own printed percentage, so it should not be estimated from the image or presented as an official residual.
Red developed-conversion cells are concentrated around the south-central and western built areas and extend into several smaller clusters. That pattern overlaps broadly with places that are developed in 2025, but it does not identify the exact year a subdivision, road, or commercial site was built. It only records a different class at the two endpoints.
Reading the four maps in a practical order keeps farm cover, urban intensity, and change separate
For a general Boone County profile, start with the 2025 land-cover overview. It immediately establishes the 78.48% agricultural base and shows where the larger developed areas and river-related natural cover interrupt that pattern. The forest-and-farmland view is the best second image when the topic is agriculture or habitat because it removes much of the urban color.
For urban growth or stormwater discussions, the impervious surface map is more precise than the developed class. Its 4.28% county mean can be compared with the darker Belvidere-area concentration and the low values across surrounding farmland. The 1985–2025 comparison belongs after the current maps because its colors describe endpoint class differences rather than present-day land cover.
The current maps represent the supplied 2025 observation year. Later construction, crop rotation, tree removal, restoration, or wet conditions may not appear. Each original JPG is 2480 × 1754 pixels; the package does not mark the files as meeting an A3 high-resolution reference, so a test print is sensible before large-format enlargement.
What is included in the four-map JPG download
The ZIP contains one JPG each for 2025 land cover, forest and farmland, impervious surface and developed land, and 1985–2025 land-cover change. The files share the same county identity and are intended for side-by-side comparison rather than parcel, zoning, wetland-jurisdiction, or engineering decisions.
Frequently Asked Questions
How dominant is agriculture in Boone County in the 2025 map?
Agriculture covers 78.48% of the supplied 2025 summary. It forms the broad background across the north, east, south, and much of the center, while developed areas, river wetlands, and forest patches interrupt that farm matrix in selected places.
Why is developed land 14.42% when mean impervious cover is only 4.28%?
Developed land can include lawns, trees, soil, and other permeable surfaces around buildings and roads. Impervious cover isolates harder materials such as rooftops and pavement, so its countywide mean is lower even though the same urban centers remain visible.
Does the 5.44% developed-conversion value equal the amount of construction completed since 1985?
No. It is the share of cells assigned another class in 1985 and a developed class at the 2025 endpoint. It does not reveal the precise construction year, project type, or cause, and some classification variation can be present. Intermediate imagery and local records are needed for a detailed development history.
Sources and Reference Data
- MRLC Annual NLCD Data – official access point for annual land-cover and comparison products
- USGS Annual NLCD Land Cover Classification – official guidance for the 30-meter land-cover classes
- U.S. Census Bureau TIGER/Line Shapefiles – official county-boundary reference for Boone County
- University of Illinois Extension – Boone, DeKalb and Ogle Agriculture – local crop and farm-management resources serving Boone County
- Boone County Conservation District – Spencer Conservation Area – local Kishwaukee River, floodplain forest, and wetland context at Belvidere
- Boone County Conservation District – Current Projects – riparian woodland, wetland, and grassland restoration context in Boone County
Map File Information
The ZIP contains four original JPG maps for comparing Boone County's agricultural base, Belvidere-area development and hard surfaces, Kishwaukee River natural cover, and 1985–2025 class differences.
- Included Files: Original high-resolution map files shown in this article
- File Type: JPG images packaged in a ZIP archive
- Intended Use: Printing, education, presentations, and map-based projects
Related Maps
- Adams County Illinois Land Cover Map
- Alexander County Illinois Land Cover Map
- Bond County Illinois Land Cover Map
Green Map creates custom-edited map images using open geographic data sources such as geoBoundaries, Natural Earth, OpenStreetMap, and government open data. These maps are edited visual materials, not raw data files, and are provided for education, documents, presentations, and graphic reference.