This Illinois County Map fits all 102 counties into a tall state portrait, from the six-county northern row beside Iowa and Lake Michigan to Alexander, Pulaski, and Massac at the southern tip. That long shape creates two different reading challenges: small counties must remain legible, and the dense Chicago-area pattern must share one page with much larger rural counties in central and southern Illinois.
The labeled maps name every county and show Iowa, Missouri, Indiana, and Lake Michigan as surrounding references. They do not mark Chicago, Springfield, county seats, highways, rivers, terrain, or distances. The result is a county-boundary resource rather than a navigation map, making it suitable for identification exercises, statewide comparisons, presentation graphics, and county-based data planning.
Three matching versions are supplied: a pastel color reference, a labeled black-and-white sheet, and an unlabeled boundary outline. The published Illinois County Map previews measure 1200 × 1589 pixels in WebP format. The download collection provides JPG map files prepared for an A3 layout, so the WebP previews should not be confused with the files inside the ZIP archive.
Table of Contents
Illinois County Map Overview
The U.S. Census Bureau and the State of Illinois both identify 102 counties. On the supplied page, the north begins with Jo Daviess, Stephenson, Winnebago, Boone, McHenry, and Lake. Farther east, Cook occupies the Lake Michigan edge, while DuPage, Kane, Kendall, and Will create a compact group around it. This arrangement explains why northeastern labels need more careful spacing than many counties farther south.
Central Illinois shifts between broad rectangular counties and irregular boundaries. McLean, Livingston, Iroquois, Champaign, Sangamon, Macon, and Christian are visually prominent, while Putnam, Stark, Menard, and Moultrie occupy much smaller spaces. Along the western side, the state outline bends around counties such as Rock Island, Henderson, Hancock, Adams, Pike, Calhoun, and Jersey, although the rivers responsible for much of that border shape are not labeled.
The southern half narrows through Madison, St. Clair, Monroe, Randolph, Perry, Jackson, Williamson, Franklin, Saline, and neighboring counties before reaching the pointed end. Alexander and Pulaski fill the southwest tip, while Massac lies along the lower southeastern edge. The map offers no north arrow, but its upright state orientation and the location of Lake Michigan make direction easy to infer.
Several names use simplified capitalization in the artwork, including forms such as “Mchenry,” “Dekalb,” “Dupage,” “Lasalle,” “Mclean,” and “Dewitt.” Standard accompanying text should use McHenry, DeKalb, DuPage, LaSalle, McLean, and DeWitt. A small numeral-like “7” also appears immediately below Putnam in all three supplied previews, including the outline. Users preparing a polished worksheet may wish to cover that artifact.
Color-Coded County Map
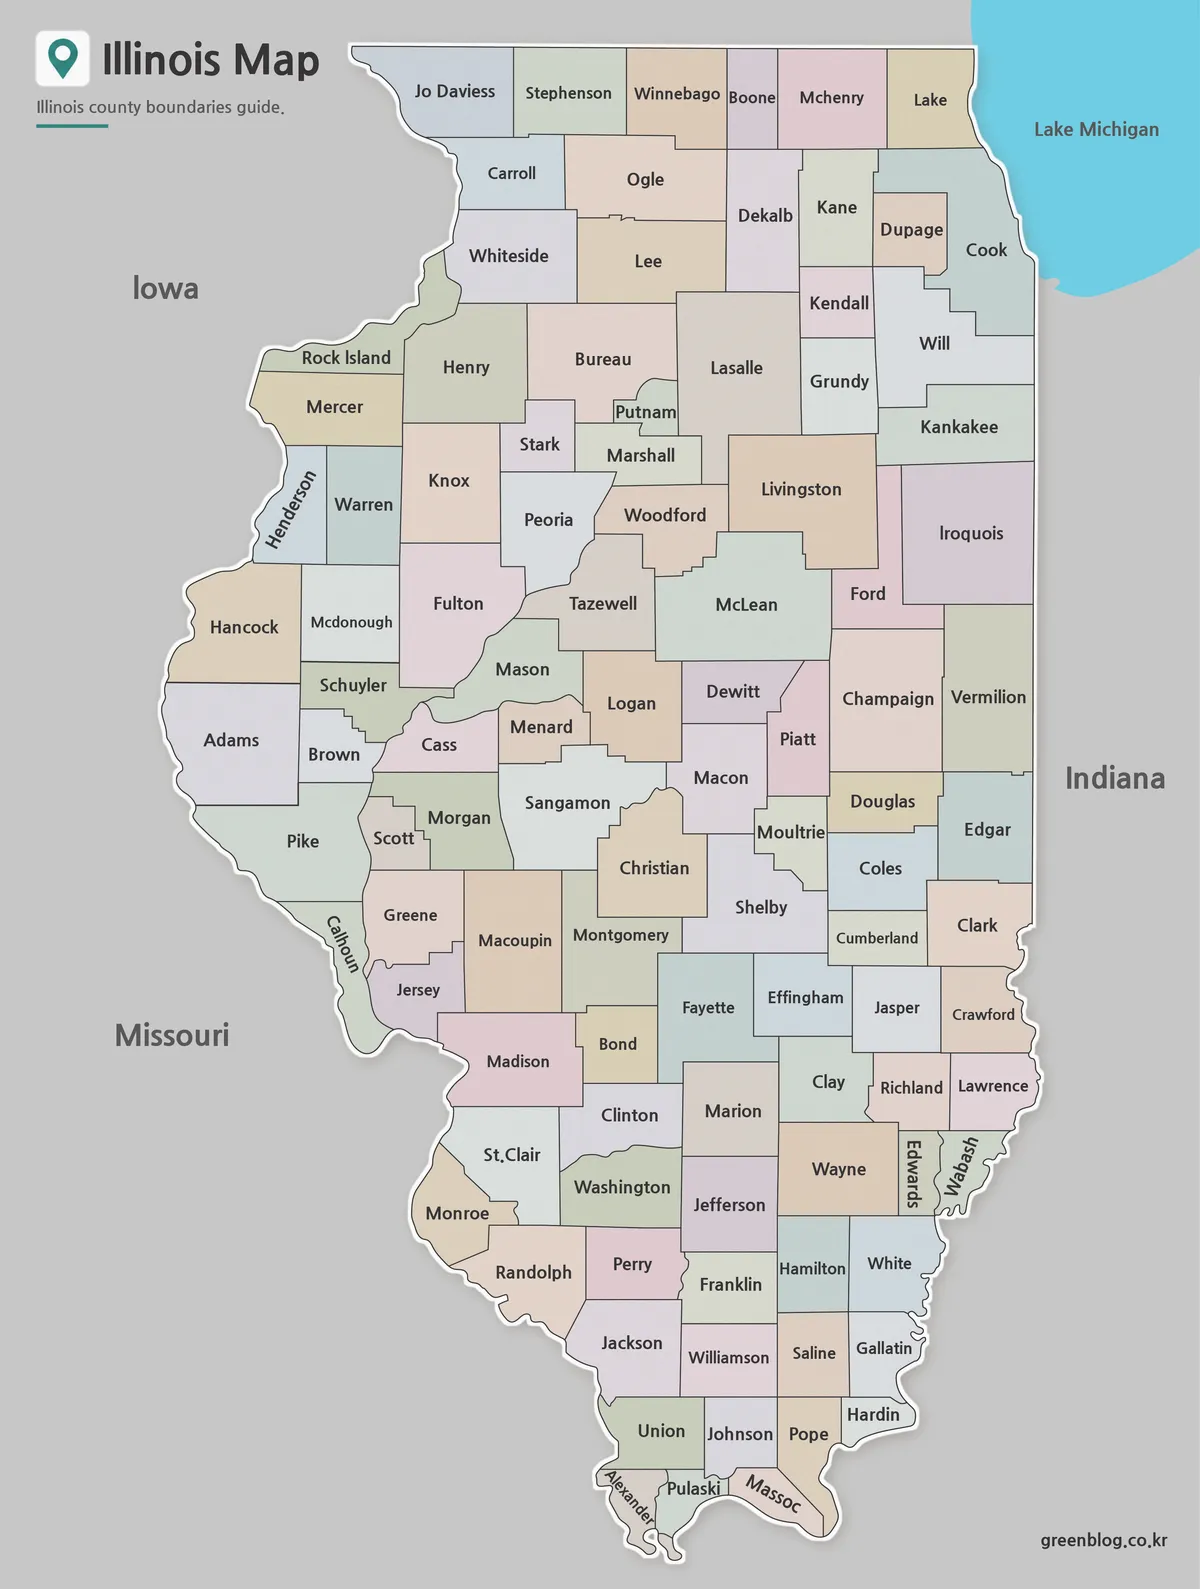
The color Illinois County Map assigns contrasting pastel fills to adjoining counties, helping a viewer follow boundaries without relying on labels alone. The colors are categorical; they do not represent population, voting, land use, or any other statistic. Lake Michigan is the only major water area filled blue, while neighboring land remains gray and the county interiors use muted tones that keep black text readable.
This version is strongest for a first overview or a presentation slide. In northeastern Illinois, separate fills clarify the Cook–DuPage–Kane–Lake–Will pattern. In the center, color makes small Putnam easier to separate from Bureau, LaSalle, Marshall, and Stark. At the southern tip, it helps distinguish Alexander, Pulaski, Massac, Union, Johnson, Pope, and Hardin even when their labels sit close together.
For a thematic graphic, treat the existing pastel palette as a reference rather than as data. A designer who needs to encode values should begin with the blank outline and apply a documented legend. That avoids a common mistake in which decorative colors are interpreted as meaningful categories that the source never defined.
Black and White Printable Version
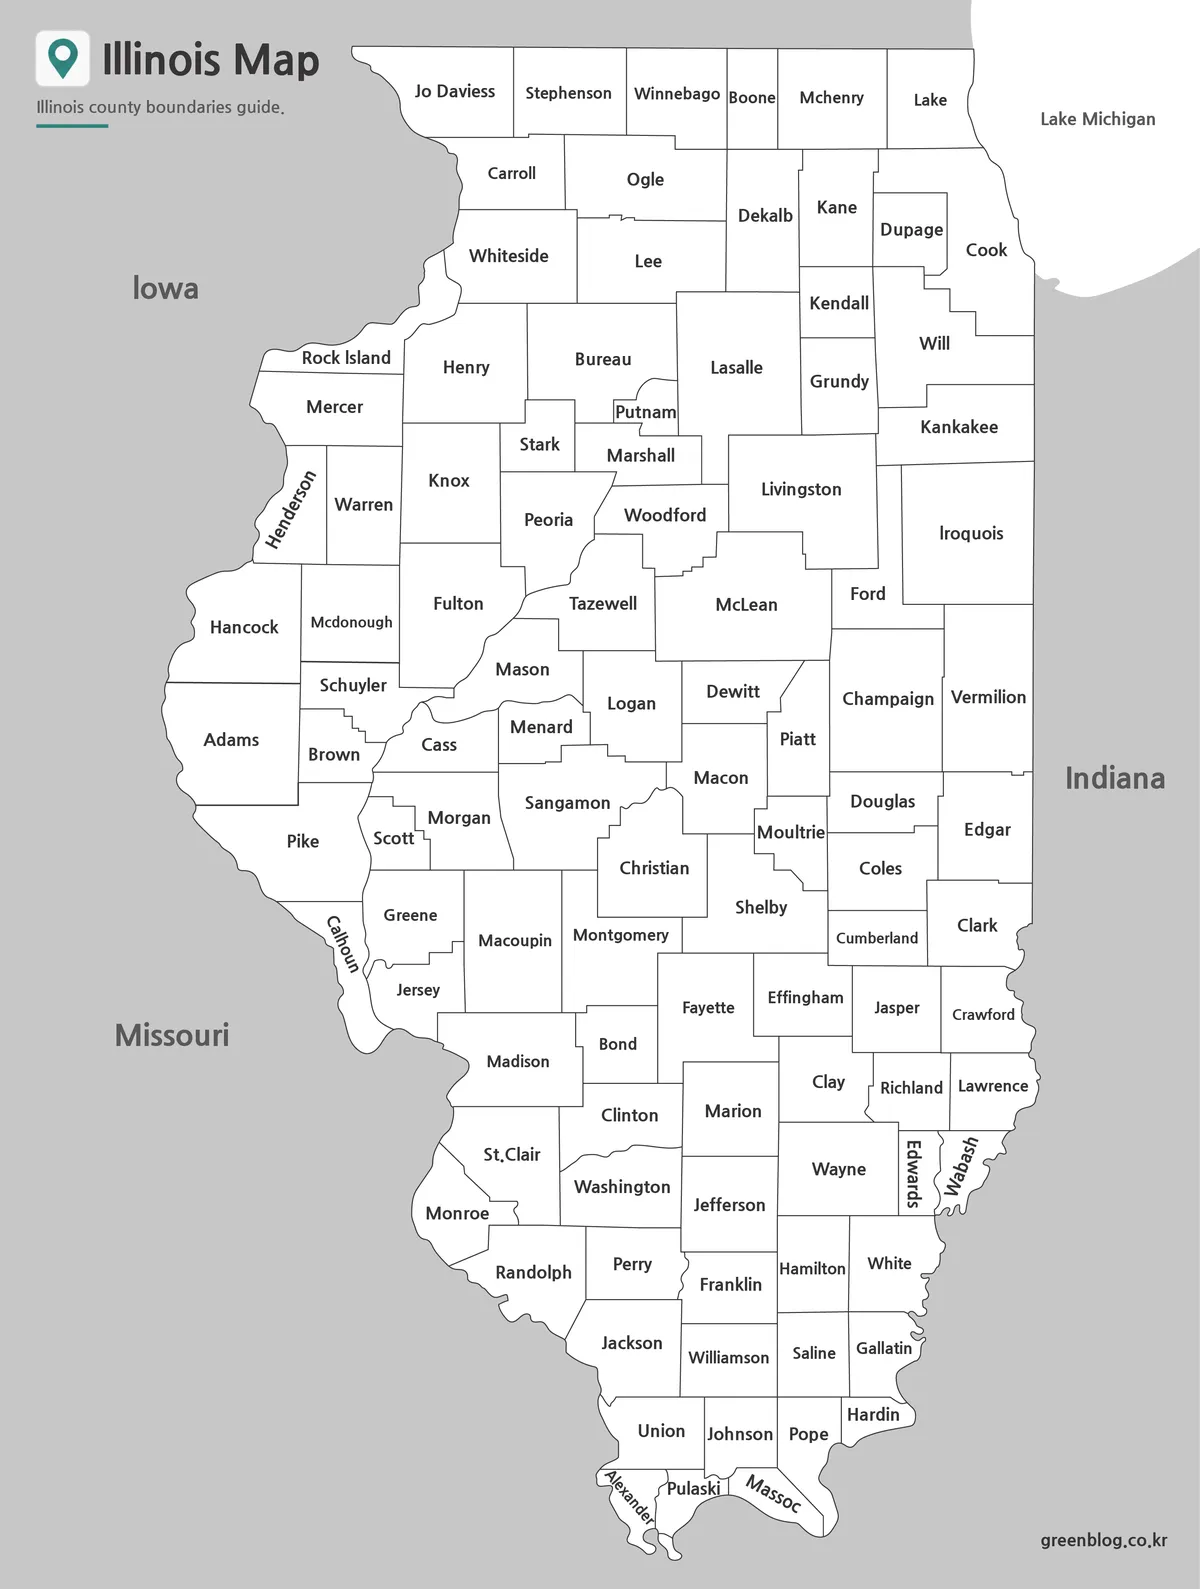
The monochrome Illinois County Map retains the complete county-name layer while replacing the pastel fills with white. It works well as an answer key, report insert, study sheet, or classroom handout where the reader must see names without the visual weight of many colors. The outer land remains gray, but Lake Michigan is white rather than blue, so its printed label is important for identification.
Before printing, inspect the smallest labels at the intended size. Putnam is confined to a narrow area, and vertical text is used in Henderson, Calhoun, Edwards, Wabash, Alexander, and Massac. The compact northeastern group also benefits from a sharp print setting. Maintaining the portrait aspect ratio is more important than filling every edge of an A3 page, because horizontal stretching would distort county proportions.
The black-and-white sheet leaves room for circles, arrows, and light highlighting while preserving the county names. Students can mark selected counties, trace a north-to-south sequence, or group areas into teacher-defined regions. Because no cities appear, an assignment about Chicago or Springfield should provide a separate city point or ask learners to add it with another verified reference.
Blank Outline Map for Editing
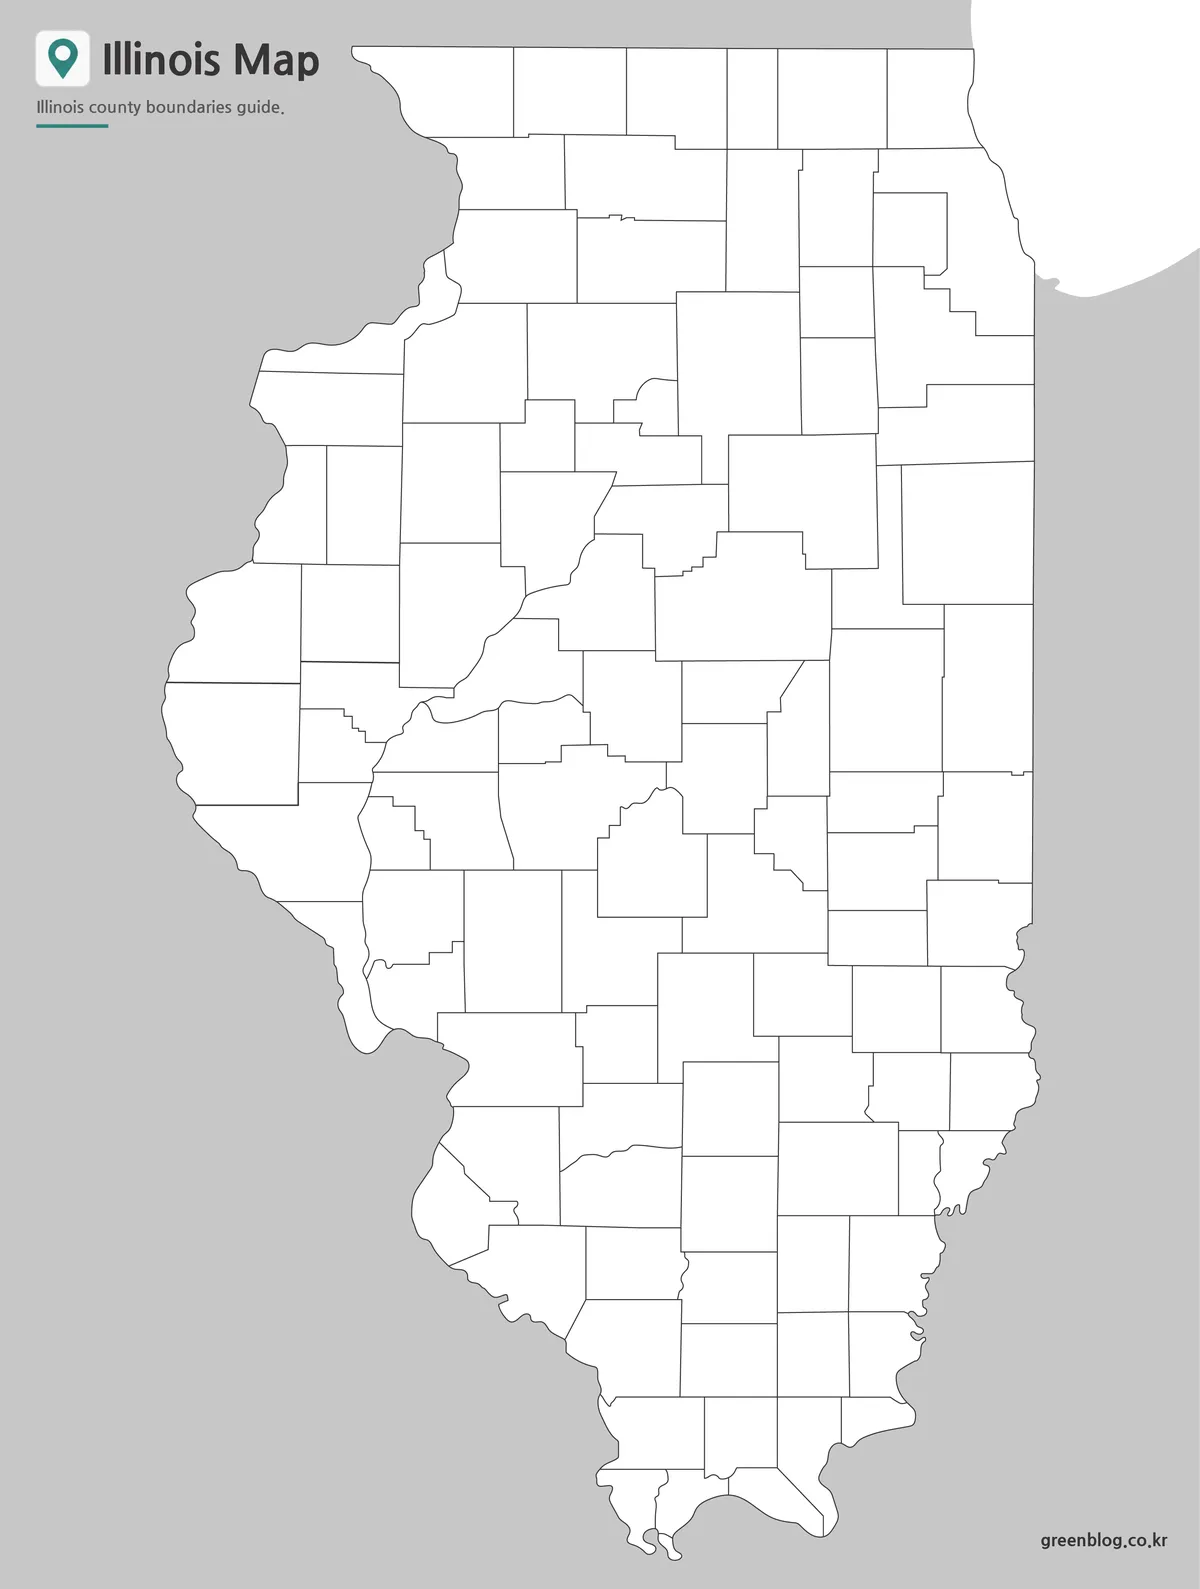
The blank Illinois County Map removes county names, neighboring-state labels, and the Lake Michigan label but keeps the state title, subtitle, internal boundaries, surrounding gray land, and site mark. It is therefore an unlabeled county worksheet rather than a completely empty canvas. The small “7” artifact near Putnam also remains and should be considered when preparing a final classroom or publication graphic.
A practical labeling exercise can proceed by zones. Begin with the six counties on the northern edge, continue through Cook and its surrounding northeastern counties, then identify the large central counties. Finish with the western river-border sequence and the narrowing southern group. This method is easier to check than asking learners to place 102 names in one pass.
The supplied outline is a raster image, not a confirmed SVG, vector, or layered source file. Users can still add typed labels, transparent fills, numbered markers, or simple symbols in common image and document software. For statistical shading, build a legend and cite the date and source of the values; the boundary image itself contains no county data.
Practical Uses for the Map
An Illinois County Map supports statewide lessons that would be difficult with a simple outline. Students can compare the compact Chicago-area counties with the broader central grid, identify counties touching neighboring states, or follow the state from Lake County to Alexander County. Analysts and communicators can use the outline as a base for county-level categories after supplying their own verified data and legend.
Choose the color version when quick visual separation matters, the monochrome version when county names and economical printing are priorities, and the outline when the reader should label or shade the counties. For A3 output, keep the portrait orientation, fit the image proportionally, and leave margin around the title, Lake Michigan, and the pointed southern edge. A test print is worthwhile because labels vary greatly in available space.
The maps are best treated as general county-boundary references. They do not establish a legal boundary survey, show the date of the linework, or identify county seats and transportation features. When exact boundaries or current geographic codes matter, compare the artwork with an authoritative government source before publishing an analysis.
Frequently Asked Questions
What does the Illinois County Map include?
The Illinois County Map includes county boundaries across the state. Depending on the version, it may also include color coding or county labels.
Can I print the map in A3 size?
Yes. The files were prepared as high-resolution JPG maps and reviewed for A3 printing.
Which version is best for classroom use?
The black and white labeled version is usually best for worksheets and handouts. The color version works better for presentations.
Is the outline map editable?
Yes. The blank outline version is intended for editing, custom coloring, annotations, and infographic projects.
Map File Information
The archive contains the three Illinois county views shown above for reference, A3 printing, labeling, and custom graphics.
- Included Versions: Color labeled, black-and-white labeled, and blank outline maps
- Printable Size: A3
- File Type: JPG image files in a ZIP archive
- Intended Use: Lessons, answer keys, reports, presentations, and annotations
Related Maps
Additional Resources
The State of Illinois Illinois facts page provides an official overview that includes the state’s 102-county count and other basic reference information.
Green Map creates custom-edited map images using open geographic data sources such as geoBoundaries, Natural Earth, OpenStreetMap, and government open data. These maps are edited visual materials, not raw data files, and are provided for education, documents, presentations, and graphic reference.