A Texas Map at county scale turns one familiar state outline into a demanding reading exercise: 254 internal areas must remain distinct from the Panhandle to the Gulf Coast. This collection provides three views of that framework—a pastel reference, a monochrome reference, and an unlabeled outline—so readers can choose between quick identification and an open working surface.
The two labeled sheets name counties and add New Mexico, Oklahoma, Arkansas, Mexico, and the Gulf of Mexico as surrounding references. They do not mark highways, rivers, terrain, county seats, or cities with separate symbols. The blank sheet removes every place name and fill while retaining the county divisions. All three are raster WebP previews measuring 1200 × 1086 pixels, not GIS layers or confirmed vector files.
Two names on the labeled artwork need attention before publication or answer-key use. The coastal county immediately south of Harris is Brazoria, although the image uses its seat name, Angleton. In west-central Texas, Irion County appears as “Iron.” The outline version avoids both issues because it contains no labels; the color and black-and-white versions should be corrected or clearly annotated.
Table of Contents
Texas at County Scale
The state shape provides several strong orientation cues before any county name is read. The Panhandle rises as a rectangular block in the northwest, the western boundary reaches toward El Paso, the Rio Grande creates the long southern and southwestern edge, and the coastline bends from the Mexican border toward Louisiana. On the color edition, blue water makes the Gulf curve especially easy to distinguish from the straighter northern and western borders.
County size changes dramatically across the page. Brewster, Presidio, Culberson, Hudspeth, and Pecos occupy broad spaces in the west, allowing their names to sit comfortably inside the boundaries. North and East Texas contain much tighter arrangements. Rockwall, Camp, Delta, Morris, and neighboring counties require smaller lettering, so a thumbnail is useful for recognizing the state but not for checking every name.
Reading Names That Are Also City Names
Because the named versions omit the word “County,” several labels can look like city markers. Austin identifies Austin County west of the Houston area; it is not a symbol for the state capital, which lies in Travis County. Houston denotes Houston County in East Texas, while the city of Houston lies primarily in Harris County. Dallas and El Paso are likewise county names placed inside county polygons rather than separate municipal points.
Bexar and Tarrant make the convention clearer. A city-focused reference would probably emphasize San Antonio and Fort Worth, but this sheet displays the county names instead. Anyone adding cities should use a visibly different point symbol, verify each location independently, and explain the new layer in a legend. Otherwise, readers may mistake a county label for a city position or assume that every familiar name represents the same kind of feature.
Three Texas Map Versions for Different Tasks
The three images share the same 1200 × 1086 canvas and county framework. Moving from one edition to another does not require relearning the layout: the Panhandle, westward reach, southern border, and county network stay aligned. What changes is the amount of visual guidance. The color sheet separates adjacent areas, the monochrome sheet prioritizes names and lines, and the outline leaves the interpretation to the reader.
Color-Coded County Reference
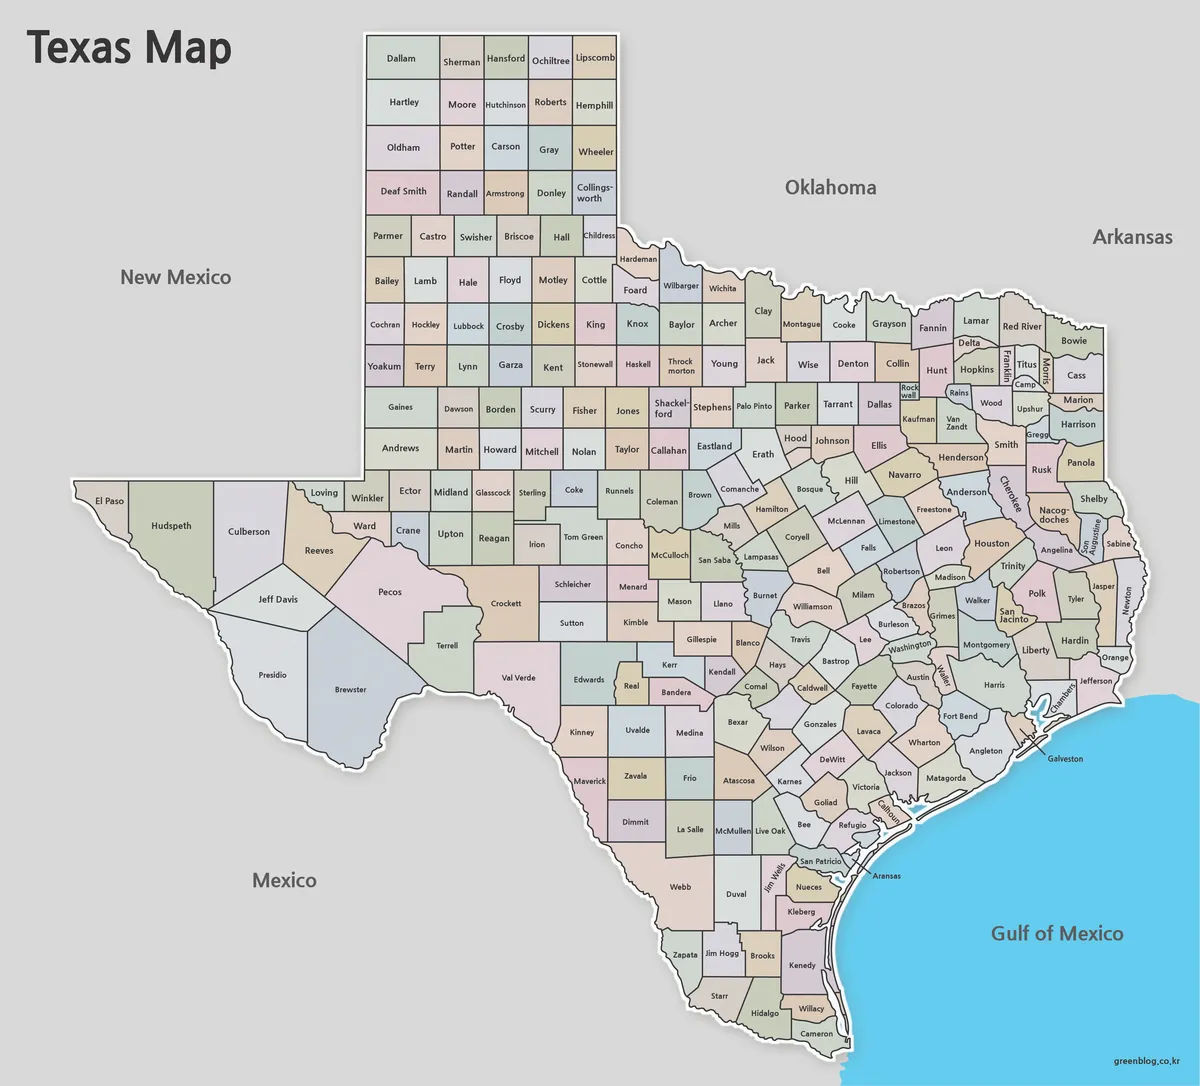
Muted pastel fills make neighboring counties easier to separate without implying a measured value. The palette is categorical decoration only: it does not encode population, election results, climate, land cover, economic regions, or administrative groupings. Gray outside land keeps the state prominent, while the blue Gulf provides a strong coastal reference. This version works well for projection, orientation, and quick comparisons among several counties.
If data are added to this edition, the new symbols must not be confused with the existing fills. Use points, hatching, labels, or a clearly explained scale rather than assigning an unexplained second meaning to the pastel colors. The color Texas Map is most effective when its original job remains simple: helping the eye follow county edges through crowded parts of the state.
Black-and-White Labeled Reference
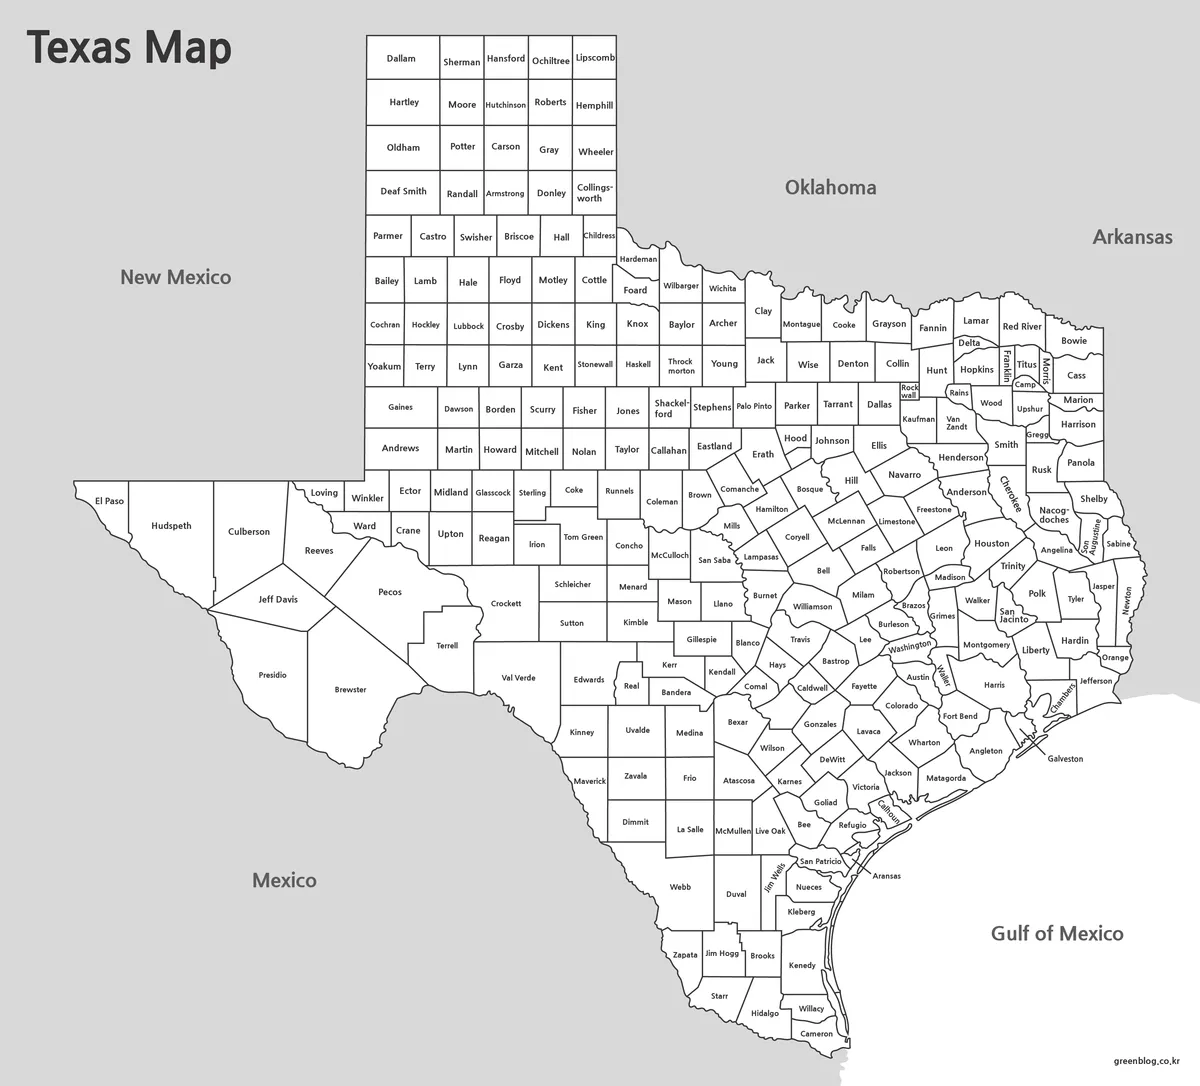
The monochrome edition keeps county names, neighboring references, and boundary lines while removing the pastel areas and blue water. Its white interiors accept short notes more readily and fit documents intended for grayscale printing. It can serve as a lookup sheet or corrected answer key, but only after the Brazoria/Angleton and Irion/Iron issues are handled.
This file has an additional presentation limitation: the title at the upper left is visibly cropped in the supplied preview. The county framework itself remains present, yet anyone preparing a polished handout should inspect that top edge before distribution. Reduction also affects the small northeastern labels first. A black-and-white Texas Map may print cleanly, but clean lines do not guarantee readable type at every size.
Blank County Outline
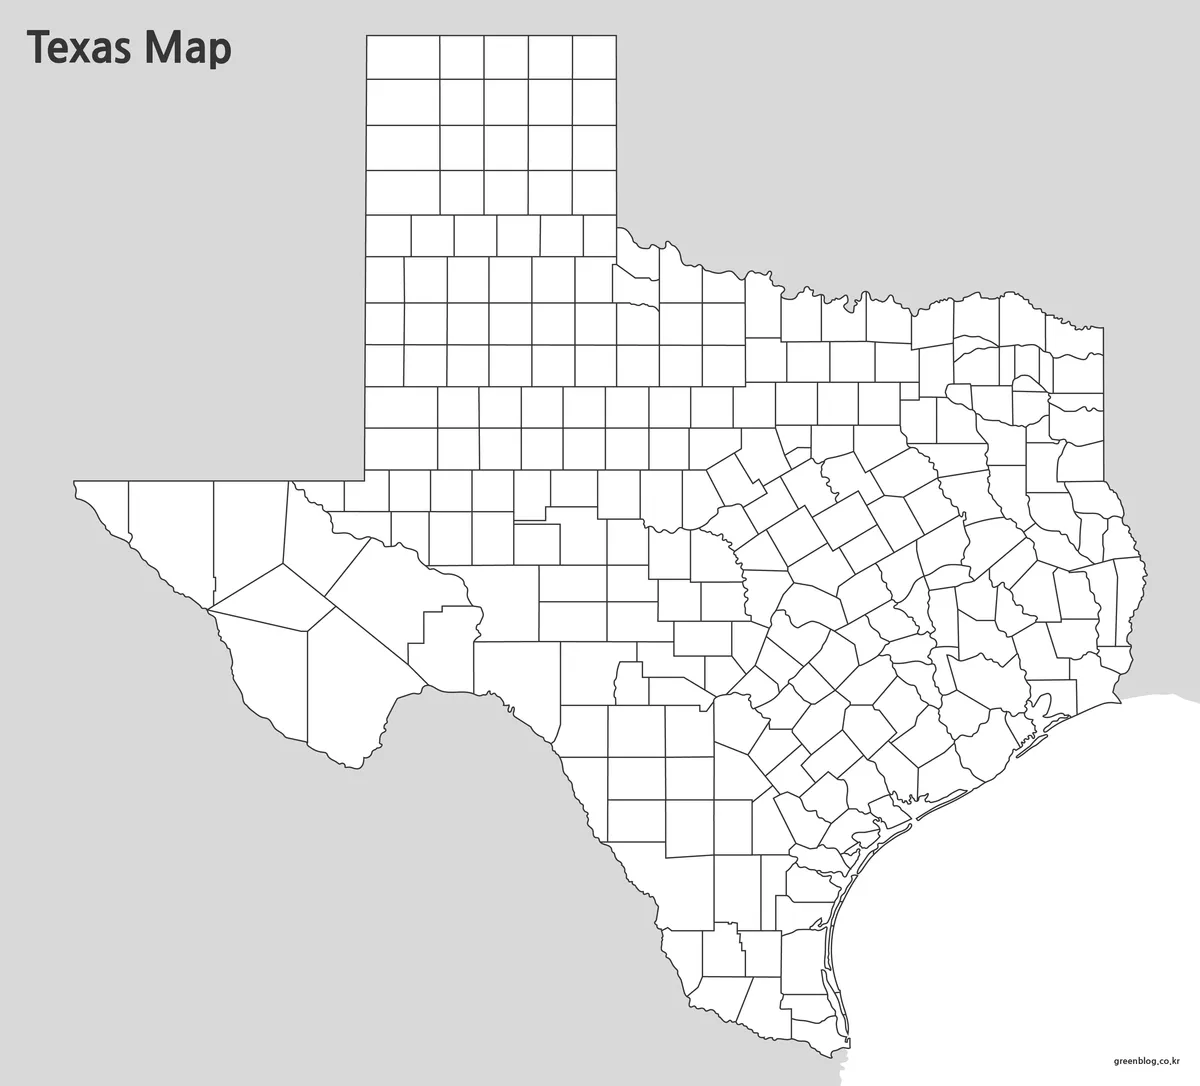
The outline strips the page back to the state silhouette and internal county divisions. It provides no answer through names or color, making it the strongest option for recall exercises, custom regional groupings, service territories, coverage diagrams, project status, or county-level statistics. Students can mark counties touching Mexico or the Gulf, reconstruct selected labels, or compare the Panhandle grid with the less regular east and south.
Although the blank Texas Map is flexible for visual annotation, it remains a raster image. It should not be treated as a coordinate-aware dataset, and tracing it does not create authoritative geometry. Surveying, legal boundaries, acreage calculations, emergency operations, and other measured spatial work require current government or professional GIS data. Here, the outline is best understood as a communication and learning base.
Choosing the Most Effective Version
Choose color when an audience must distinguish counties quickly on a screen. Choose monochrome when names need to sit inside a report, worksheet, or reference page without colored backgrounds. Choose the outline when readers will supply the content themselves. A useful classroom sequence begins with the blank sheet, checks work against a corrected labeled sheet, and then uses color to discuss border relationships or regional clusters.
Selection should follow the task, not the most decorative appearance. A presentation may benefit from immediate color separation, while a data graphic needs unobstructed space and a new legend. A county-name quiz requires no printed answers, whereas an answer key requires readable labels. The best Texas Map is the one that either reveals the needed information or leaves exactly enough room for the reader to add it.
Print and Annotation Considerations
Preserve the 1200:1086 aspect ratio during resizing so the state and county shapes are not stretched. The supplied images are near-square landscape compositions, and forcing them into a different proportion will distort boundaries and type. Before making a full classroom set or poster, print one sample and inspect Rockwall, the compact counties of North and East Texas, the Gulf Coast cluster, and the cropped title on the monochrome version.
For annotation, keep new information visually separate from the source artwork. A numbered key can prevent long labels from covering small counties; transparent symbols can preserve boundary lines; and a limited palette can keep categories distinguishable. Add a legend that states what every mark means. If the work includes dates or changing statistics, include the data period as well, because the base Texas Map does not communicate timing or source details on its own.
Label Accuracy Note Before Publication
First locate Harris County near the upper Gulf Coast and move south into the adjoining coastal county. That area should be labeled Brazoria. Angleton is the county seat, so inserting it as though it were the county name breaks the naming convention used across the sheet. The protected FAQ addresses this specific correction, and the official county-and-seat list confirms the Brazoria–Angleton pairing.
A second correction is required farther west: Irion County is spelled without the second “r,” but the named artwork reads “Iron.” The official pairing is Irion–Mertzon. Correct both named images rather than treating the color edition as the only affected copy. For classroom, editorial, or infographic use, retain a short verification note so later editors understand why the displayed labels differ from the original artwork.
These observations do not make the images suitable for legal or operational decisions. Boundaries, names, and administrative information should be checked against current authoritative material whenever precision has real-world consequences. For ordinary reference and learning, the collection remains useful once the two labels are disclosed or repaired and the Texas Map is viewed at a size that keeps its smallest county names legible.
Frequently Asked Questions
How many counties appear on the Texas Map?
The boundary framework represents Texas’s 254 counties. The color and black-and-white editions add county names, while the blank version retains only the boundaries. Because the state contains many small counties, use the full-resolution file when precise name reading is more important than a general statewide overview.
Does the map identify Austin, Houston, Dallas, and other cities?
No city symbols are shown. Austin, Houston, Dallas, and El Paso appear as county labels. Austin city is in Travis County, Houston city is primarily in Harris County, and the other familiar names must also be interpreted according to the county boundary containing the text.
Which label should replace Angleton on the county map?
Replace “Angleton” with “Brazoria.” Brazoria County lies south of Harris County along the Gulf Coast, and Angleton is its county seat. Correcting that label is recommended before using the named maps as classroom keys, published references, or county-data backgrounds.
Which Texas Map version is best for adding regions or statistics?
The blank outline provides the cleanest base for custom categories, county totals, service territories, or project coverage. Apply a consistent color scale and provide a legend. Since the file is raster-based, use an authoritative GIS source when the work requires exact spatial calculations rather than a visual summary.
Can the A3 files be reduced to A4?
They can be resized, but the smallest county names may become difficult to read. Preview Rockwall and the compact counties of North and East Texas before printing. The outline version tolerates reduction better because it contains no small text, while the labeled version benefits most from the original A3 scale.
Map File Information
The download contains the three county-map styles described above. Correct Brazoria/Angleton and Irion/Iron before using either labeled edition as a reference key.
- Included Versions: Color labeled, black-and-white labeled, blank county outline
- Intended Use: County reference, lessons, presentations, annotations, and image-based graphics
Related Maps
Additional Resources
The Texas State Library county and county-seat list provides all 254 official county names and their seats, including Brazoria–Angleton and Irion–Mertzon.
Green Map creates custom-edited map images using open geographic data sources such as geoBoundaries, Natural Earth, OpenStreetMap, and government open data. These maps are edited visual materials, not raw data files, and are provided for education, documents, presentations, and graphic reference.