Brevard County’s maps are dominated by water and wetlands, but the county also contains one of Florida’s longest urbanized coastal corridors. Wetlands account for 40.17% of the 2025 land-cover summary, developed land 23.92%, water 21.76%, agriculture 9.48%, and forest 3.63%. The Indian River Lagoon and Banana River form long blue bands through the county, while developed cover follows the Atlantic side, the lagoon shores, and the mainland settlement corridor.
Four map views are included here: general 2025 land cover, impervious/developed land, the 1985–2025 change comparison, and forest/farmland cover. The four original JPG files are available together in one ZIP download. The maps are useful for county-scale comparison, but land cover is not zoning or parcel ownership, and a wetland-colored raster cell is not a surveyed regulatory wetland boundary.
Table of Contents
Hard-surface development follows the lagoon and Atlantic settlement corridor
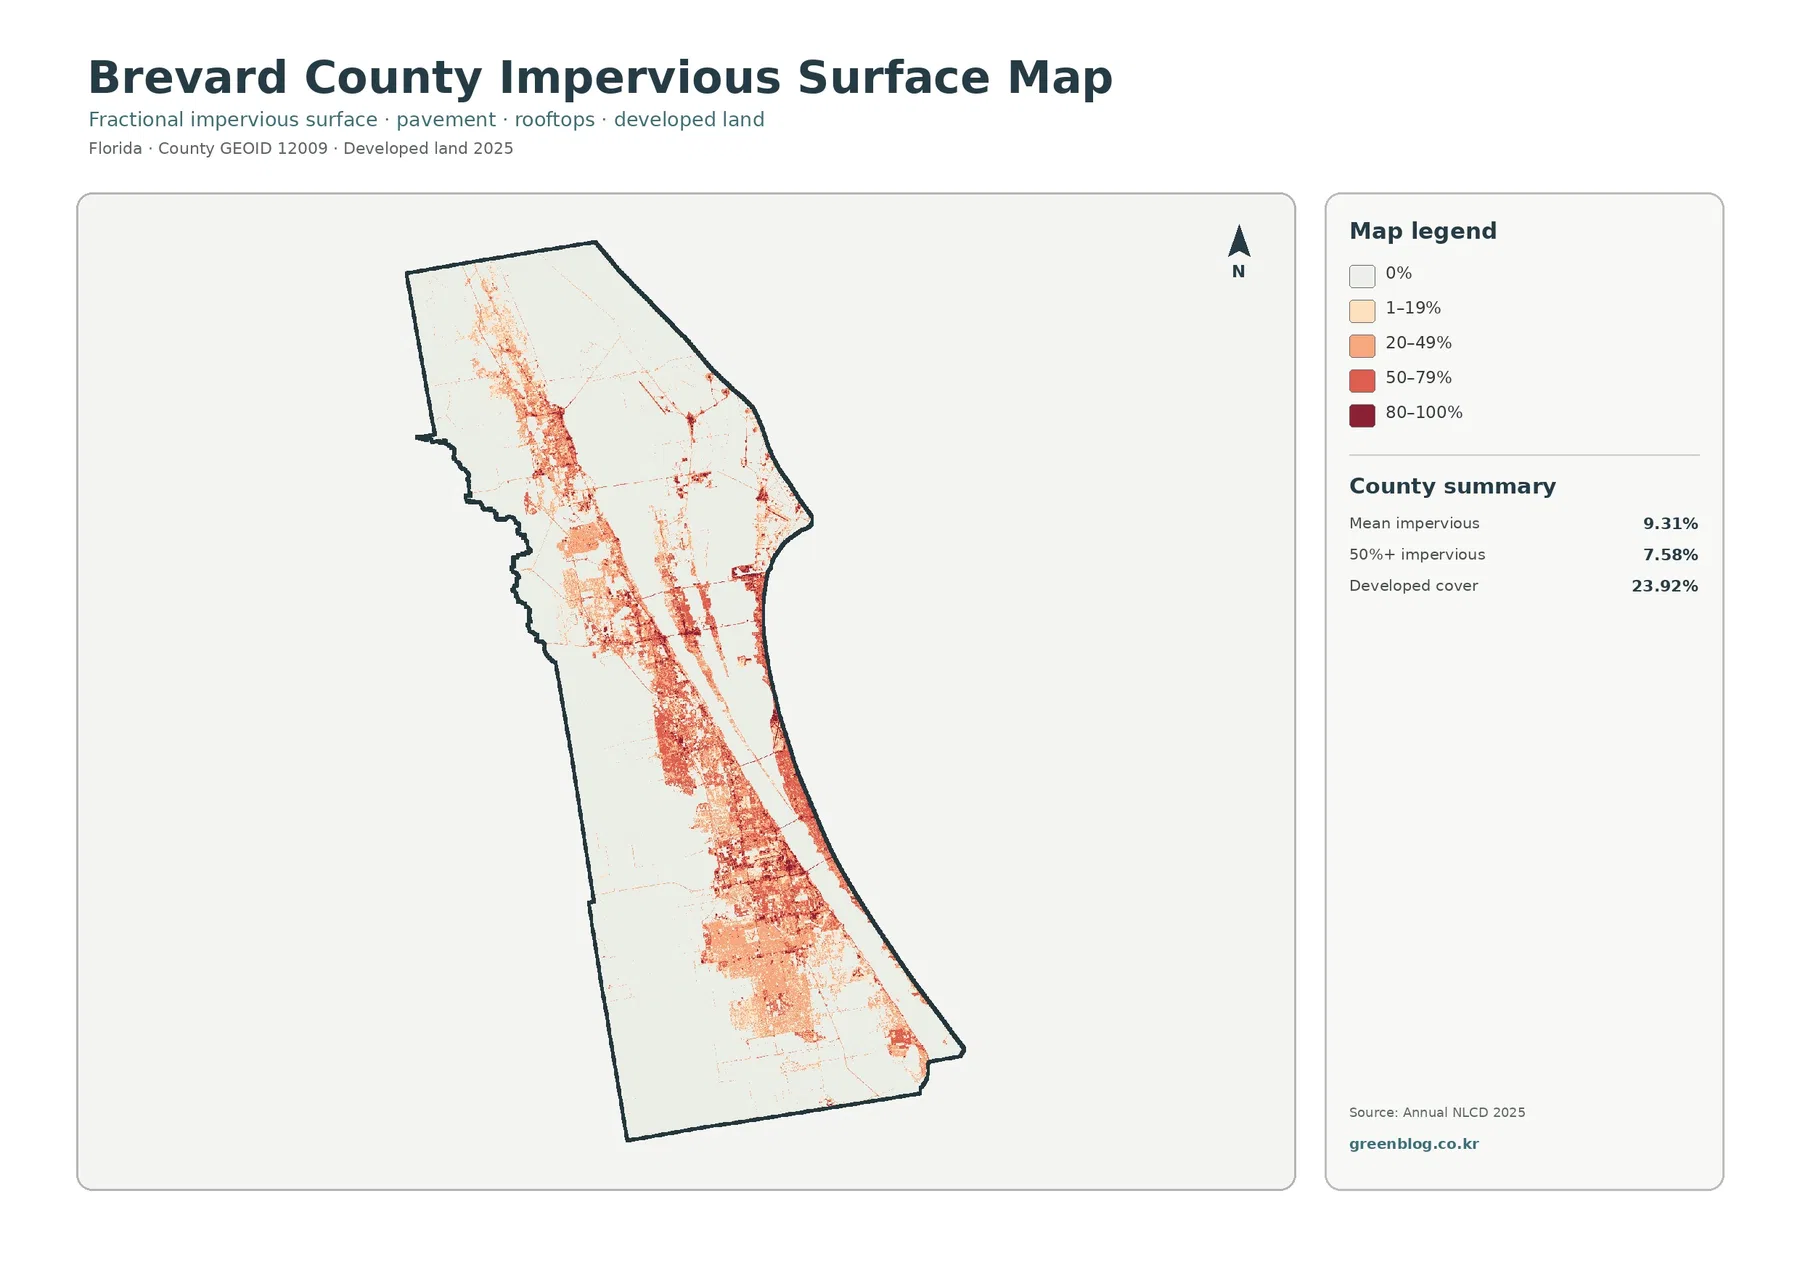
Mean impervious cover is 9.31%, and 7.58% of the county falls within cells that are at least 50% impervious. Impervious surface means pavement, parking areas, rooftops, and other hard surfaces where rainfall does not readily infiltrate. The percentage is lower than the 23.92% developed-land share because developed classes can also include lawns, trees, sandy ground, and other permeable surfaces.
The strongest hard-surface concentrations form a long north-south pattern. Darker cells appear around the Titusville area in the north, around the central mainland and Merritt Island settlements, and across the broad Melbourne–Palm Bay portion of southern Brevard. Additional concentrated development follows the barrier island and beach communities. Farther west, hard-surface cover drops quickly as the map enters the wetland-rich interior.
Brevard County’s Stormwater Program says much of the county’s urbanized land is located along the coast and barrier islands, while thousands of outfalls drain toward the Indian River Lagoon or St. Johns River systems. That local information is useful context for the impervious pattern. The map cannot calculate flood risk or nutrient loading on its own; rainfall, drainage infrastructure, soils, groundwater, and watershed boundaries are also needed.
Water and wetlands define the county before the urban pattern is considered
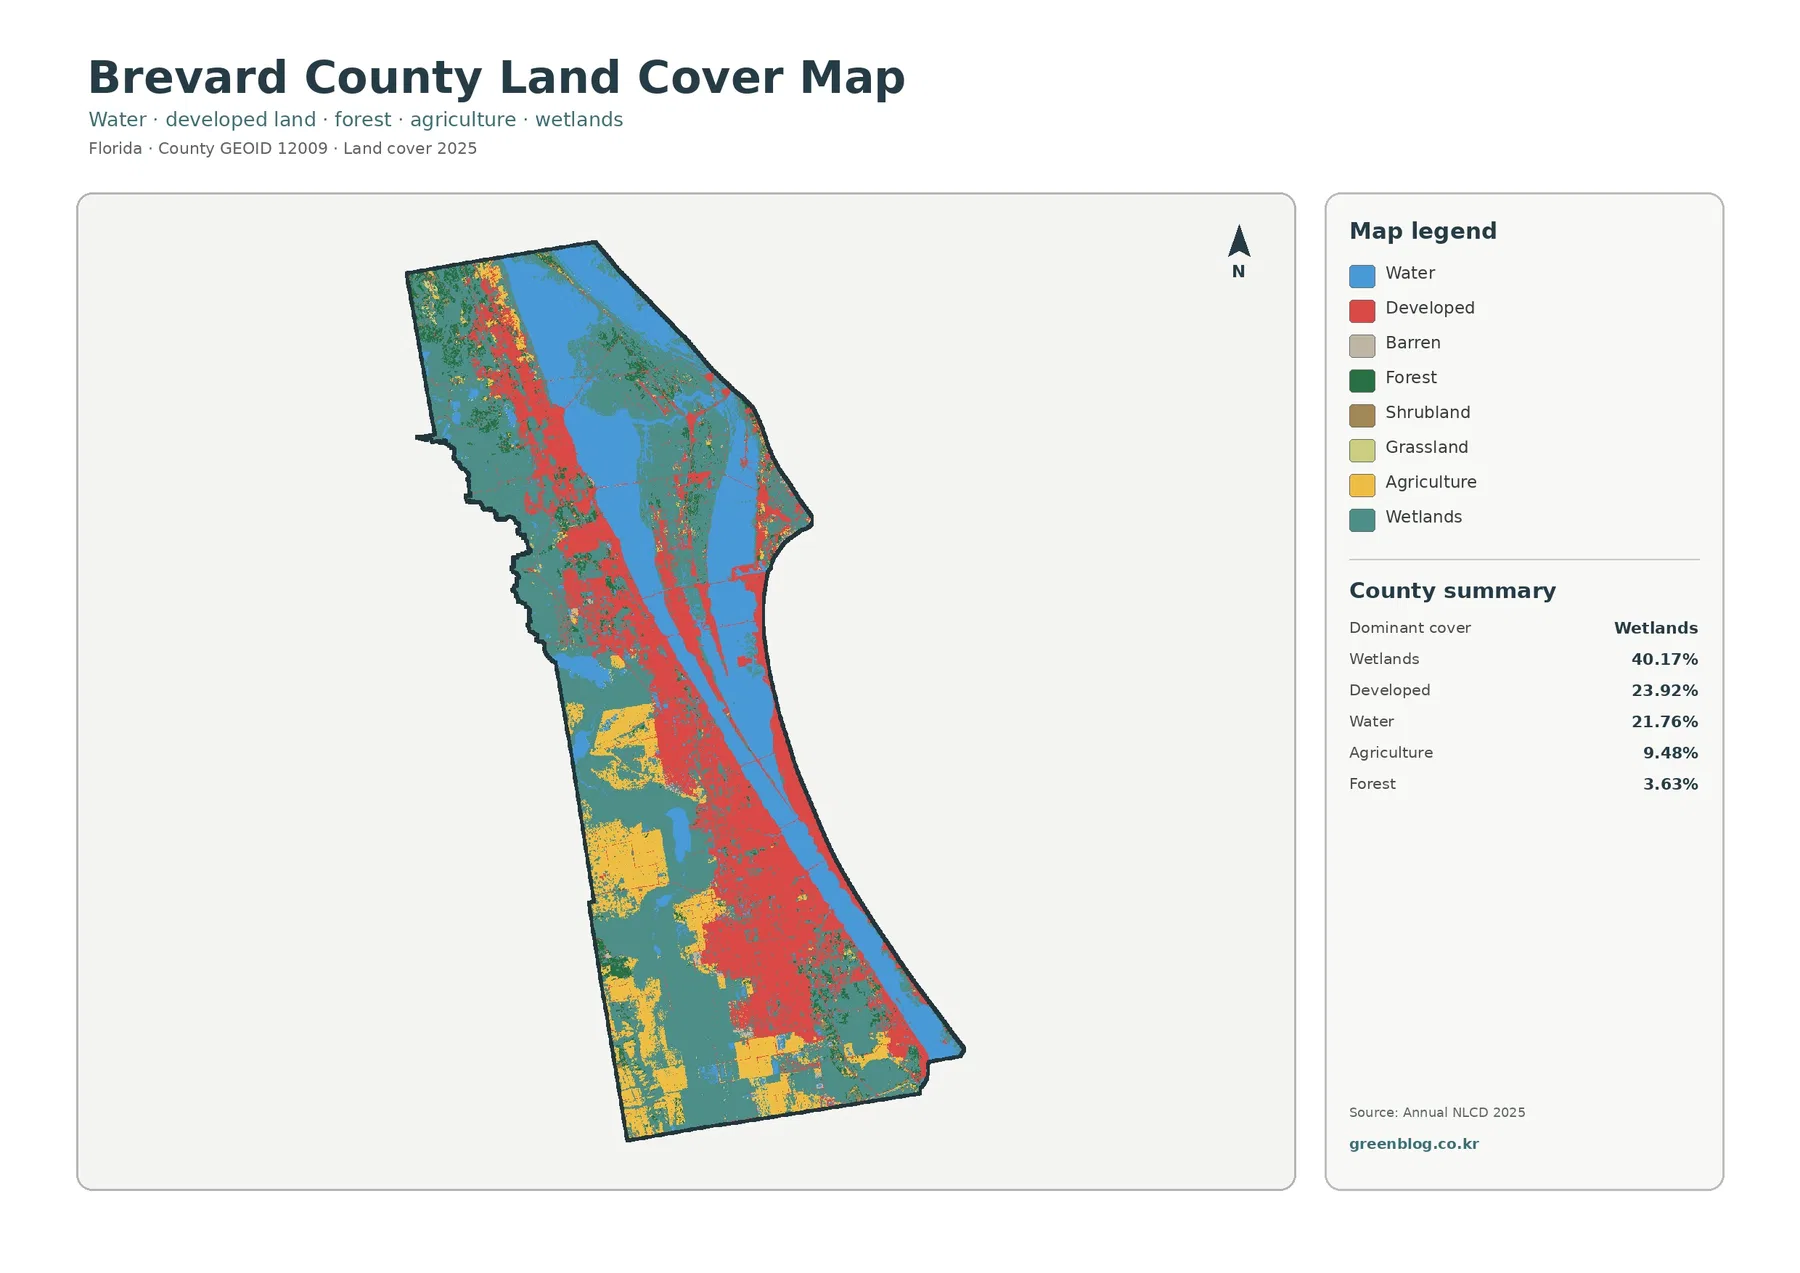
Wetlands are the largest mapped class at 40.17%. Broad teal areas fill much of western Brevard and remain prominent in the north and around the lagoon system. Water adds another 21.76%, so the blue and teal classes together dominate the county visually. The Indian River Lagoon, Banana River, coastal waters, and other open-water areas are large enough that a land-only description would miss one of the county’s most important geographic features.
Developed land at 23.92% is concentrated rather than uniform. The red classes create a long mainland urban belt, extend onto Merritt Island and the barrier island, and broaden in southern Brevard. Areas to the west contain much less continuous development. This makes a countywide percentage useful only when it is paired with location: an average for Brevard cannot describe the much denser coastal communities and the lightly developed wetland interior equally well.
Agriculture accounts for 9.48% and is most visible as large yellow blocks in the southwestern interior, with smaller patches elsewhere. Forest is only 3.63% in the county summary, yet dark-green areas remain visible in the north, along wetland edges, and in portions of Merritt Island. The small forest percentage should not be mistaken for an absence of important upland habitat because scrub, flatwoods, hammocks, and other local vegetation can fall into several mapped categories or occur in relatively narrow areas.
Merritt Island explains why habitat and space facilities appear inside the same geographic frame
Merritt Island occupies a distinctive position between the Indian River and Banana River systems. NASA’s Kennedy Space Center is located on the northern part of the island, while much of the surrounding land and water is managed as Merritt Island National Wildlife Refuge. The U.S. Fish and Wildlife Service describes a 140,000-acre refuge containing coastal dunes, saltwater marshes, managed impoundments, scrub, pine flatwoods, and hardwood hammocks.
That habitat variety helps explain the complex mixture of teal wetlands, blue water, small dark-green forest patches, and pale or developed surfaces in northern Brevard. The supplied land-cover map does not include refuge, NASA, or facility boundaries, so ownership cannot be inferred from color. A wetland pixel may lie inside or outside protected land, and a developed pixel does not identify a specific launch, transportation, or support facility.
Brevard County’s Natural Resources Management Office also manages lagoon restoration, beaches, waterways, stormwater, and environmental permitting programs. Those activities illustrate why a broad land-cover map is most useful as an orientation layer. It can show where wet, developed, and open-water surfaces meet, while the official program maps and GIS layers provide the precise project and regulatory information needed for detailed work.
The 1985–2025 comparison highlights a 6.14% shift into developed classes
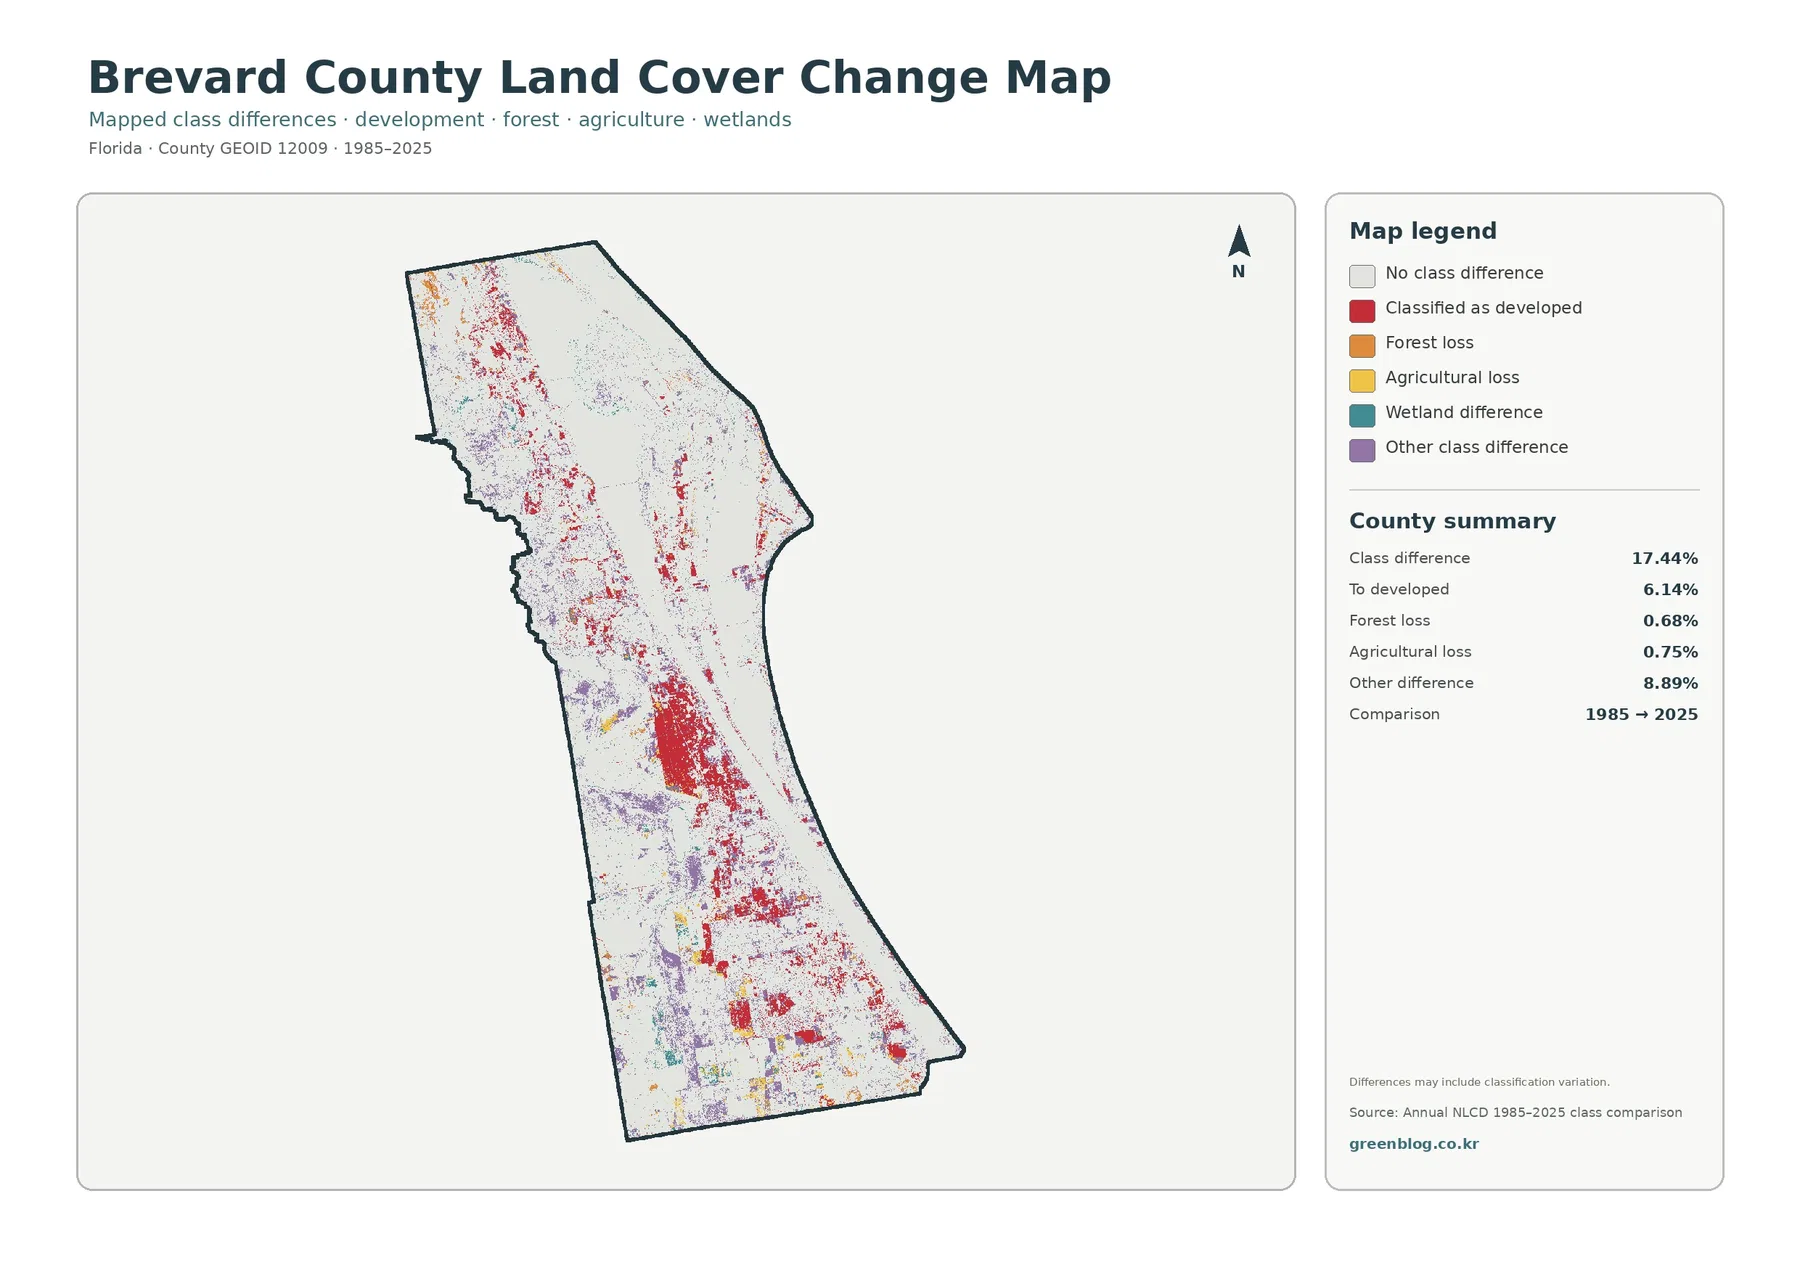
The change map reports a 17.44% class difference between 1985 and 2025. The largest named directional category is 6.14% changed to a class mapped as developed in 2025. Forest loss is 0.68%, agricultural loss 0.75%, and other class differences account for 8.89%. Red developed-change cells form major clusters in central and southern Brevard, with additional concentrations in the north and along the coastal settlement corridor.
The total 17.44% is not a 17.44% development increase. It includes every cell whose mapped class differs between the two dates. The legend also warns that class differences can include classification variation. Changes in imagery, water conditions, mixed pixels, vegetation state, and class boundaries can contribute to the result as well as real land conversion.
For a development-focused study, the 6.14% “to developed” category is the more relevant starting point, but it still should not be treated as a building-permit record. Aerial photography, parcel history, planning records, and transportation data are better suited to answering when and why a specific location changed. The raster comparison works best for identifying broad clusters that deserve that follow-up.
The simplified natural-cover view separates western agriculture from the lagoon system
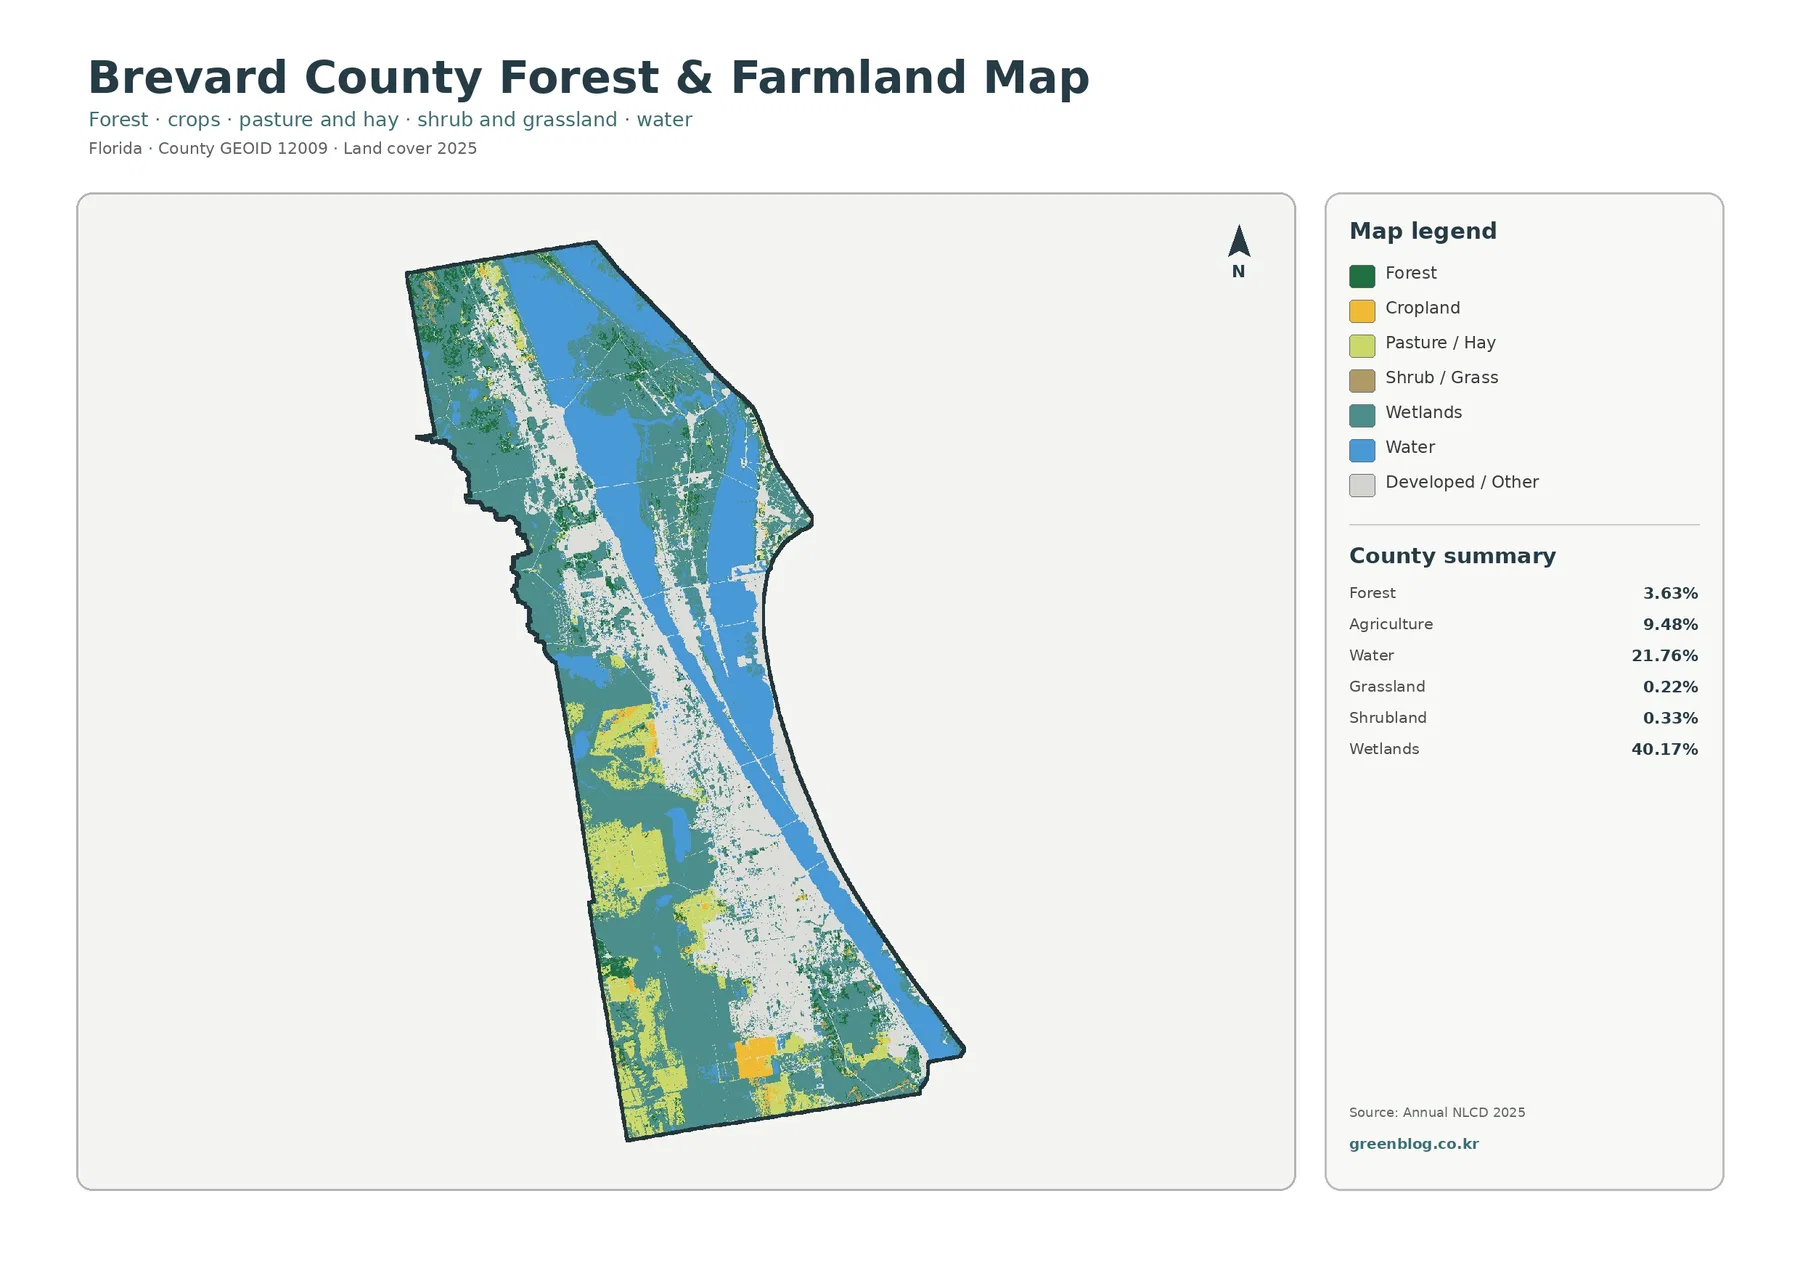
With most developed and miscellaneous cover shown as a pale background, the fourth map makes the western half of the county easier to read. Wetlands remain dominant, while agricultural cover forms large blocks in the southwest and several smaller areas farther north. The long lagoon waters remain a strong central reference. Forest, shrubland, and grassland occupy much smaller shares but still mark upland patches between wetland and developed areas.
Forest is 3.63%, grassland 0.22%, and shrubland 0.33%. Those low percentages require careful wording because Brevard contains important scrub and flatwoods habitats, especially around northern Merritt Island and conservation lands. The classification shown here groups surfaces at county scale; it is not a detailed vegetation inventory. A dark-green pixel can be described as forest, but a specific forest community should be named only from a habitat or vegetation dataset.
The agricultural share of 9.48% is also a surface estimate, not a farm census. It does not identify ownership, crop type, farm income, or agricultural zoning. Its value is geographic: the southwest contains a noticeably larger concentration of agricultural cover than the lagoon and coastal urban corridor. That pattern is useful for comparing the St. Johns-side interior with the more densely settled eastern part of the county.
Frequently Asked Questions
What is the largest land-cover class in Brevard County in 2025?
Wetlands are the largest class at 40.17%. Developed land follows at 23.92%, water at 21.76%, agriculture at 9.48%, and forest at 3.63%.
Which map best shows development intensity around the Indian River Lagoon?
The impervious-surface map is the most direct view. Brevard County averages 9.31% impervious cover, with the darkest concentrations along the mainland urban corridor, lagoon shores, and barrier-island communities.
Does the 17.44% 1985–2025 class difference mean that 17.44% of Brevard County was developed?
No. It includes all mapped class differences between the two dates. The map identifies 6.14% as changes classified as developed in 2025, and some differences may reflect classification variation.
Match the map to the question instead of treating all four as interchangeable
The general land-cover map is the best opening figure for a Brevard County profile because it introduces the large wetland share, lagoon water, coastal development, and southwestern agriculture together. The impervious map is better for discussing development intensity and stormwater. The change layer works for locating broad 1985–2025 differences, while the forest/farmland view is strongest when wetlands, agriculture, and smaller upland natural classes need to stand out.
The asset manifest records each original JPG at 2480 by 1754 pixels. The package does not mark that size as meeting its A3 high-resolution reference, so large-format printing should be tested before final production. In reports and presentations, preserve the original aspect ratio and keep the legend and County summary visible because those elements contain the class definitions and exact percentages needed to interpret the image.
Map File Information
Download the four original JPG maps in one ZIP: 2025 land cover, forest and farmland, impervious/developed land, and the 1985–2025 land-cover change comparison.
- Included Files: 4 JPG maps
Related Maps
- Alachua County Florida Land Cover Map
- Baker County Florida Land Cover Map
- Bay County Florida Land Cover Map
Thirty-meter cells and countywide summaries set the correct scale of use
Annual NLCD is designed for consistent large-area land-cover comparison and commonly uses a Landsat-based 30-meter grid. One cell can contain pavement, trees, lawn, wetland vegetation, and water at the same time. The land-cover product assigns a representative class, while the impervious product estimates hard-surface percentage. Zooming the exported image cannot create parcel-level precision that was absent from the source raster.
The general land-cover, forest/farmland, and impervious maps describe 2025 conditions. The change layer compares 1985 with 2025. New construction, restoration work, shoreline changes, storm impacts, or habitat management after that observation period may not appear. Projects that require current conditions should pair these maps with recent aerial imagery and Brevard County’s current GIS or natural-resource information.
Every percentage shown here is countywide. Wetlands at 40.17%, developed land at 23.92%, and mean impervious cover at 9.31% are not separate values for Titusville, Cocoa, Melbourne, Palm Bay, Merritt Island, or the barrier island. Municipal, watershed, refuge, or parcel statistics require the original raster to be recalculated with the correct boundary.
Sources and reference material
- MRLC Annual NLCD Data – source land-cover and impervious data
- USGS Annual NLCD Land Cover Classification – class definitions and interpretation
- U.S. Census Bureau TIGER/Line Shapefiles – county-boundary reference
- Brevard County Natural Resources Management – lagoon, beach, wetland, stormwater, and environmental-resource context
- Brevard County Stormwater Program – Indian River Lagoon, St. Johns River, and urban runoff context
- Merritt Island National Wildlife Refuge – wetland, scrub, flatwoods, and coastal habitat context
Green Map creates custom-edited map images using open geographic data sources such as geoBoundaries, Natural Earth, OpenStreetMap, and government open data.
These maps are edited visual materials, not raw data files, and are provided for education, documents, presentations, and graphic reference.