Water and wetlands shape Bay County’s 2025 land-cover pattern more strongly than any single urban feature. Wetlands are the largest class at 36.73%, while developed land accounts for 16.23%, forest 14.44%, water 13.00%, and grassland 9.94%. St. Andrews Bay occupies a large part of the southern county, and the strongest developed areas wrap around the bay and continue west along the Gulf coast. Farther inland, wetland, forest, grassland, and shrub cover become much more prominent.
The page includes four map views: 2025 land cover, forest and farmland, impervious/developed land, and a 1985–2025 class-change comparison. The WebP versions make it easy to compare the patterns online, and the four original JPG maps are available together in one ZIP download. These are land-cover maps, so they describe the physical surface rather than zoning, parcel ownership, development rights, or a surveyed wetland boundary.
Table of Contents
A broad bay and coastal settlement belt divide the county’s southern landscape
St. Andrews Bay is the dominant geographic shape in the southern half of the map. Developed cover is concentrated around its shores, while long urban bands also follow the western Gulf coast. Bay County’s official municipal layers identify Panama City, Panama City Beach, Lynn Haven, Callaway, Parker, Springfield, and Mexico Beach, among other mapped areas. Comparing those official boundaries with the land-cover image helps explain why the largest red clusters form around the bay instead of being spread evenly across the county.
The northern extension and much of the inland west look very different. Wetlands, forest, shrubland, and grassland occupy large connected areas, and major developed clusters become sparse. This creates a useful contrast for a county profile: Bay County is not simply a coastal urban strip, nor is it only a wetland and forest landscape. The two patterns meet around the same water system, making the county particularly useful for comparing development intensity with coastal and inland natural cover.
Bay County’s current comprehensive-planning page says the plan includes future land-use designations, service areas, special treatment zones, military influence areas, and strategies for environmental-resource conservation. That planning framework should remain separate from the NLCD classes. A red developed pixel describes a mapped surface in 2025; it does not automatically mean the parcel has a particular zoning category. The county’s BayView GIS is the better source for those administrative questions.
Impervious cover reveals where the coastal urban footprint is most intense
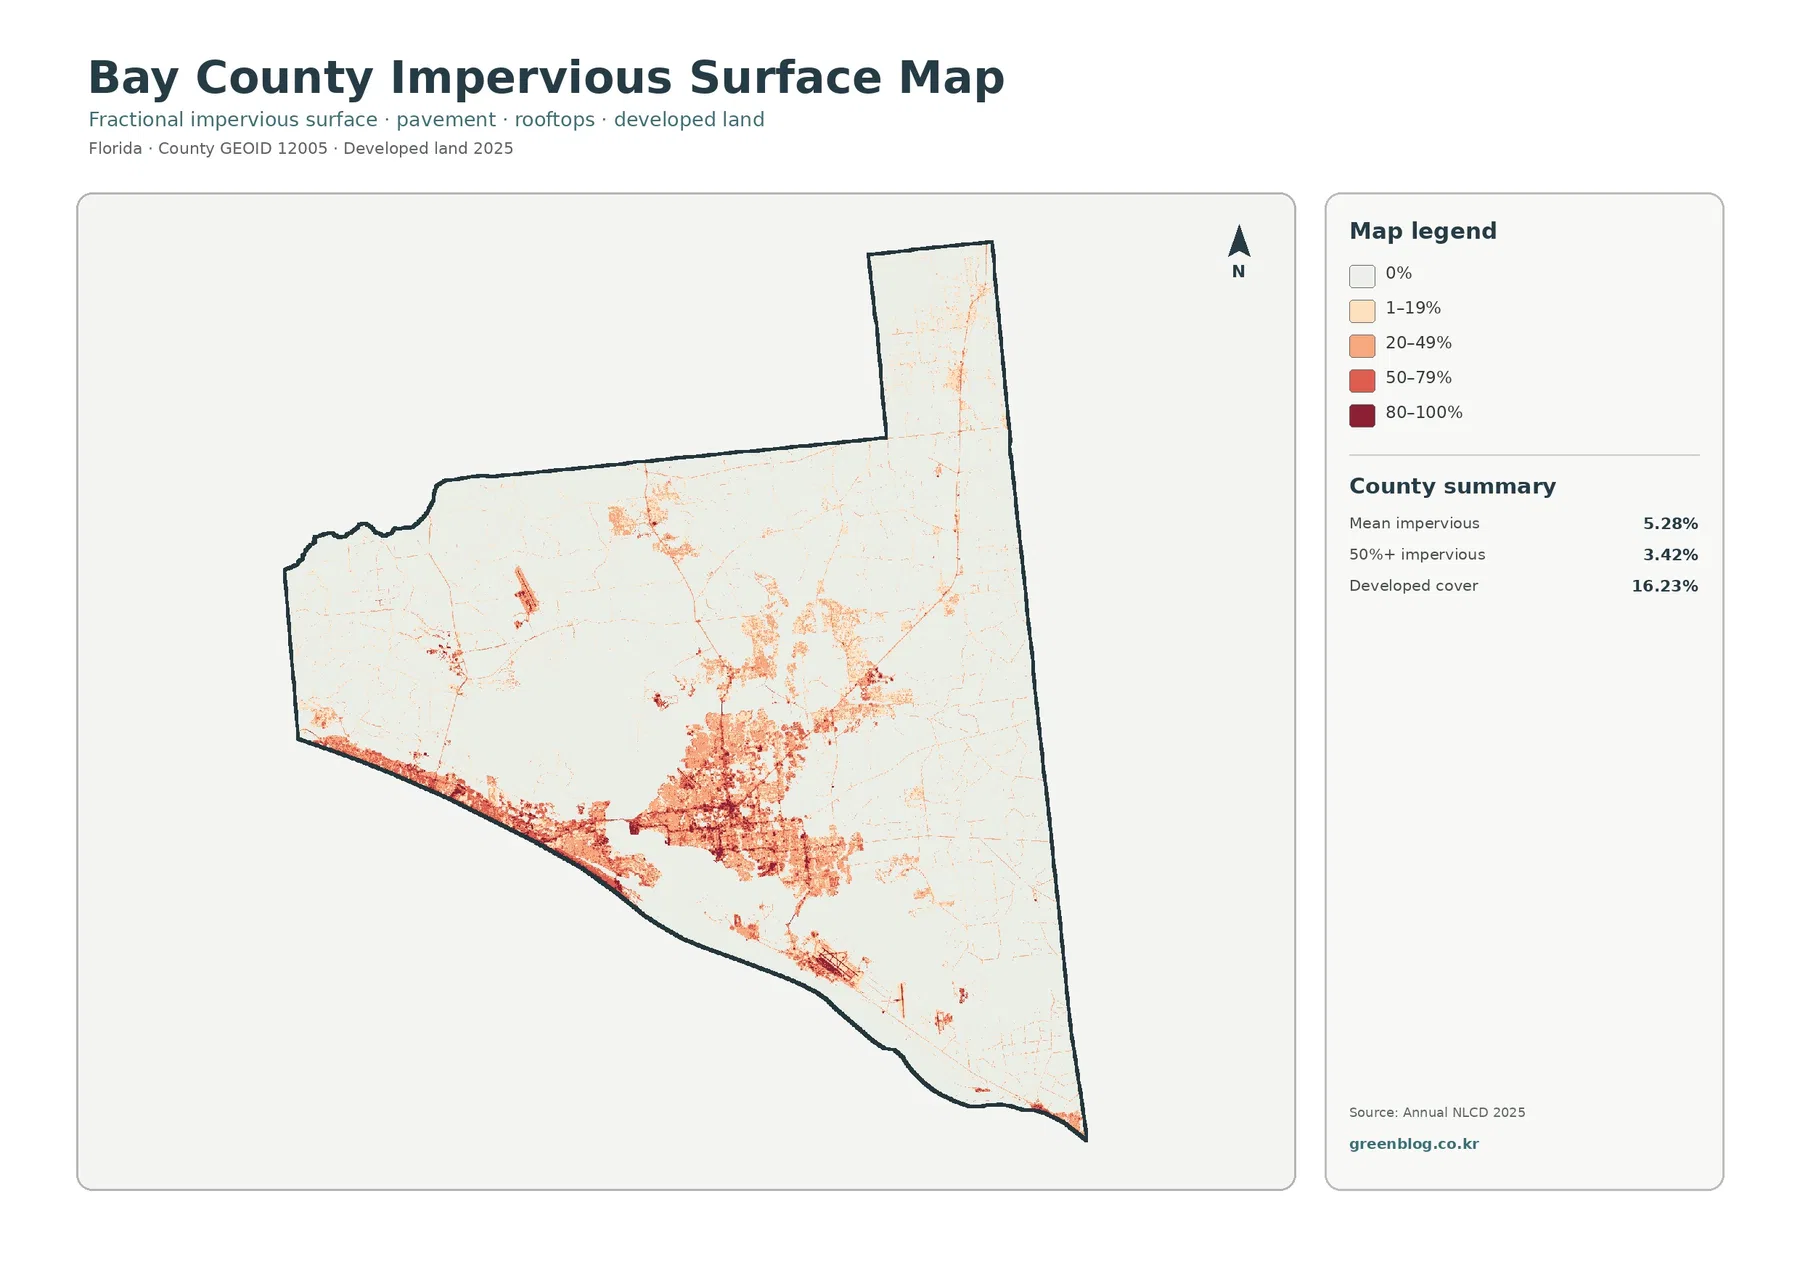
Impervious surface means pavement, parking areas, rooftops, and other hard surfaces where rainfall does not readily soak into the ground. Bay County’s mean impervious cover is 5.28%, and 3.42% of the county falls within cells that are at least 50% impervious. Those values are well below the 16.23% developed-land share because developed classes can include lawns, trees, bare soil, and other permeable surfaces. The two statistics are related, but they answer different questions.
The darkest impervious concentrations surround St. Andrews Bay and extend along the western coast. A large central-southern cluster corresponds broadly with the Panama City area, while a long coastal band follows the Panama City Beach side of the county. Additional concentrations appear around communities east of the bay and along several inland corridors. By contrast, most of the north and western interior remain pale, which keeps the countywide mean relatively modest despite a substantial coastal urban area.
This map is especially useful when the subject is development intensity, stormwater context, or the difference between a developed land class and a hard-surface estimate. It is not a street map. Individual roads and municipal limits are not labeled, so a project that needs precise locations should use Bay County’s GIS after identifying the broad pattern here. The county’s BayView map includes roads, parcels, land-use designations, and municipal information that can provide that next level of detail.
Wetlands lead the 2025 land-cover summary at 36.73%
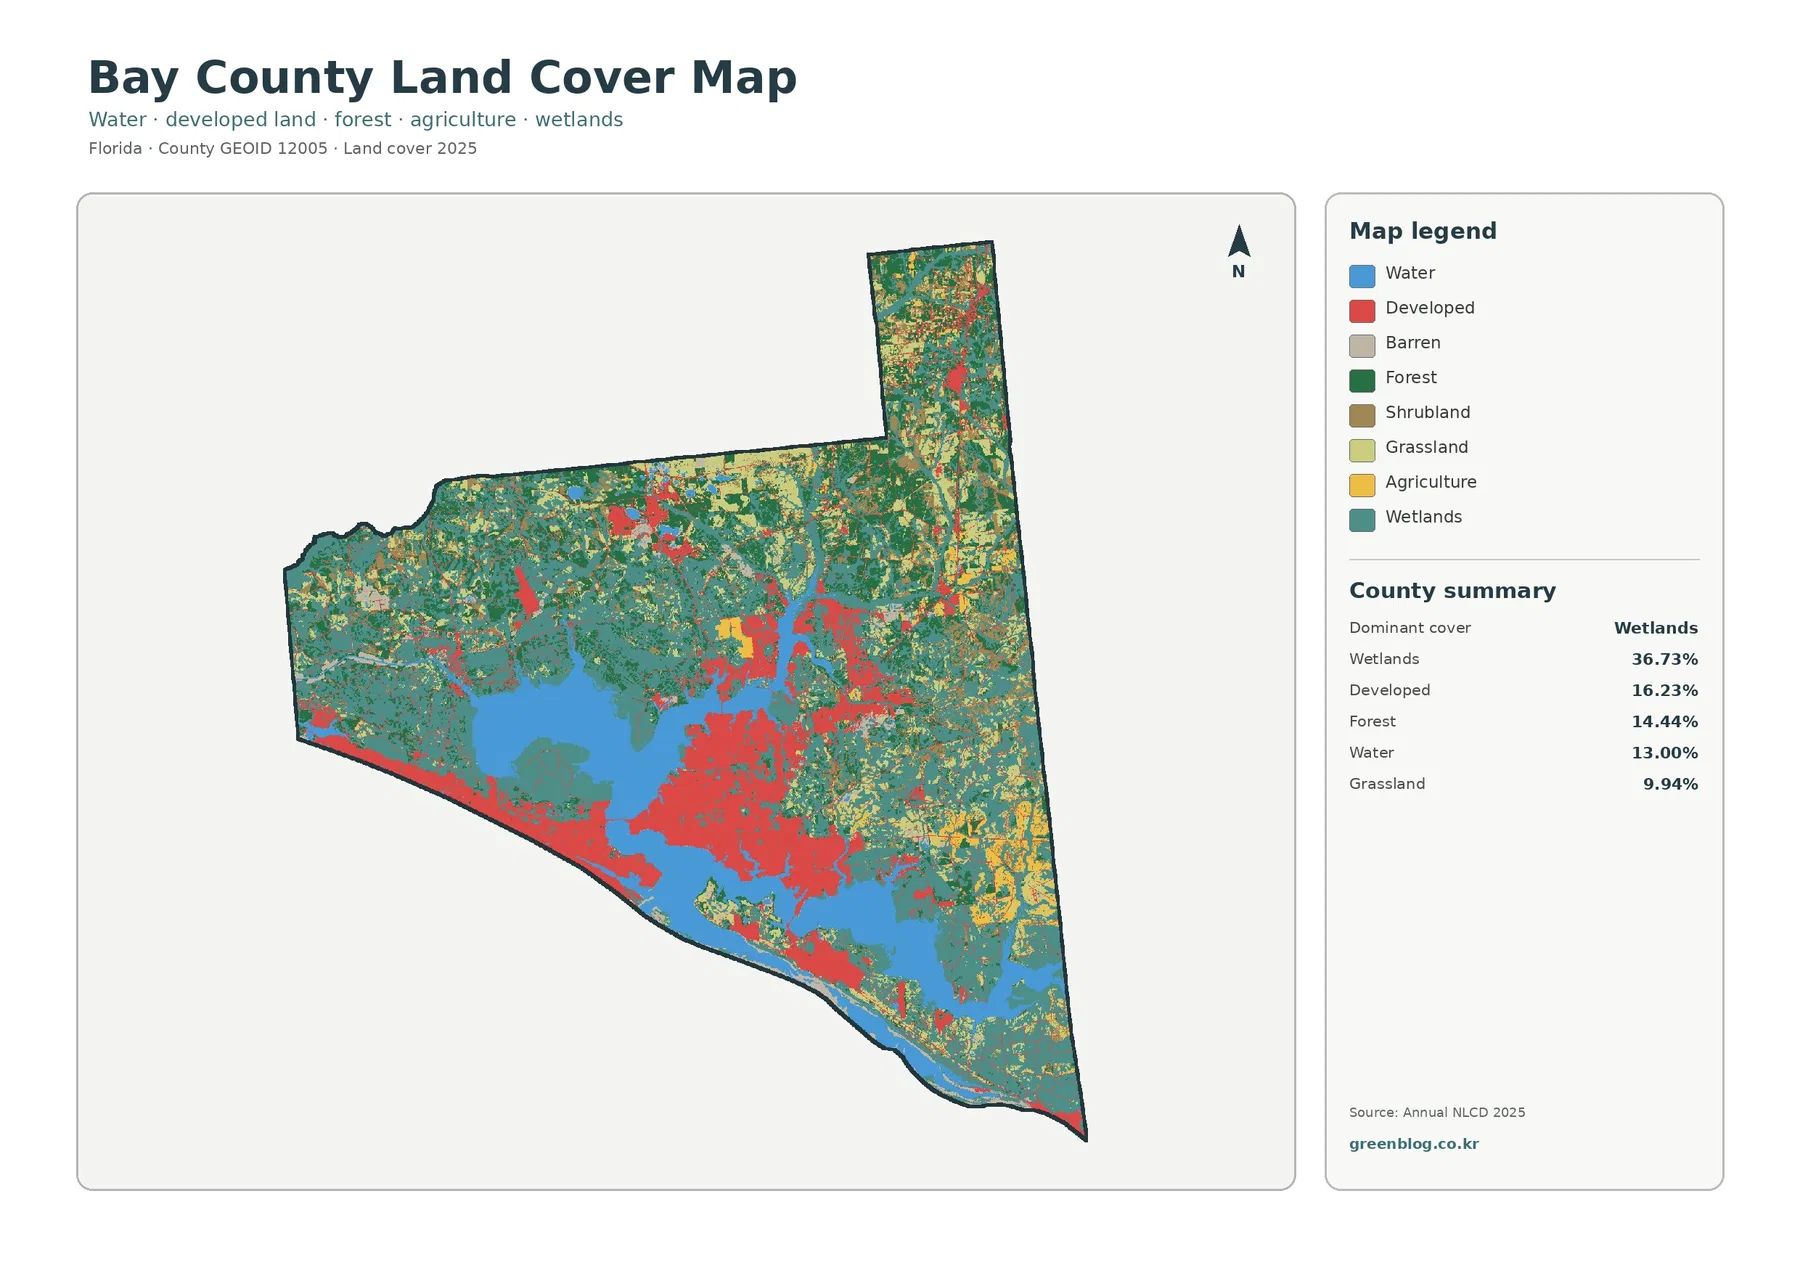
Wetlands occupy 36.73% of the county, making them the dominant mapped class by a wide margin. Teal cover appears throughout the western interior, around broad low-lying areas near the bay system, and across much of the northern county. Forest at 14.44% repeatedly borders and breaks up those wetland areas. The map therefore shows a mosaic rather than a clean boundary between “wetland country” and “forest country,” which is typical of a low-relief coastal landscape with many water-connected environments.
Developed land is the second-largest class at 16.23%, but it is much more concentrated spatially. The large red areas around the bay and coast occupy a smaller share of the county than the broad wetland background. Water itself covers 13.00%, a notably high value that reflects the large bay and coastal waters included inside the county boundary. Grassland contributes another 9.94%, while shrubland reaches 6.06% and agriculture only 1.69%.
Agriculture’s small share makes Bay County different from Florida counties where large crop or pasture blocks dominate inland land cover. Here, open land is more often mapped as grassland or shrubland than agriculture. That distinction is visible in the eastern and northern interior, where yellow agricultural patches are limited compared with green, teal, tan, and light-green natural or semi-open classes. Countywide percentages should not be used as municipal statistics because the supplied image does not contain separate city-level summaries.
The forest-and-farmland view puts inland wetlands, grassland, and shrub cover in the foreground
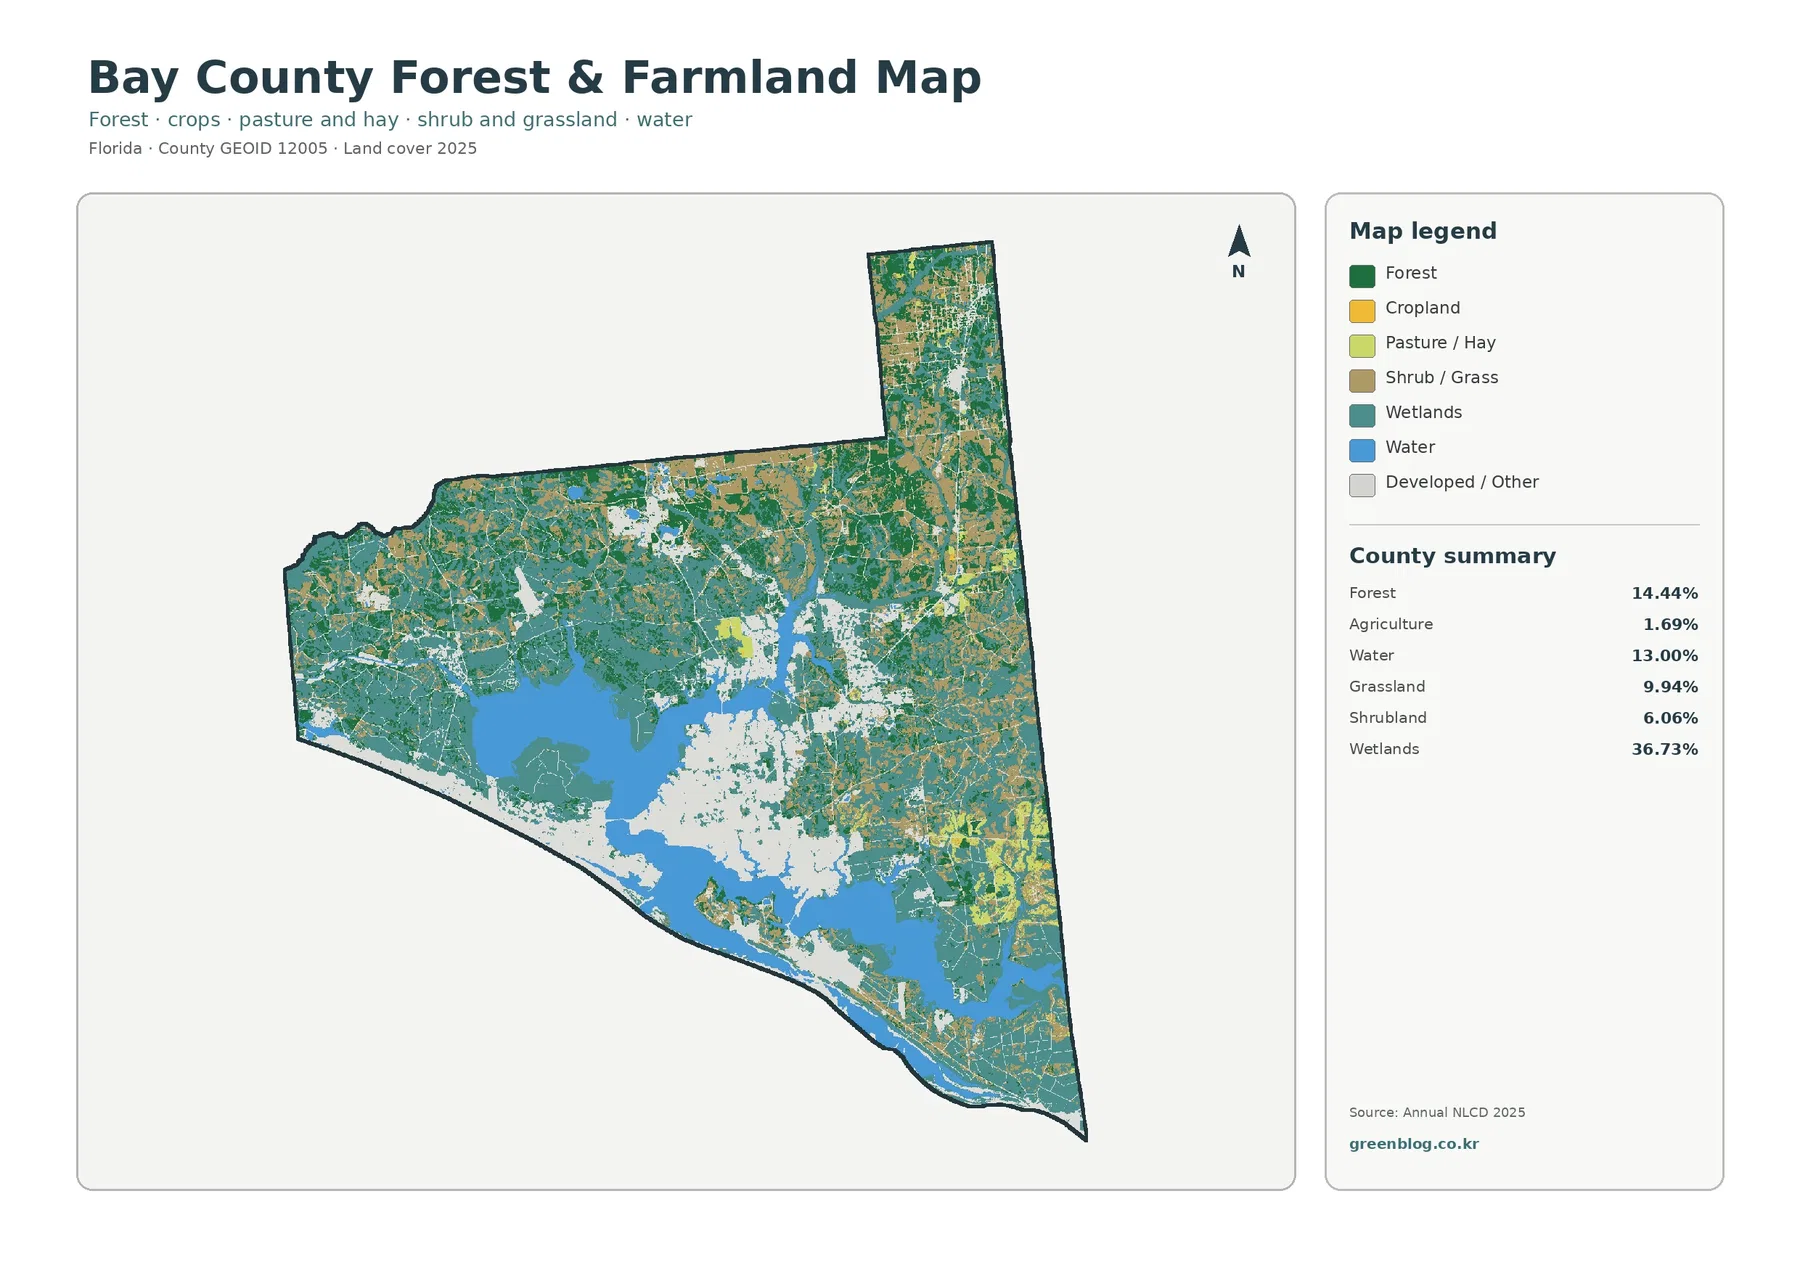
With most developed and miscellaneous cover pushed into a pale background, the second map makes the inland landscape easier to compare. Wetlands remain the largest visual component. Forest occupies sizable blocks around them, while grassland and shrubland fill many of the drier openings. Agriculture is only a minor element at 1.69%, appearing as scattered yellow patches rather than a continuous farm belt. The map is therefore most useful for discussing natural-cover variety rather than farmland alone.
The coastal urban belt becomes a large pale opening around St. Andrews Bay and along the Gulf, which makes the surrounding wetlands and water even more obvious. This is a useful image for explaining how quickly the county transitions from dense settlement to wetland, forest, and open cover. It can also help identify areas where a more detailed habitat, conservation, or hydrology layer might be worth consulting. The colors do not indicate ownership, public access, or protected status.
Florida DEP’s Bay County coastal material provides local ecological context for the southern landscape. It describes St. Andrews State Park as an area of beaches, dunes, marshes, and flatwood pine forest between the Gulf and St. Andrews Bay, and it identifies St. Andrews Aquatic Preserve as an estuarine environment with salt marshes and seagrass beds. Those descriptions support the broad coastal mosaic visible on the maps without implying that every NLCD pixel represents a specific named habitat.
The 1985–2025 comparison is extensive, with a 31.72% class difference
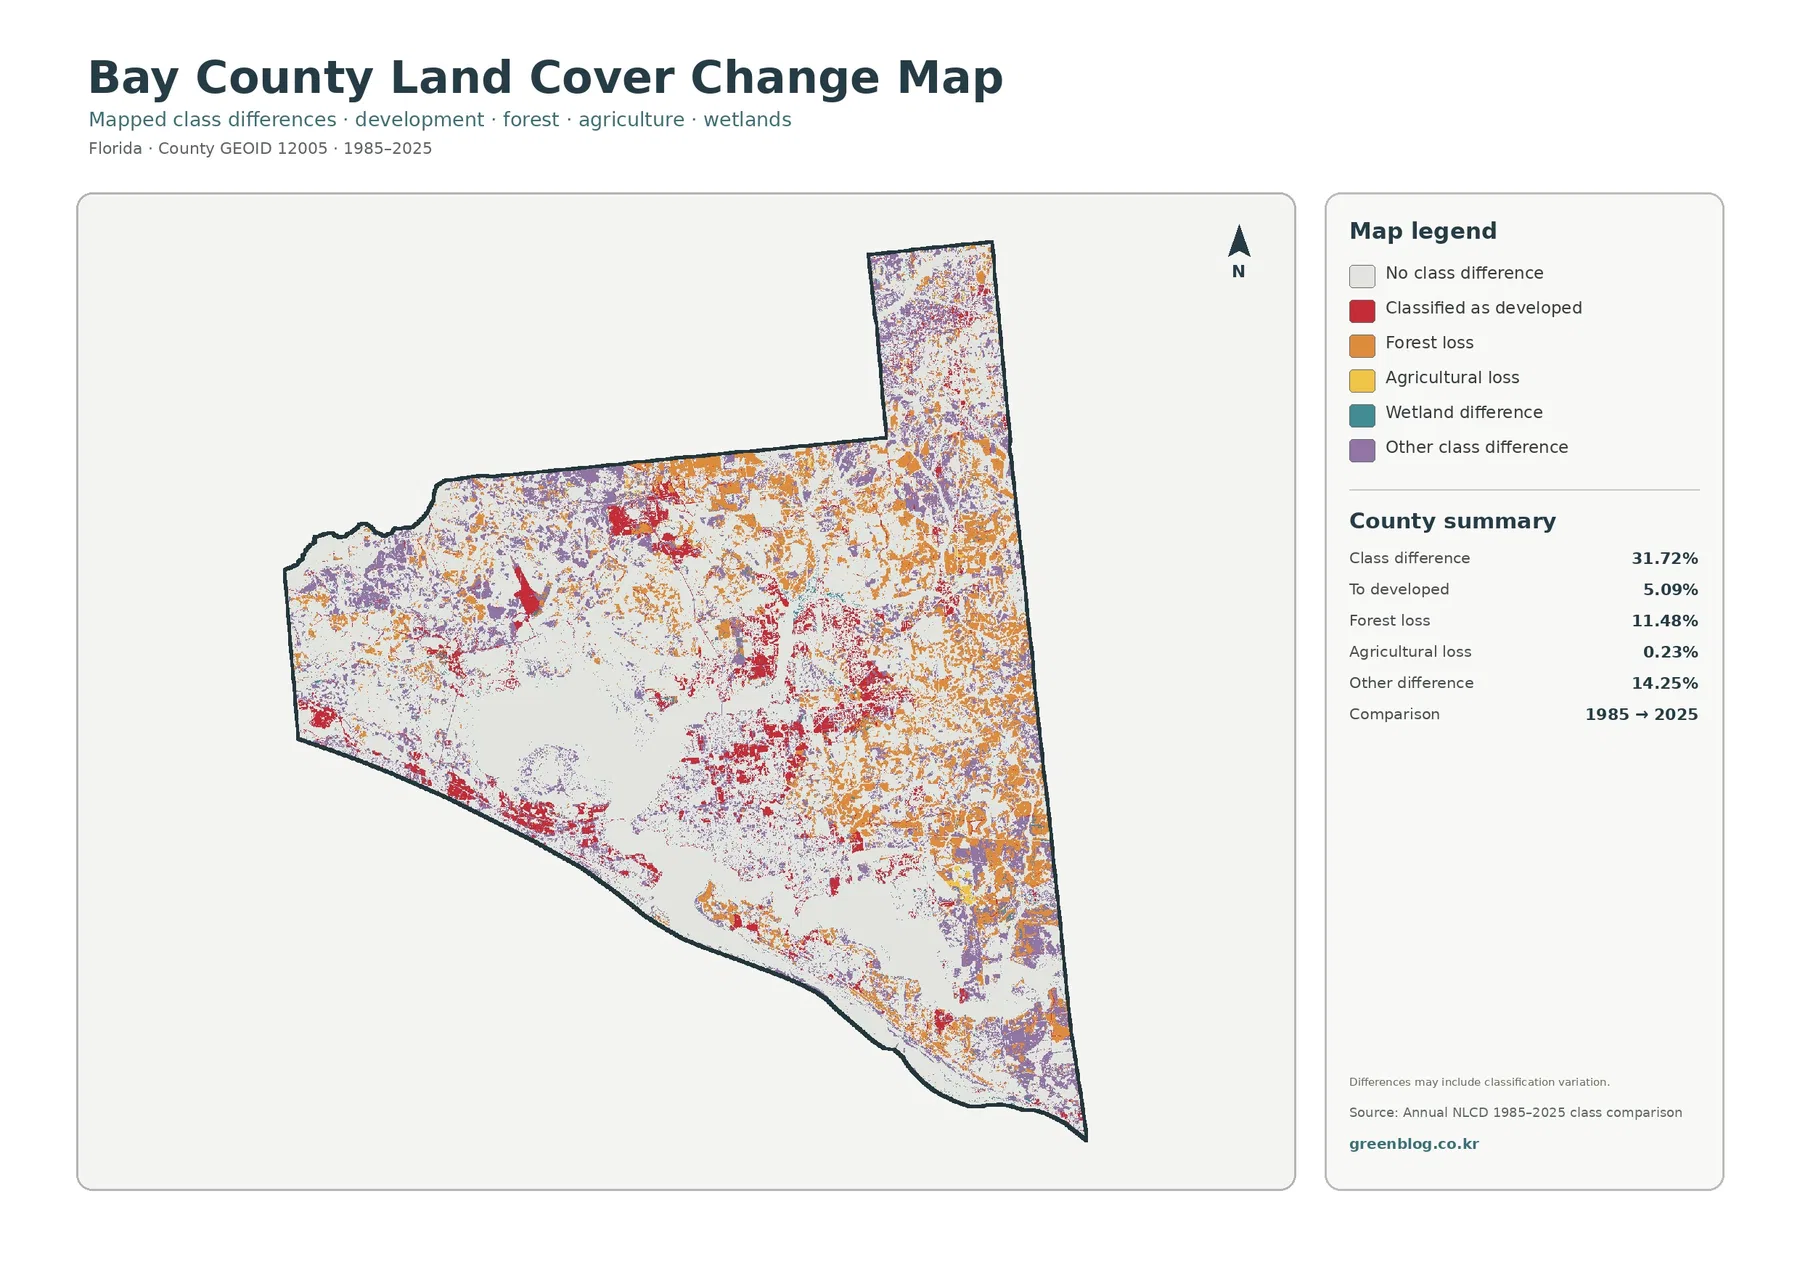
The change layer reports that 31.72% of cells have a different mapped land-cover class in 2025 than in 1985. Forest loss is 11.48%, change to a class mapped as developed in 2025 is 5.09%, agricultural loss is 0.23%, and other class differences account for 14.25%. Orange forest-loss cells are widespread in the eastern and northern portions of the county, while red developed-change areas concentrate more strongly around the bay, the Gulf coast, and several inland settlement clusters.
The total 31.72% should not be interpreted as a 31.72% development increase. It combines every mapped class difference between the two dates. Real changes can be mixed with classification variation caused by imagery, mixed pixels, or subtle shifts between water, wetlands, forest, grass, and developed classes. Readers interested specifically in urban expansion should focus on the 5.09% “to developed” category, and even that number is a land-cover comparison rather than a building-permit history.
Forest loss at 11.48% is the largest named change category. The distribution is broad enough that one explanation would be inappropriate. Development, timber activity, storm disturbance, wetland or vegetation change, restoration, and classification differences can all affect the mapped result. The strongest use of this map is to locate change clusters for follow-up with aerial imagery or local records instead of assigning a cause from the color alone.
St. Andrews Bay adds an unusually large water component to the county map
Water makes up 13.00% of the 2025 county summary, and the reason is visually obvious: St. Andrews Bay and connected coastal waters occupy a large area within the county boundary. This water-centered geography separates several developed shores and creates long interfaces between settlement, wetlands, and open water. In a report, keeping the bay visible is important because cropping the map to the land-only portion would remove one of the county’s defining land-cover relationships.
Bay County’s coastal-management policies emphasize protection of coastal wetlands, coastal barriers, wildlife habitat, and other remaining coastal resources. Florida DEP also describes St. Andrews Aquatic Preserve as a fragile and diverse estuarine system. The land-cover maps are useful for seeing the broad location of wet and developed surfaces before moving to those official management resources. Regulatory boundaries, conservation ownership, and aquatic-preserve limits should always come from the appropriate official layers.
That distinction is particularly important in a county where urban development, military land, beaches, wetlands, and water occur near one another. Bay County GIS includes municipal boundaries and other planning layers, and its map gallery provides zoning, future land use, flood-zone, storm-surge, and planning-consideration maps. Combining those sources with the land-cover images produces a much clearer picture than asking one raster map to answer every planning or environmental question.
Choose the map based on whether the question is cover, development intensity, or change
The general land-cover map works best as the first figure in a Bay County profile because it keeps the bay, wetlands, developed shoreline, forest, and open land in one view. The forest-and-farmland map is better for natural-cover comparison, especially where wetlands, grassland, shrubland, and forest need to stand out. The impervious layer is the clearest choice for urban intensity. For a time comparison, the change map should follow a 2025 map so the reader understands the current pattern before interpreting the 1985–2025 differences.
The asset manifest records each original JPG at 2480 by 1754 pixels. The package does not mark that size as meeting its A3 high-resolution reference, so large-format printing should be tested before final production. For reports and presentations, preserve the aspect ratio and keep the legend and County summary visible. Removing those elements can separate the map from the percentages and class definitions needed for a correct interpretation.
Thirty-meter cells and countywide percentages limit how far the maps can be zoomed conceptually
Annual NLCD is designed for consistent large-area comparison and commonly uses a Landsat-based 30-meter grid. One cell can contain trees, pavement, grass, wet ground, and water at the same time. The land-cover product assigns a representative class, while the impervious product estimates the share of hard surface. Enlarging the image cannot create parcel-level detail that was not present in the original raster.
The land-cover, forest-and-farmland, and impervious views describe 2025 conditions, while the change map compares 1985 with 2025. Development, shoreline work, vegetation change, or storm recovery after the observation period may not appear. Projects that require the latest condition should pair these maps with recent aerial imagery and Bay County’s current GIS and planning information.
Every percentage shown here is countywide. The 36.73% wetland share, 16.23% developed share, and 5.28% mean impervious value are not separate statistics for Panama City, Panama City Beach, Lynn Haven, or any other municipality. Smaller-area figures require the original raster clipped to the correct municipal, watershed, park, or parcel boundary.
Frequently Asked Questions
What is the largest land-cover class in Bay County in 2025?
Wetlands are the largest class at 36.73%. Developed land follows at 16.23%, forest at 14.44%, water at 13.00%, and grassland at 9.94%.
Which map is best for comparing development around St. Andrews Bay?
The impervious-surface map is the clearest view of development intensity. Bay County averages 5.28% impervious cover, with the strongest concentrations around the bay and western Gulf coast. Municipal boundaries should be checked in Bay County GIS.
Does the 31.72% 1985–2025 class difference mean that 31.72% of Bay County was developed?
No. It is the share of cells with a different mapped land-cover class between the two dates. The map identifies 5.09% as changes classified as developed in 2025, and some differences may include classification variation.
Sources and reference material
- MRLC Annual NLCD Data – source land-cover and impervious data
- USGS Annual NLCD Land Cover Classification – class definitions and interpretation
- U.S. Census Bureau TIGER/Line Shapefiles – Bay County boundary reference
- Bay County GIS – BayView, parcels, land-use designations, and municipal context
- Bay County Comprehensive Planning – future land use and environmental-resource planning
- Florida DEP Bay County Coastal Access Guide – St. Andrews Bay and coastal environmental context
Map File Information
Download the four original JPG maps in one ZIP: 2025 land cover, forest and farmland, impervious/developed land, and the 1985–2025 land-cover change map.
- Included Files: 4 JPG maps
Related Maps
Green Map creates custom-edited map images using open geographic data sources such as geoBoundaries, Natural Earth, OpenStreetMap, and government open data.
These maps are edited visual materials, not raw data files, and are provided for education, documents, presentations, and graphic reference.