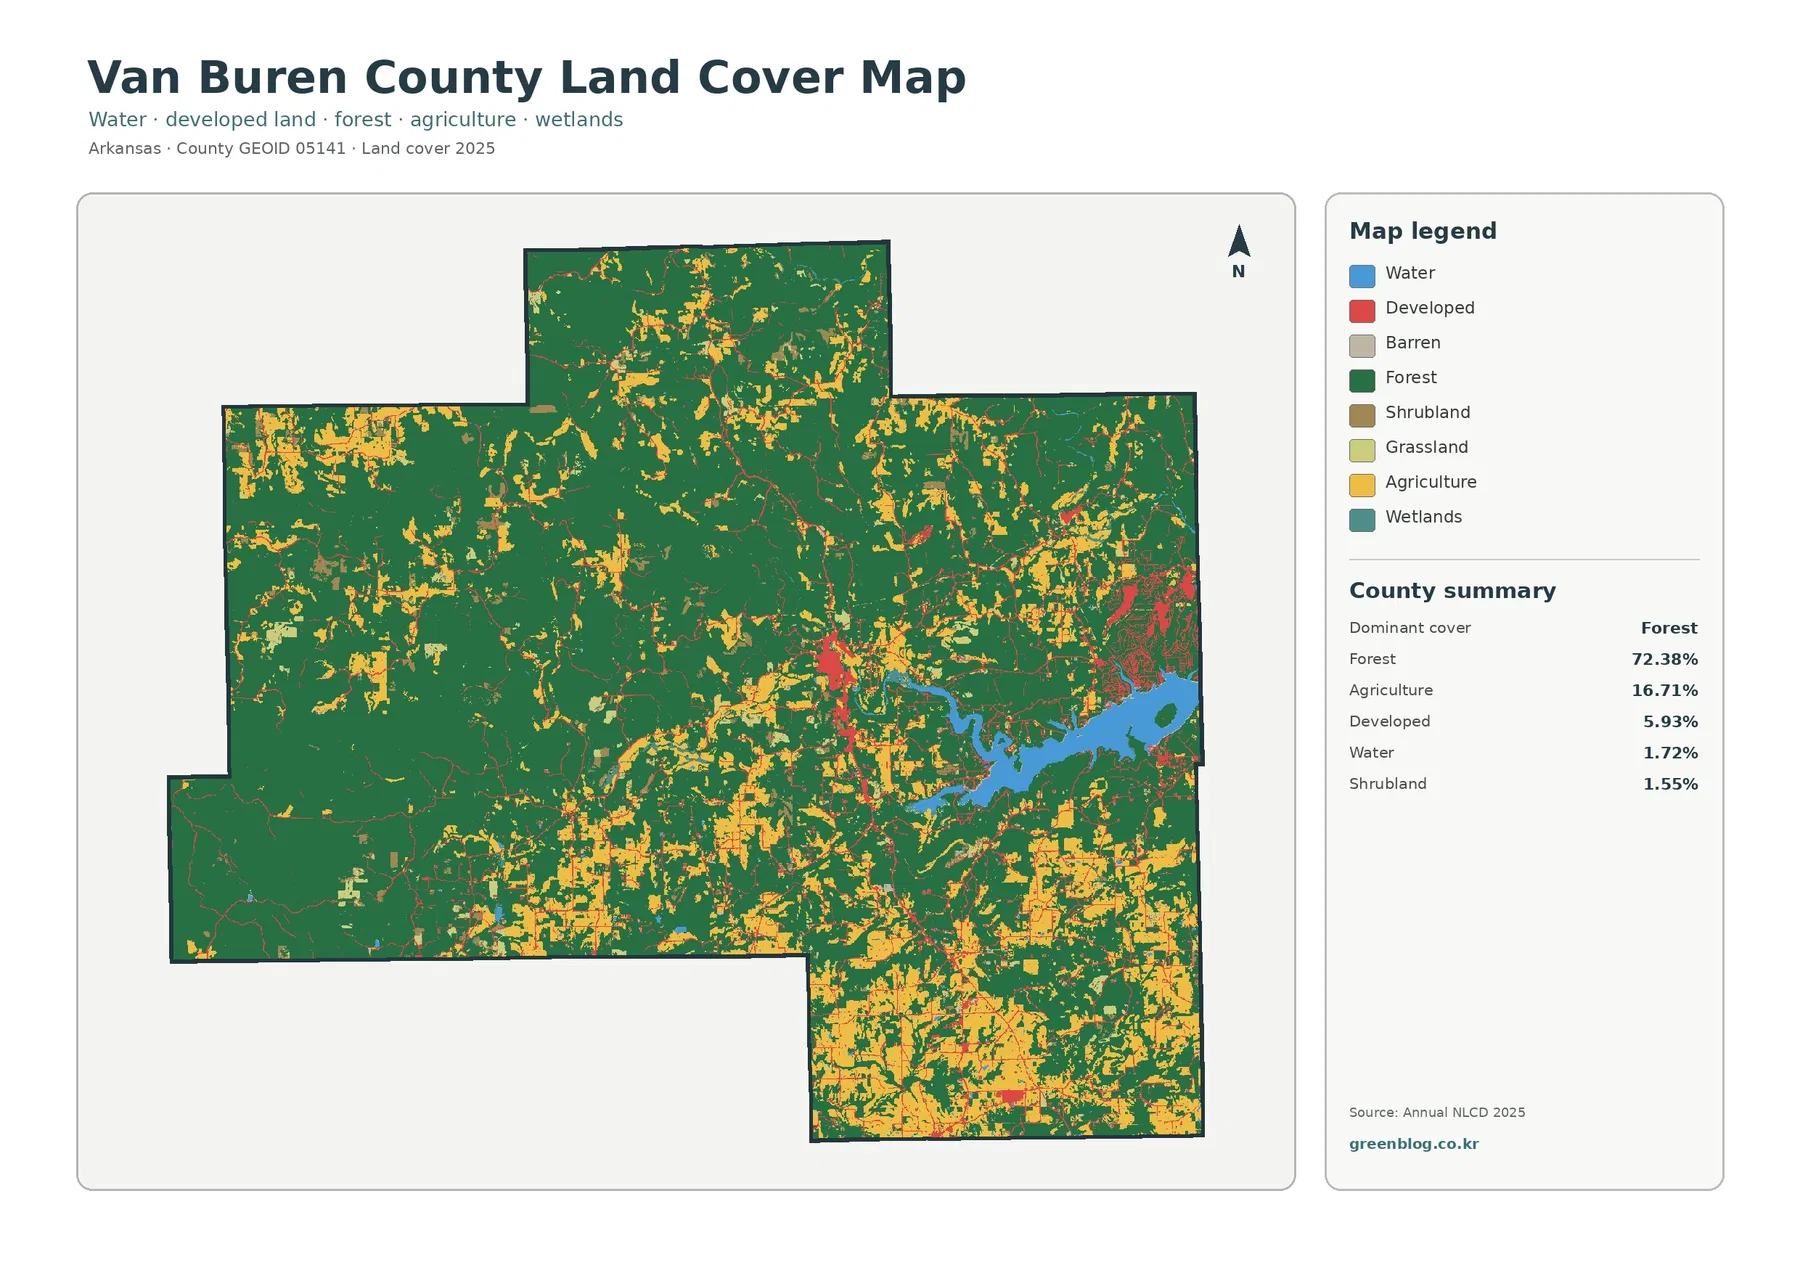
Forest is the clearest feature on the supplied 2025 land-cover view of Van Buren County, covering 72.38 percent of the county. Agriculture accounts for 16.71 percent and appears in separated openings rather than one broad farm plain, while developed land makes up 5.93 percent. Greers Ferry Lake breaks into the eastern side as a large water feature, and the Clinton area forms the most visible built concentration near the center.
This page brings together four ways to examine the same county: current land cover, forest and farmland, impervious surface with developed land, and mapped class differences from 1985 to 2025. The WebP previews are intended for quick comparison on the page. A single ZIP download contains the four original JPG maps for printing, teaching, presentations, or closer side-by-side reference.
Table of Contents
A forest-heavy county still contains distinct pockets of open and built land
Across the general land-cover image, dark green occupies most of the west, north, and large parts of the central and southern county. Agricultural colors interrupt that forest in many separate patches, with more open areas visible toward the south and additional clusters in the northwest and around the central part of the county. This arrangement matters because the 16.71 percent agricultural share is substantial, yet it does not form a single continuous belt.
Smaller classes add detail to the overall picture. Water is 1.72 percent, shrubland 1.55 percent, grassland 1.33 percent, and wetlands 0.23 percent in the supplied summary. Their countywide percentages are modest, but concentration changes how noticeable they become. The eastern reservoir is the best example: water occupies a small share of the county in total, yet one large connected feature stands out more than many scattered patches would.
Greers Ferry Lake creates the strongest break in the eastern forest pattern
A broad blue reservoir reaches the county along the east-central boundary. County information identifies Greers Ferry Lake as a major feature on this side of Van Buren County, and the U.S. Army Corps of Engineers manages the lake as a large north-central Arkansas reservoir. Because the water is concentrated in one connected area, its visual importance is much greater than the 1.72 percent countywide water figure might suggest.
Long stretches of shoreline place forest directly beside water, while small developed areas appear near parts of the lake side. That combination makes the eastern county useful for comparing three classes within a short distance. The map should not, however, be read as a recreation-facility or zoning plan. Marinas, park boundaries, individual roads, parcel lines, and legal land-use designations require separate current sources.
The forest-and-farmland view makes southern openings easier to follow
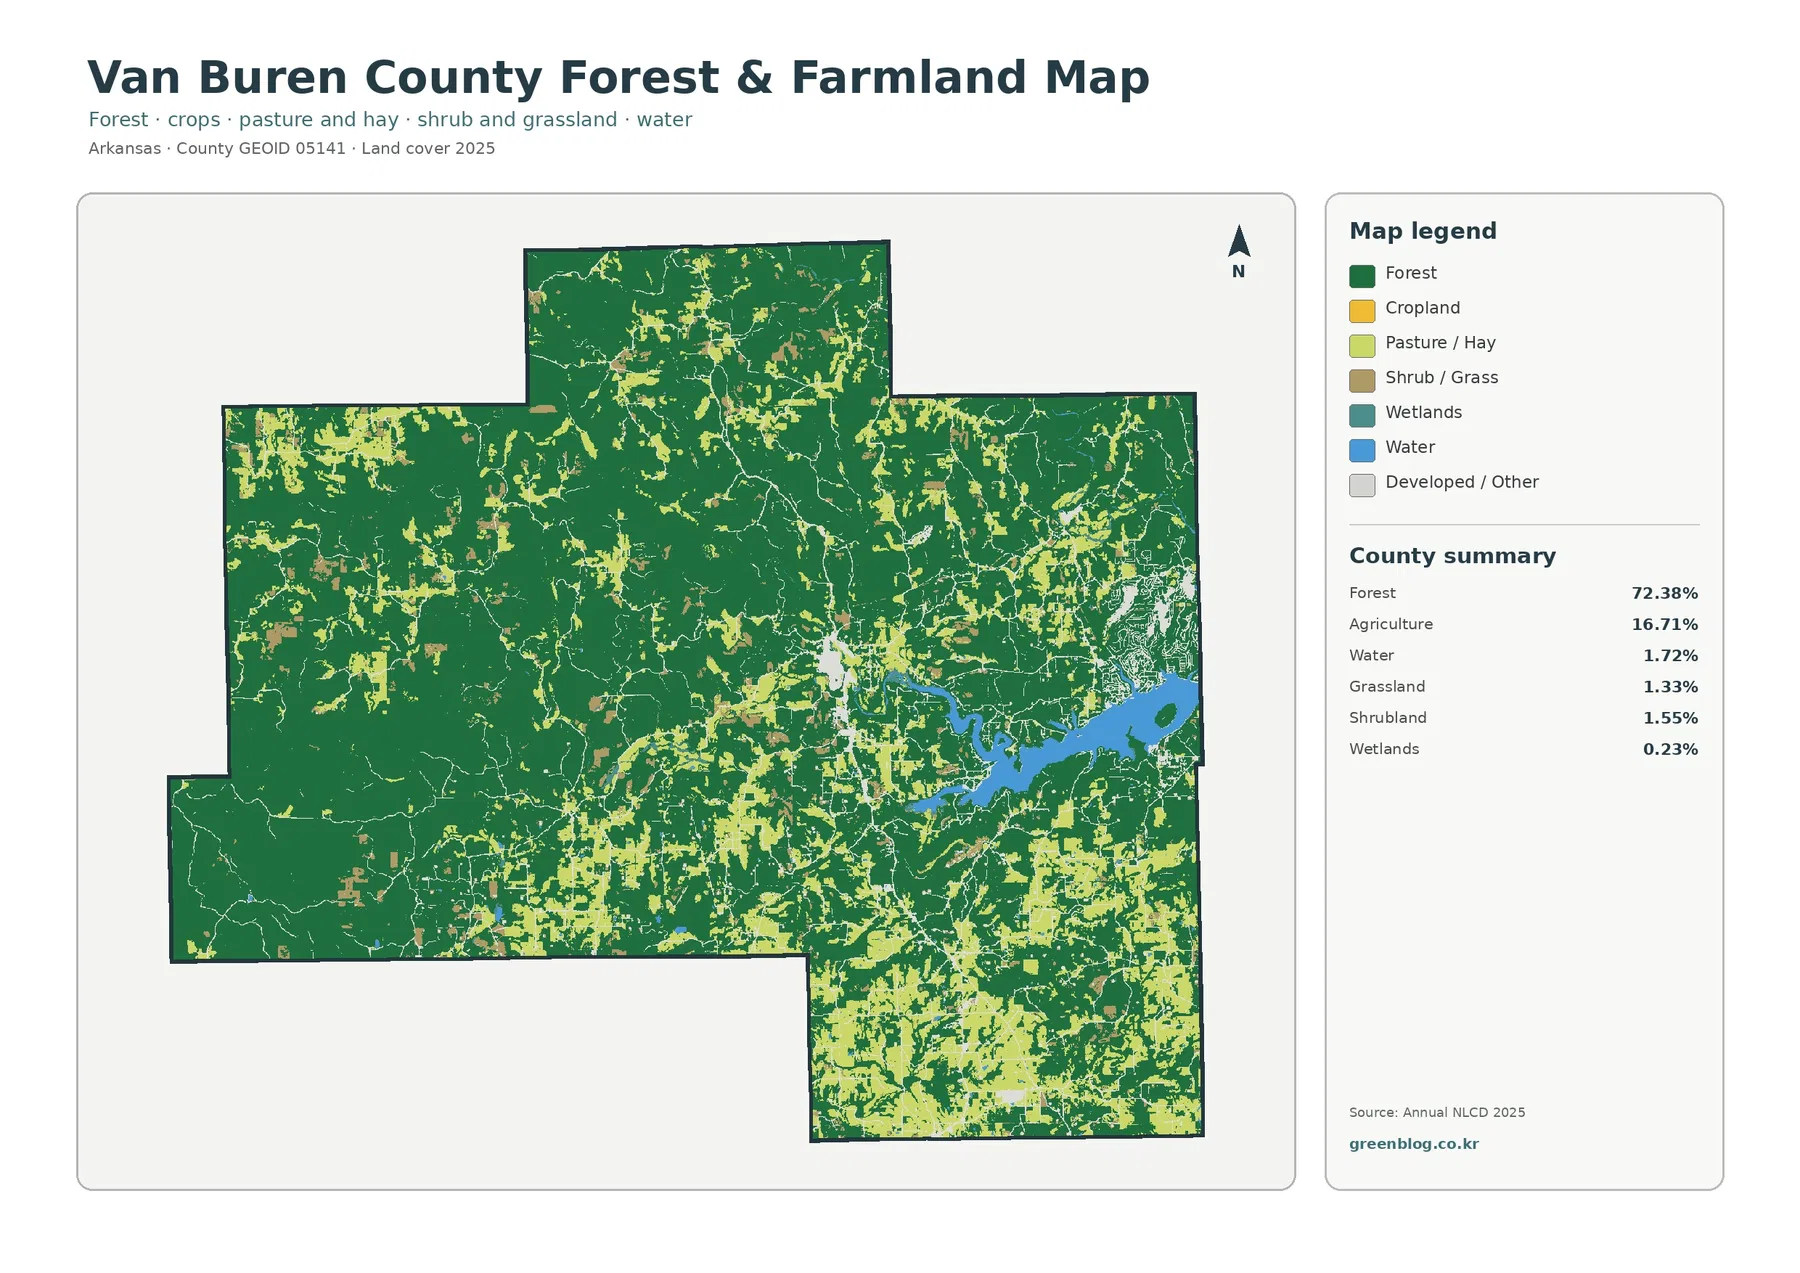
Reducing the number of displayed classes changes what stands out. On the forest-and-farmland map, the open agricultural areas in the south become easier to trace, and smaller openings in the northwest no longer compete visually with every developed or minor cover class. Instead of suggesting an uninterrupted farming district, the image shows agriculture broken into many areas within a much larger wooded landscape.
Local agricultural information from the University of Arkansas Cooperative Extension adds useful context without changing what the map itself says. Its Van Buren County program material discusses beef cattle, small ruminants, pasture, and forage management as important local topics. Those activities fit a landscape where open agricultural ground occurs among extensive forest, but the 16.71 percent agriculture class does not identify each patch as pasture, hay, or cropland. Field-level land use would need more detailed data.
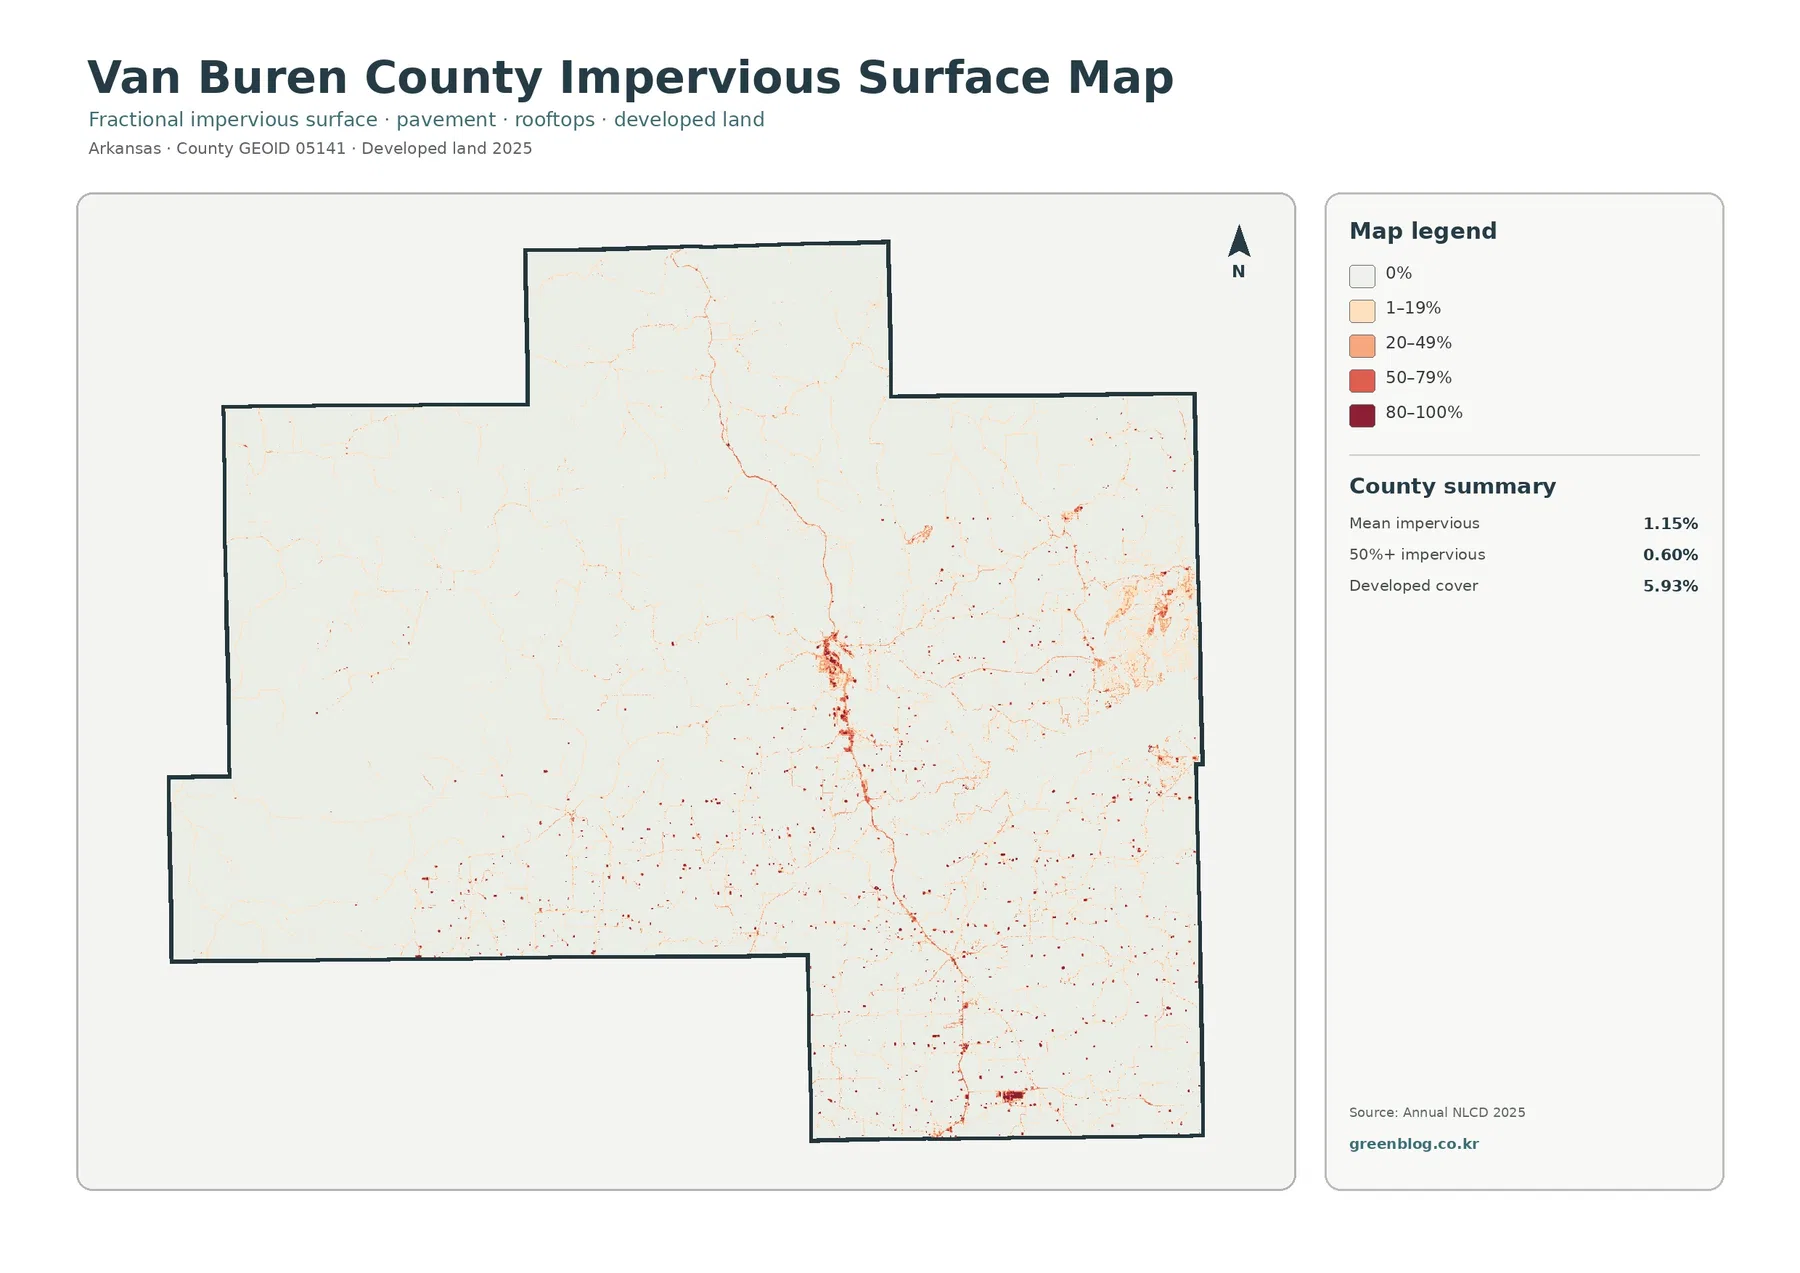
Clinton looks different when developed land is separated from hard surface
Near the center of the county, the largest developed concentration provides a clear reference point. Official county information identifies Clinton as the county seat, so the central built cluster is consistent with the place where public services and local activity are concentrated. Other developed marks occur toward the lake and in smaller settlements, but none occupy as much connected area as the Clinton vicinity on the supplied map.
Impervious surface narrows the comparison further. A developed class can include lawns, soil, scattered trees, and other permeable surfaces within a built setting; impervious cover focuses on pavement, rooftops, parking areas, and similar hard surfaces. The supplied statistics give Van Buren County a mean impervious value of 1.15 percent, with only 0.60 percent of the county summarized at 50 percent or greater impervious cover. As a result, the hardest built surfaces occupy a much smaller footprint than the full 5.93 percent developed class.
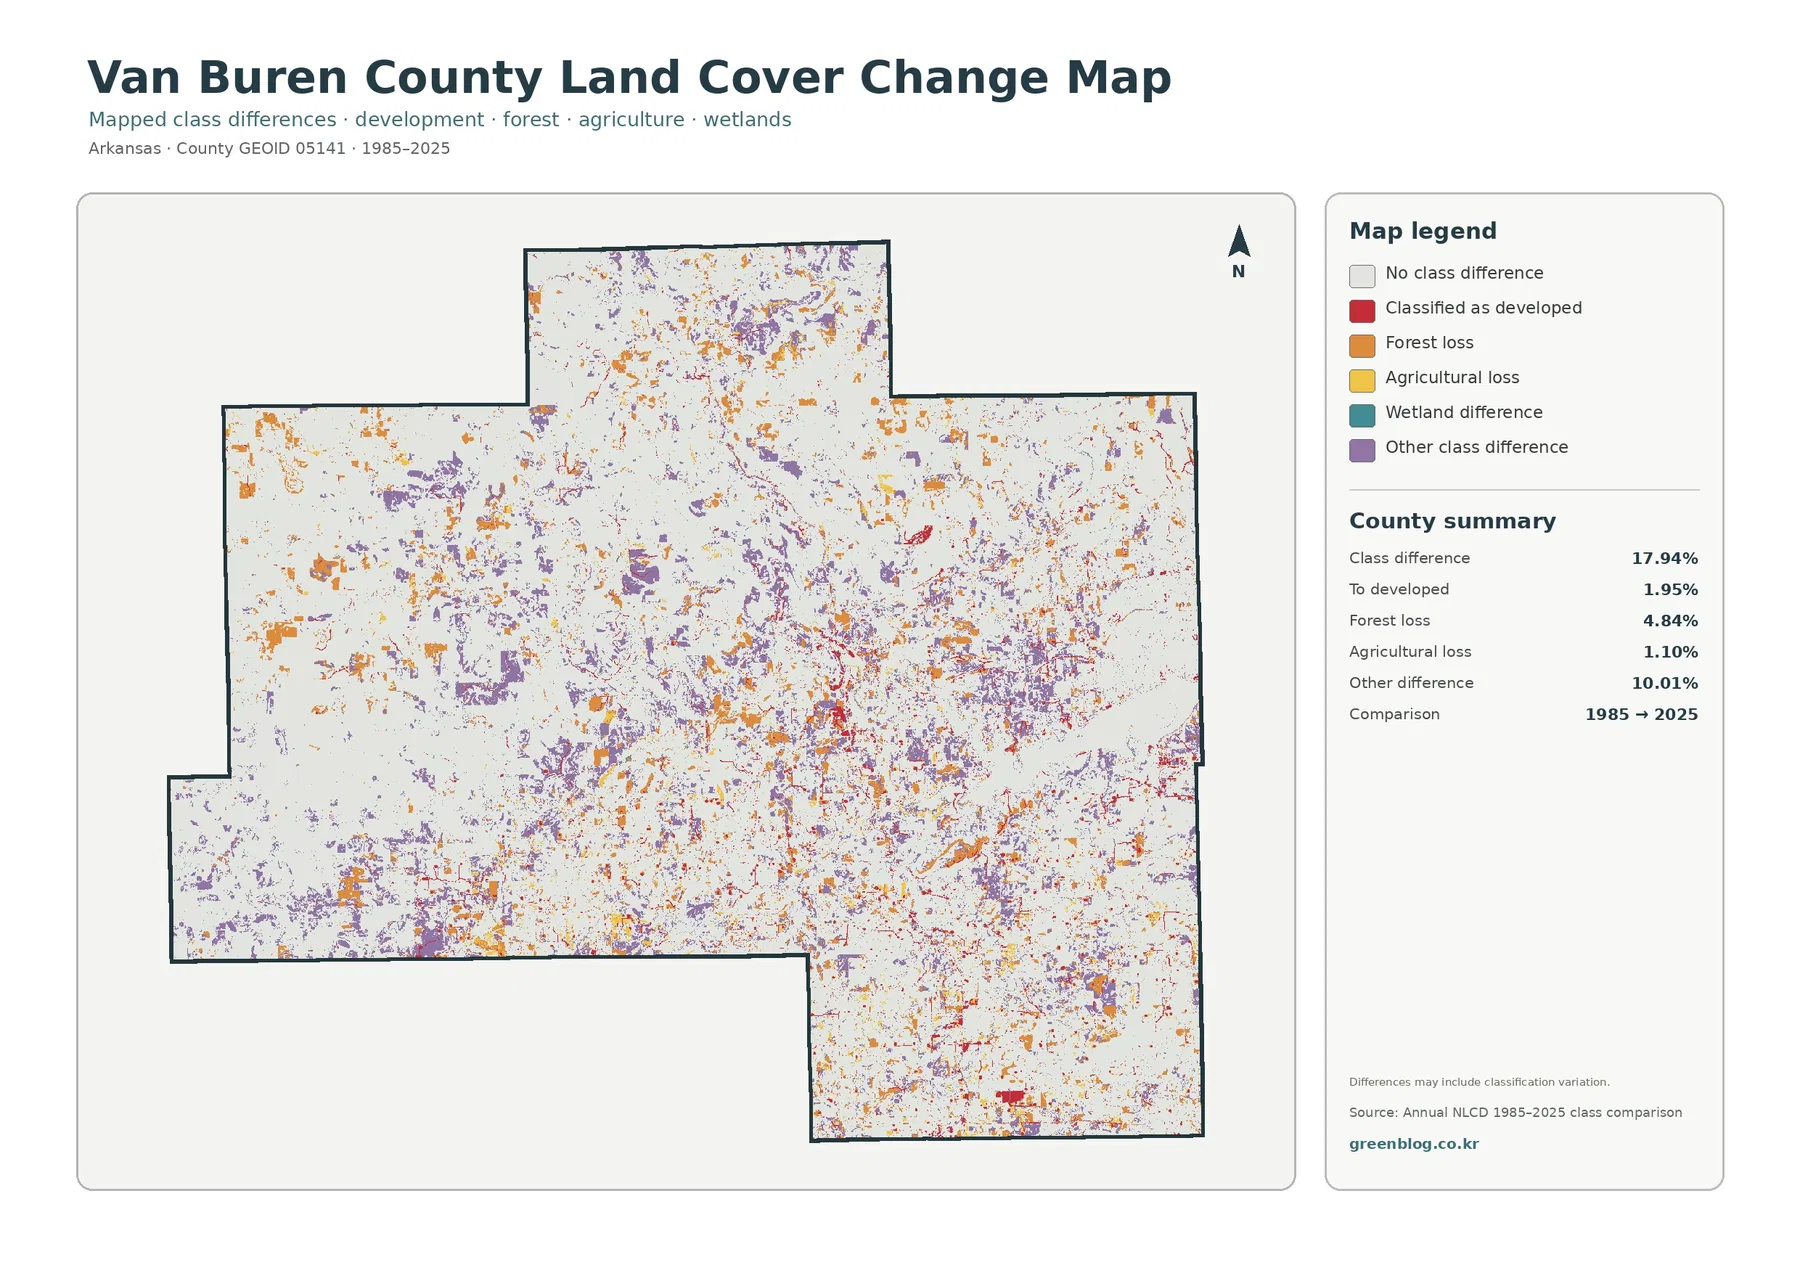
The 1985–2025 comparison reports class difference, not a parcel-by-parcel history
Between the two mapped years, 17.94 percent of the county is summarized as having a different class. The change view divides that total into 10.01 percent other differences, 4.84 percent forest loss, 1.95 percent conversion to developed land, and 1.10 percent agricultural loss. These categories are most useful when read beside the current cover map, because the change colors describe differences between two classification snapshots rather than the present-day share of each cover type.
Not every changed pixel should be treated as proof of a documented physical event. Satellite classification can shift along edges, in mixed pixels, or where the dominant cover within a cell changes between observation dates. For a countywide overview, the change layer is valuable because it points to places worth closer inspection. Confirming logging, construction, agricultural conversion, or another event at one location requires historical imagery or local records in addition to this map.
A simple viewing order keeps current cover, hard surface, and change separate
Begin with the general land-cover map to establish the countywide pattern: extensive forest, dispersed agricultural openings, the eastern reservoir, and a central developed core. Move next to the forest-and-farmland version if the main question is how open land is arranged within the woods. That second view removes enough competing classes to make the southern and northwestern agricultural pattern easier to compare.
For built environments, the impervious layer is the better third step because it distinguishes hard surfaces from the broader developed class. Finish with the 1985–2025 map only after the current pattern is familiar. Following that order helps prevent a common mistake: assuming that a change color represents the amount of that land-cover class today. It also makes it easier to identify places where several questions overlap, such as the Clinton area or the forested shoreline near Greers Ferry Lake.
Thirty-meter cells are useful for regional comparison, not legal property decisions
Annual NLCD products use raster cells at roughly 30-meter scale so large areas can be classified consistently. One cell can contain a forest edge, a narrow road, a small building, and grass at the same time, yet the dataset must assign a representative category. Mixed cells and generalized boundaries explain why a detailed real-world edge may appear blockier or simpler on the map.
County-scale questions are where these maps are strongest. They show that forest clearly dominates Van Buren County, that agricultural openings are distributed unevenly, that the largest built concentration is central, and that the eastern lake creates a distinct water-and-forest boundary. They are not substitutes for parcel surveys, ownership records, zoning maps, regulatory wetland boundaries, or a site inspection. More detailed and current local information is necessary for those uses.
Downloading the four JPG maps
The WebP versions on this page are convenient for browsing, while the download preserves the four supplied JPG files in one ZIP. Keeping the views together is useful when preparing a classroom comparison, a presentation slide, a county reference sheet, or a visual review of forest, farming, development, and long-term class difference. The original files do not meet the package’s A3 high-resolution reference, so very large print enlargement should be planned with the source pixel dimensions in mind.
Frequently Asked Questions
What land-cover class occupies most of Van Buren County?
Forest is the dominant 2025 class at 72.38 percent. Agriculture is second at 16.71 percent and appears as separated openings within the wider forest rather than as one continuous farm belt.
Why is the impervious footprint around Clinton smaller than the developed area?
Developed land can include permeable surfaces such as lawns, soil, and trees within built areas. Impervious cover focuses on pavement, rooftops, parking lots, and similar hard surfaces, so its concentrated footprint is naturally smaller.
Does the 17.94 percent 1985–2025 difference prove that all of that land physically changed?
No. It is the total share with a different mapped class between the two snapshots and can include both real land-cover change and classification variation. Historical imagery or local records are needed to confirm what happened at a particular location.
Sources and reference material
The percentages and 1985–2025 values in this article come from the supplied Van Buren County map package. The following official resources provide classification documentation and local context for Clinton, Greers Ferry Lake, agriculture, and county boundaries.
- MRLC Annual NLCD Data — Official access point for Annual NLCD data and related land-cover products.
- USGS Annual NLCD Land Cover Classification — Documentation for national classes including forest, agriculture, developed land, water, and wetlands.
- Van Buren County, Arkansas official website — County background and Clinton county-seat context.
- University of Arkansas Cooperative Extension – Van Buren County — Local information on cattle, small ruminants, pasture, forage, and agricultural programs.
- U.S. Army Corps of Engineers – Greers Ferry Lake — Official information for the reservoir along the county’s east side.
- U.S. Census Bureau TIGER/Line Shapefiles — Official mapping source for county and other administrative boundaries.
Map File Information
The ZIP contains the four original Van Buren County JPG maps used for current land cover, forest and farmland, impervious/developed land, and 1985–2025 land-cover comparison.
- Included Files: four Van Buren County land-cover JPG maps
- File Type: ZIP containing four JPG files
- Intended Use: printing, education, presentations, county comparison, and personal reference
Related Maps
- A Craighead County Arkansas Land Cover Map
- Arkansas County Arkansas Land Cover Map
- Ashley County Arkansas Land Cover Map
Green Map creates custom-edited map images using open geographic data sources such as geoBoundaries, Natural Earth, OpenStreetMap, and government open data.
These maps are edited visual materials, not raw data files, and are provided for education, documents, presentations, and graphic reference.