The Washington County Idaho Land Cover Map set is dominated by open vegetation rather than dense development. Grassland accounts for 60.23% of the 2025 summary, followed by shrubland at 20.94%, forest at 8.90%, agriculture at 6.48%, and developed land at 2.04%. The countywide view is therefore mostly light grass and shrub colors, but several farm and settlement clusters stand out because they are concentrated.
Four views are included on this page: 2025 land cover, forest and farmland, impervious surface and developed land, and a 1985–2025 class-difference comparison. The WebP images are intended for quick reading in the article, while the four original 2480 × 1754-pixel JPG maps are available together in one ZIP download for presentations, lessons, county profiles, and visual comparison.
Table of Contents
Open vegetation covers most of the county, but the occupied areas form distinct clusters
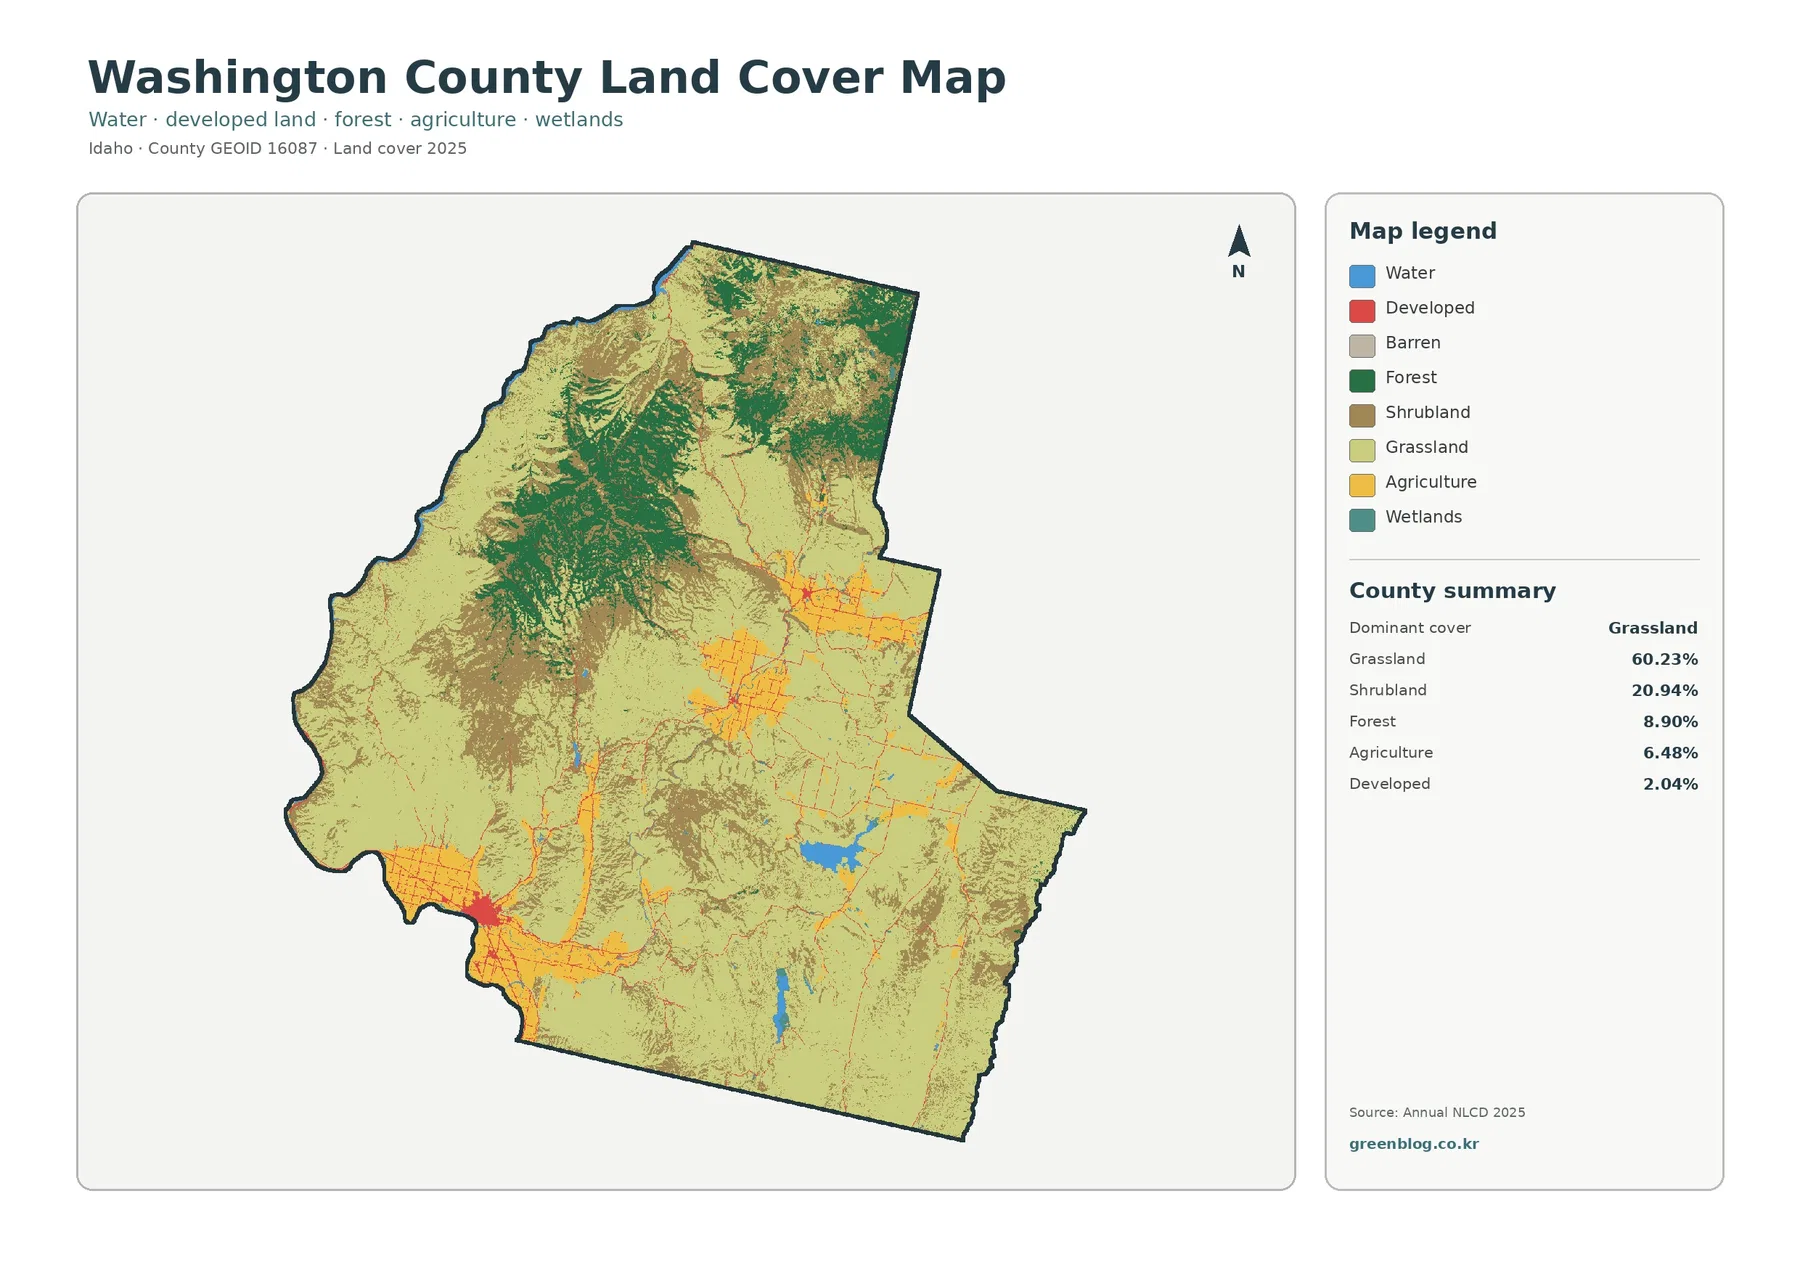
Grassland fills much of the south, east, west, and central part of the county. Its 60.23% share is not just a statistical lead; the pale grassland color is visibly continuous across large areas. Shrubland adds another 20.94% and often appears beside or within those open tracts. Together, the two classes explain why the county looks far more open than forested or urban on the general map.
Forest is only 8.90% countywide, yet it is strongly localized. Dark green cover is most noticeable in the north and north-central interior, with additional patches farther west. The southern half has much less continuous forest, so a county average alone would miss an important internal contrast. The map is more useful when the forest percentage is read together with its location.
Agriculture makes up 6.48%. Yellow fields form a large cluster in the southwest and additional blocks through the central and eastern parts of the county. They do not cover Washington County evenly. The concentration of farm color in selected areas makes agriculture easy to identify even though it occupies far less land than grassland or shrubland.
Developed land is 2.04%, and the red class is even more concentrated than agriculture. The strongest cluster sits in the southwest, while smaller developed areas and thin traces appear in the middle and east. The map does not label towns or roads, so those shapes should not be treated as municipal boundaries or named transportation routes without a second reference.
The southwest cluster is useful for comparing farms, settlement, and hard surfaces
The largest combination of yellow agriculture and red development lies near the southwest edge. That concentration is broadly consistent with the Weiser area, but the land-cover image itself contains no city outline. Reading it as a general settlement-and-farm cluster is appropriate; drawing an exact Weiser boundary from the color edge would not be.
Forest and farmland become easier to separate when developed classes are faded
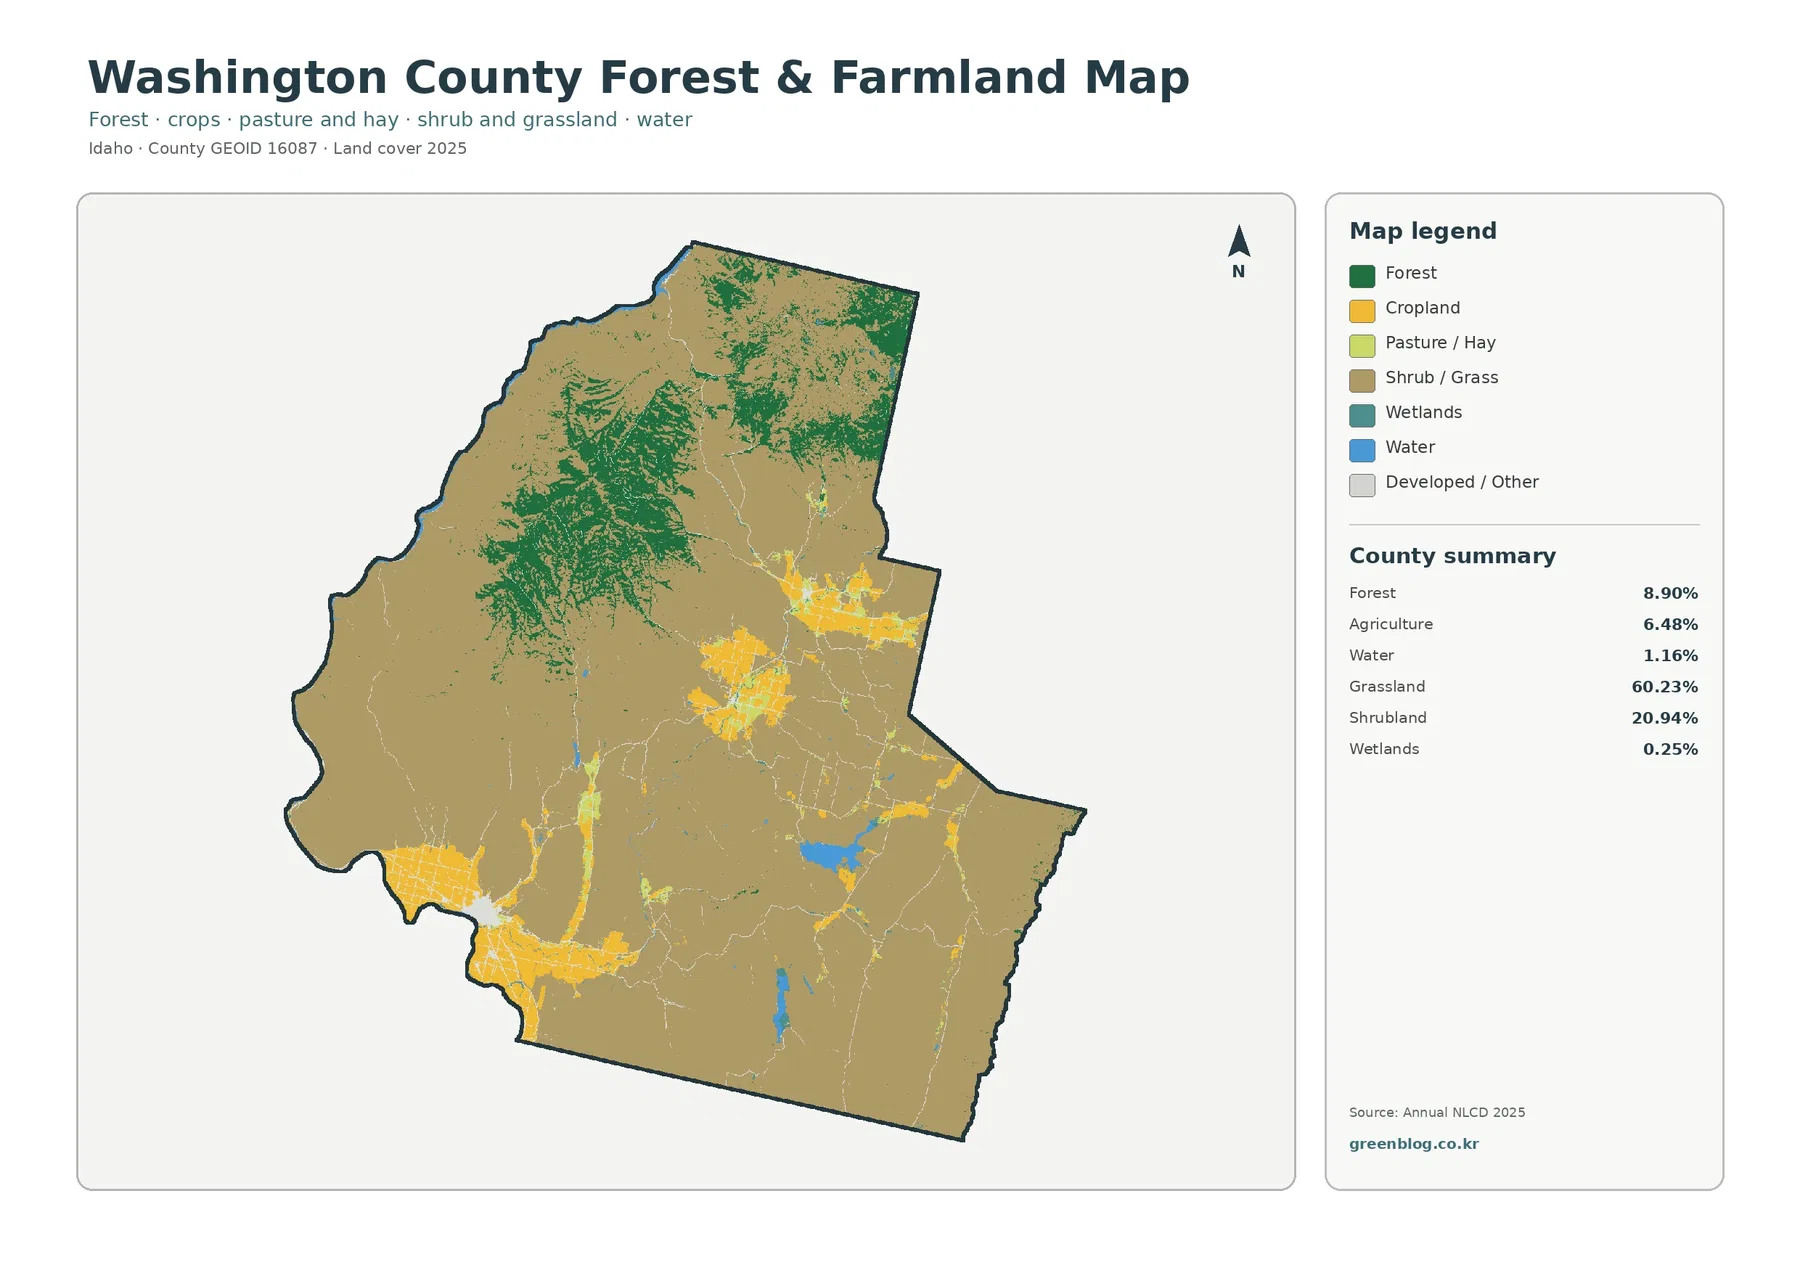
Open water is 1.16% and wetlands are 0.25%. Blue water appears in several small locations, with larger marks in the southern and southeastern portions of the county. Wetland color is much less extensive. Water and wetlands are related to moisture, but they are not the same class: open water emphasizes exposed water surfaces, while wetland classes can include vegetation on saturated or seasonally wet ground.
A 0.50% impervious mean keeps the countywide development signal small
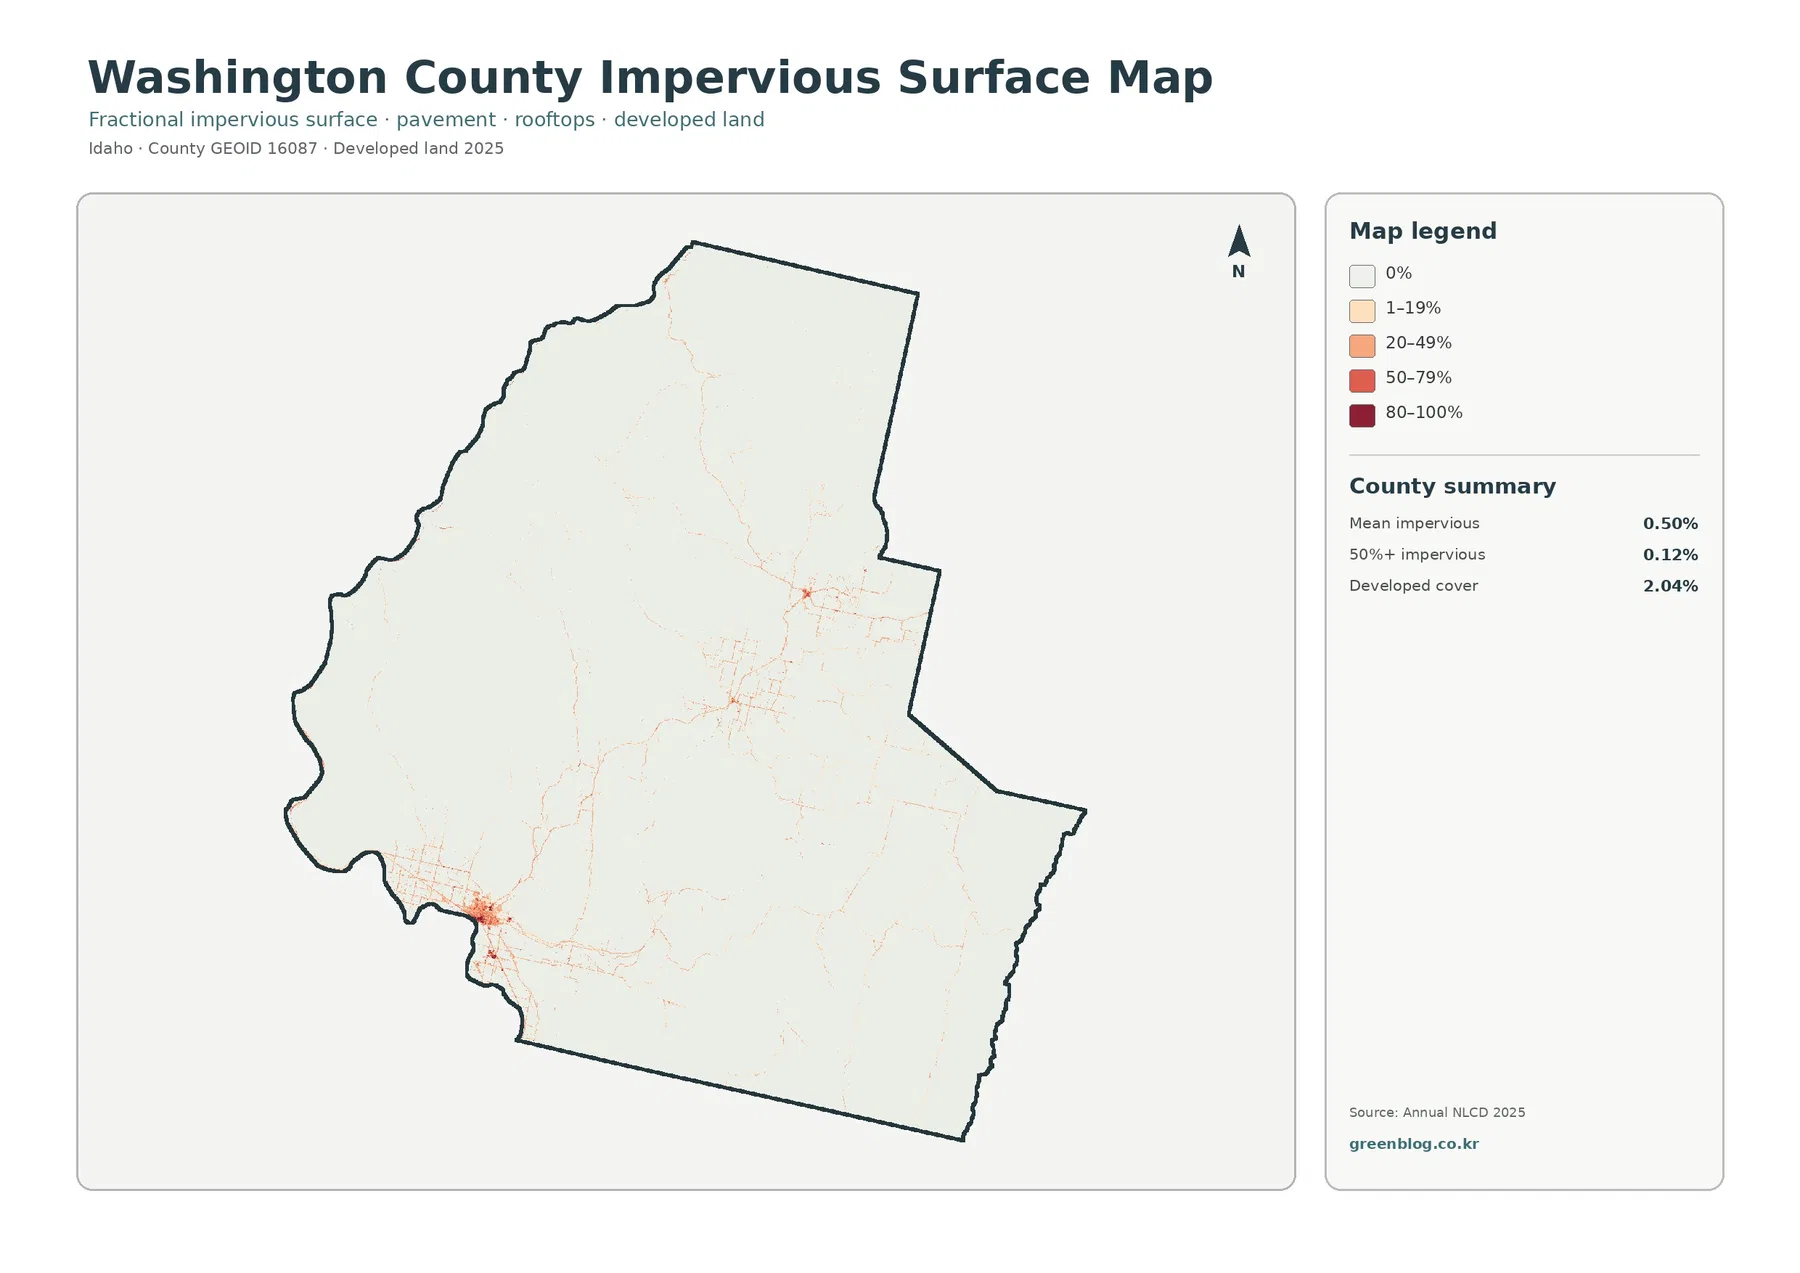
Impervious surface means roofs, pavement, parking areas, and other hard materials that shed water instead of letting it soak directly into the ground. Washington County has a mean impervious value of 0.50%, and only 0.12% of the county is mapped at 50% impervious or greater. Both figures are smaller than the 2.04% developed land-cover share.
That difference is expected because developed land-cover classes can include lawns, trees, bare soil, and other permeable ground around buildings and roads. The impervious layer narrows the question to hard surface intensity. It therefore provides a cleaner way to distinguish the dense southwest cluster from the much larger rural areas that remain close to zero.
The 1985–2025 comparison is mostly other class difference, not one single conversion
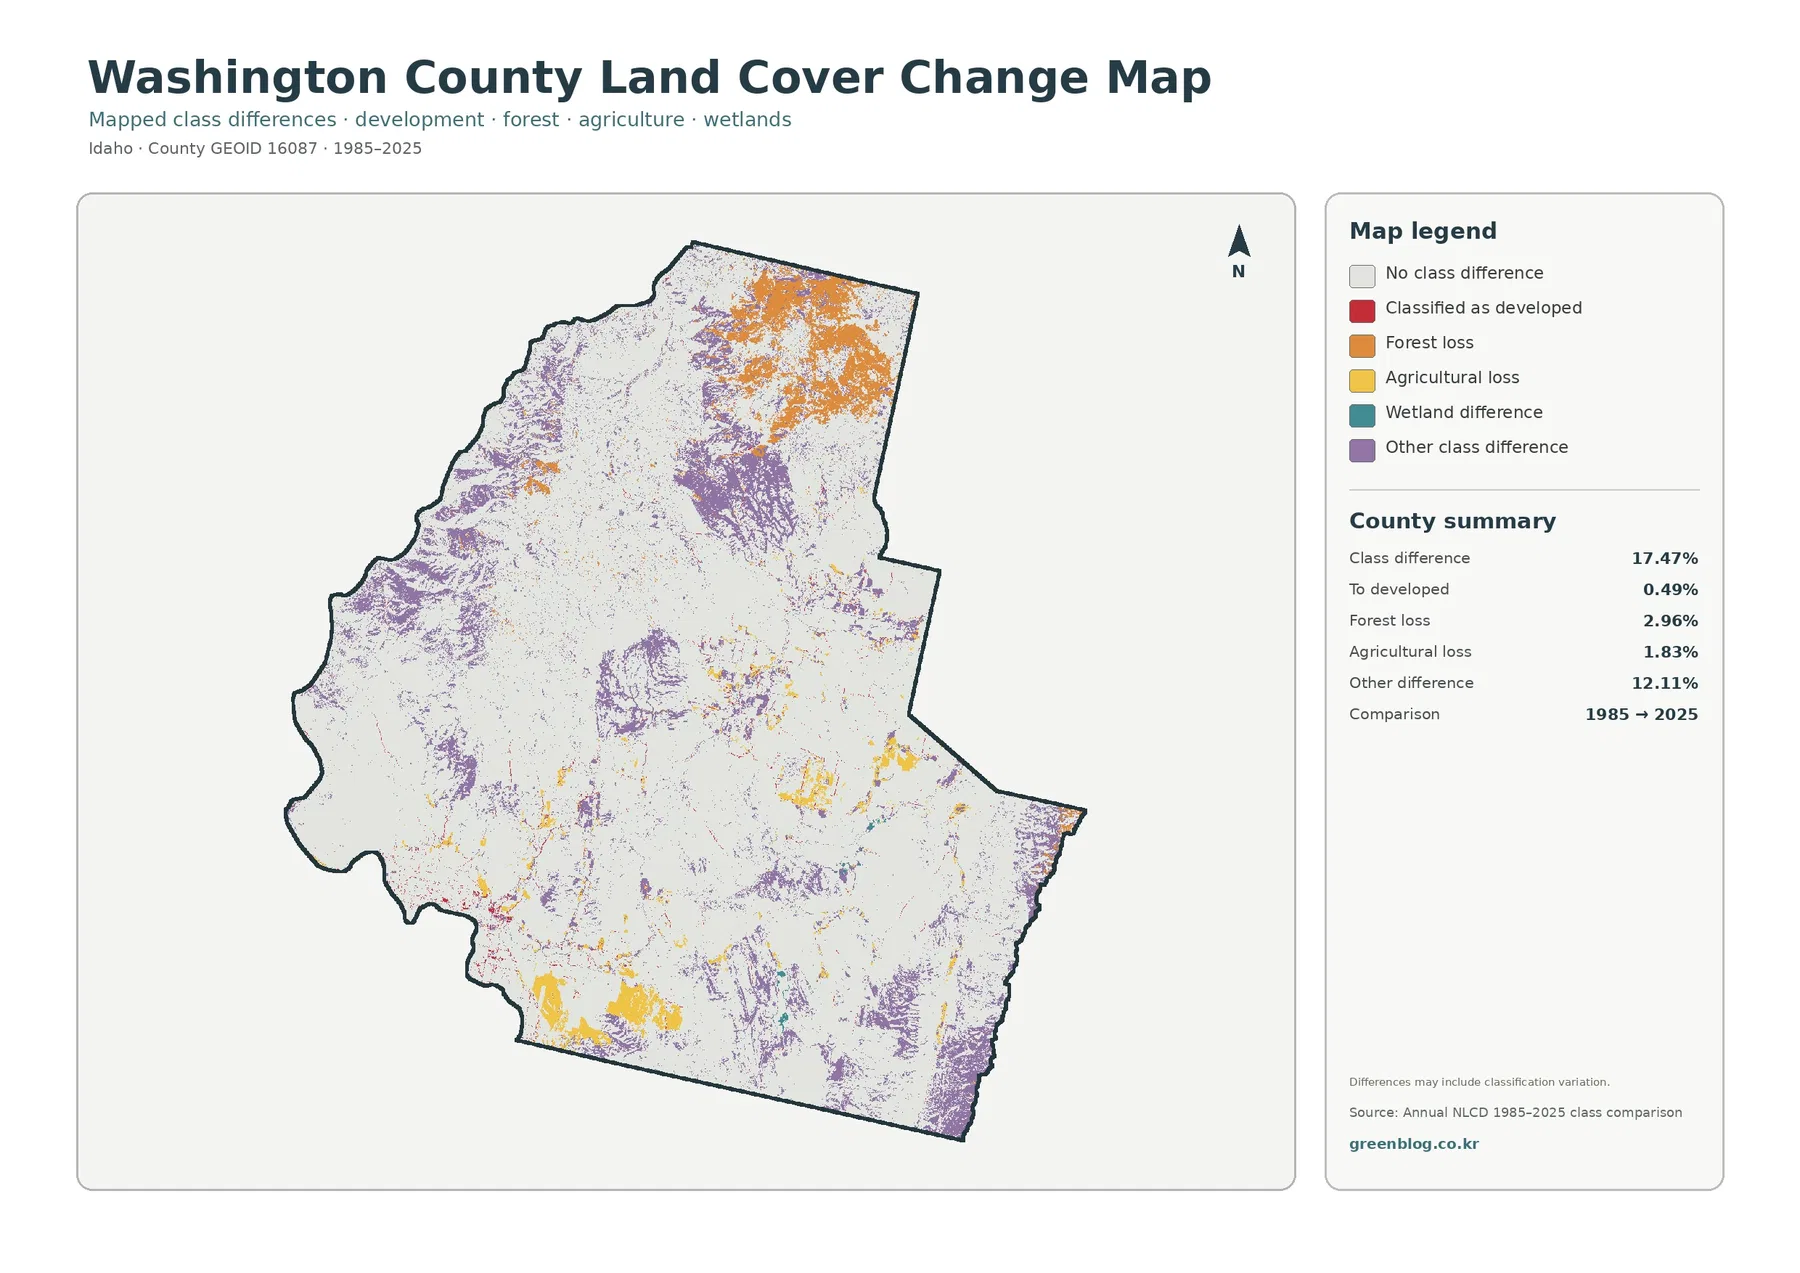
The endpoint comparison reports 17.47% total class difference between 1985 and 2025. The listed components are 0.49% classified as developed, 2.96% forest loss, 1.83% agricultural loss, and 12.11% other difference. Wetland difference appears in the legend but does not have its own printed percentage, so it should not be estimated from the map or derived as an official value from rounding.
Purple other-difference cells are scattered through many parts of Washington County, with notable concentrations in the north, north-central interior, west, and southeast. Orange forest-loss cells stand out most strongly in the northern portion. Yellow agricultural-loss cells occur in smaller patches, including areas near present agricultural clusters in the south, center, and east.
The word loss needs careful interpretation. A forest-loss cell means that a location classified as forest at the 1985 endpoint received another class at the 2025 endpoint. It does not identify logging, fire, grazing, construction, drought, restoration, or classification error as the cause. Agricultural loss has the same limitation.
Use the four maps as a sequence rather than as interchangeable pictures
For a general county introduction, begin with the 2025 land-cover map. It shows the dominant grassland and shrubland, northern forest, farm clusters, water, and developed areas in one frame. The focused vegetation map works better when the question is specifically about farmland, forest, pasture or hay, or the relationship between open vegetation and cultivated blocks.
What the 30-meter grid and 2025 observation year do not provide
Annual NLCD is a generalized land-cover product built on 30-meter square cells. It is appropriate for county-scale patterns, not parcel surveys. Narrow features may be absorbed into a neighboring class, and boundaries between two surfaces can be represented by mixed pixels whose single label simplifies what exists on the ground.
The original JPG files are 2480 × 1754 pixels each. The package does not identify them as meeting an A3 high-resolution reference, so a test print is sensible before enlarging them for a large poster. They are well suited to screen presentations, documents, teaching materials, and county comparisons, but they are not engineering, zoning, wetland-jurisdiction, or ownership maps.
What is included in the four-map JPG download
Frequently Asked Questions
Does 60.23% grassland mean most of Washington County is legally designated pasture?
No. Grassland is a land-cover classification based on the observed surface, not a legal land-use or ownership designation. It does not show grazing leases, ranch boundaries, zoning, or whether livestock were present. Those questions require property, range, or land-management records.
Can the large southwest developed cluster be used as the exact boundary of Weiser?
No. The cluster is broadly consistent with the Weiser area, but the land-cover map contains no municipal boundary. Washington County provides separate public maps for Weiser, Midvale, and Cambridge, which should be used when exact city limits are needed.
Does 17.47% class difference mean that 17.47% of the county was damaged between 1985 and 2025?
No. It is the share of cells receiving different endpoint classifications. Real land-surface change can contribute, but so can mixed pixels, seasonal conditions, and classification variation. Intermediate imagery and local forestry, agriculture, or development records are needed to establish timing and cause.
Sources and Reference Data
- MRLC Annual NLCD Data – official access point for annual land-cover and comparison products
- USGS Annual NLCD Land Cover Classification – official definitions and guidance for land-cover classes and the 30-meter product
- U.S. Census Bureau TIGER/Line Shapefiles – official county-boundary reference for Washington County
- Washington County Map & Parcel Information – county public maps, including separate maps for Weiser, Midvale, and Cambridge
- University of Idaho Extension – Agriculture in Washington County – local programs covering farm and ranch management, crops, livestock, and small farms
- Weiser River Soil and Water Conservation District – regional natural-resource planning material with Washington County community and agriculture context
Map File Information
The ZIP contains four original JPG maps for comparing Washington County's grassland and shrubland, farm and forest clusters, impervious surfaces, and 1985–2025 class differences.
- Included Files: General land cover, forest and farmland, impervious/developed surface, and land-cover change maps
- File Type: Four original JPG map files bundled in one ZIP archive
- Intended Use: Printing, education, presentations, and map-based projects
Related Maps
Green Map creates custom-edited map images using open geographic data sources such as geoBoundaries, Natural Earth, OpenStreetMap, and government open data. These maps are edited visual materials, not raw data files, and are provided for education, documents, presentations, and graphic reference.