The Adams County Idaho Land Cover Map shows a county where natural cover occupies almost the entire frame. Forest is the largest 2025 class at 49.75%, while grassland accounts for 25.23% and shrubland for 18.92%. Agriculture is only 2.92% and developed land 1.86%, so the strongest visual contrast is not city versus countryside. It is the changing mix of forested slopes, open grass, shrub-covered ground, and a few narrow settled or cultivated areas.
The four images focus on different parts of this Adams County pattern. The 2025 overview separates the broad forest, grassland, and shrubland areas; the vegetation view isolates the small agricultural pockets; the impervious layer shows how little hard surface exists outside Council, New Meadows, Indian Valley, and connecting settlement traces; and the 1985–2025 layer marks where endpoint classifications differ. The four original JPG maps are available together in one ZIP below.
Table of Contents
A county divided more by vegetation than by development
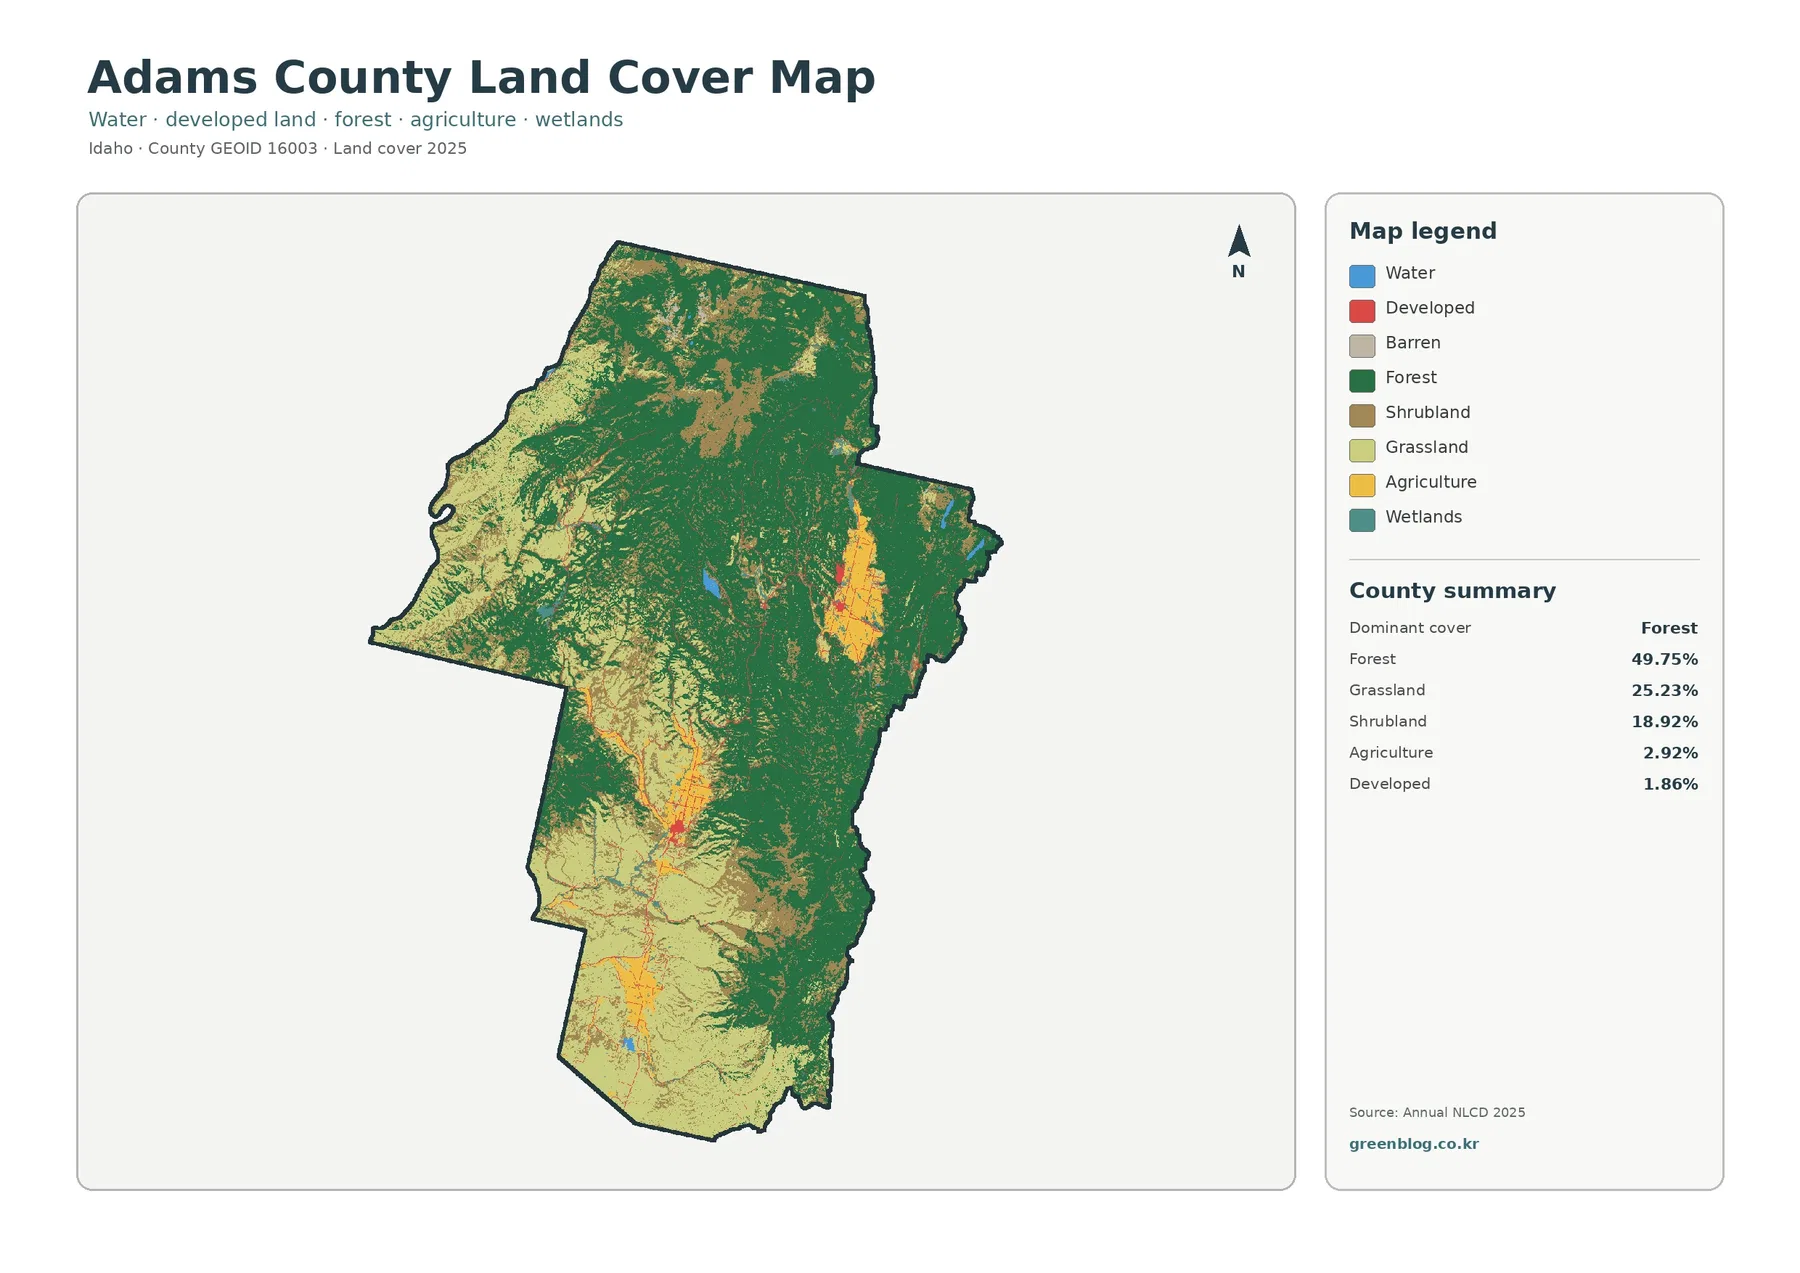
The countywide map immediately separates the heavily wooded parts of Adams County from broad areas of lower, more open vegetation. Dark green forest is extensive through the center, east, and much of the north. Grassland and shrubland become more prominent toward the west and southwest, and they also form irregular openings within or beside the forest. This matters because a single countywide percentage can hide how sharply the surface changes from one part of the county to another.
Forest covers 49.75%, but the combined presence of grassland and shrubland is also substantial. Grassland is 25.23% and shrubland 18.92%, so open vegetation is not a small fringe around the woods. It forms a second major landscape component. On the map, the boundary between wooded and open cover is often irregular rather than straight, producing long transitional zones where patches of forest, grass, and shrubs meet.
Agriculture represents 2.92% of the supplied 2025 summary, and the mapped farmland is concentrated rather than evenly distributed. One elongated agricultural area stands out on the eastern side, while a smaller pocket appears farther south. Both are narrow interruptions within much larger forest, grassland, and shrubland areas, which makes the limited working-land footprint easy to distinguish from the county’s dominant natural cover.
Open water is 0.38% and wetlands 0.79%. Their total area is small, but the blue and wetland colors appear as narrow drainage-related traces and small patches between forest and open vegetation. In Adams County, these features are better interpreted by location than by countywide percentage because they follow only a limited set of low-lying or water-connected areas.
Forest, grassland, and small farm pockets divide the county into distinct vegetation zones
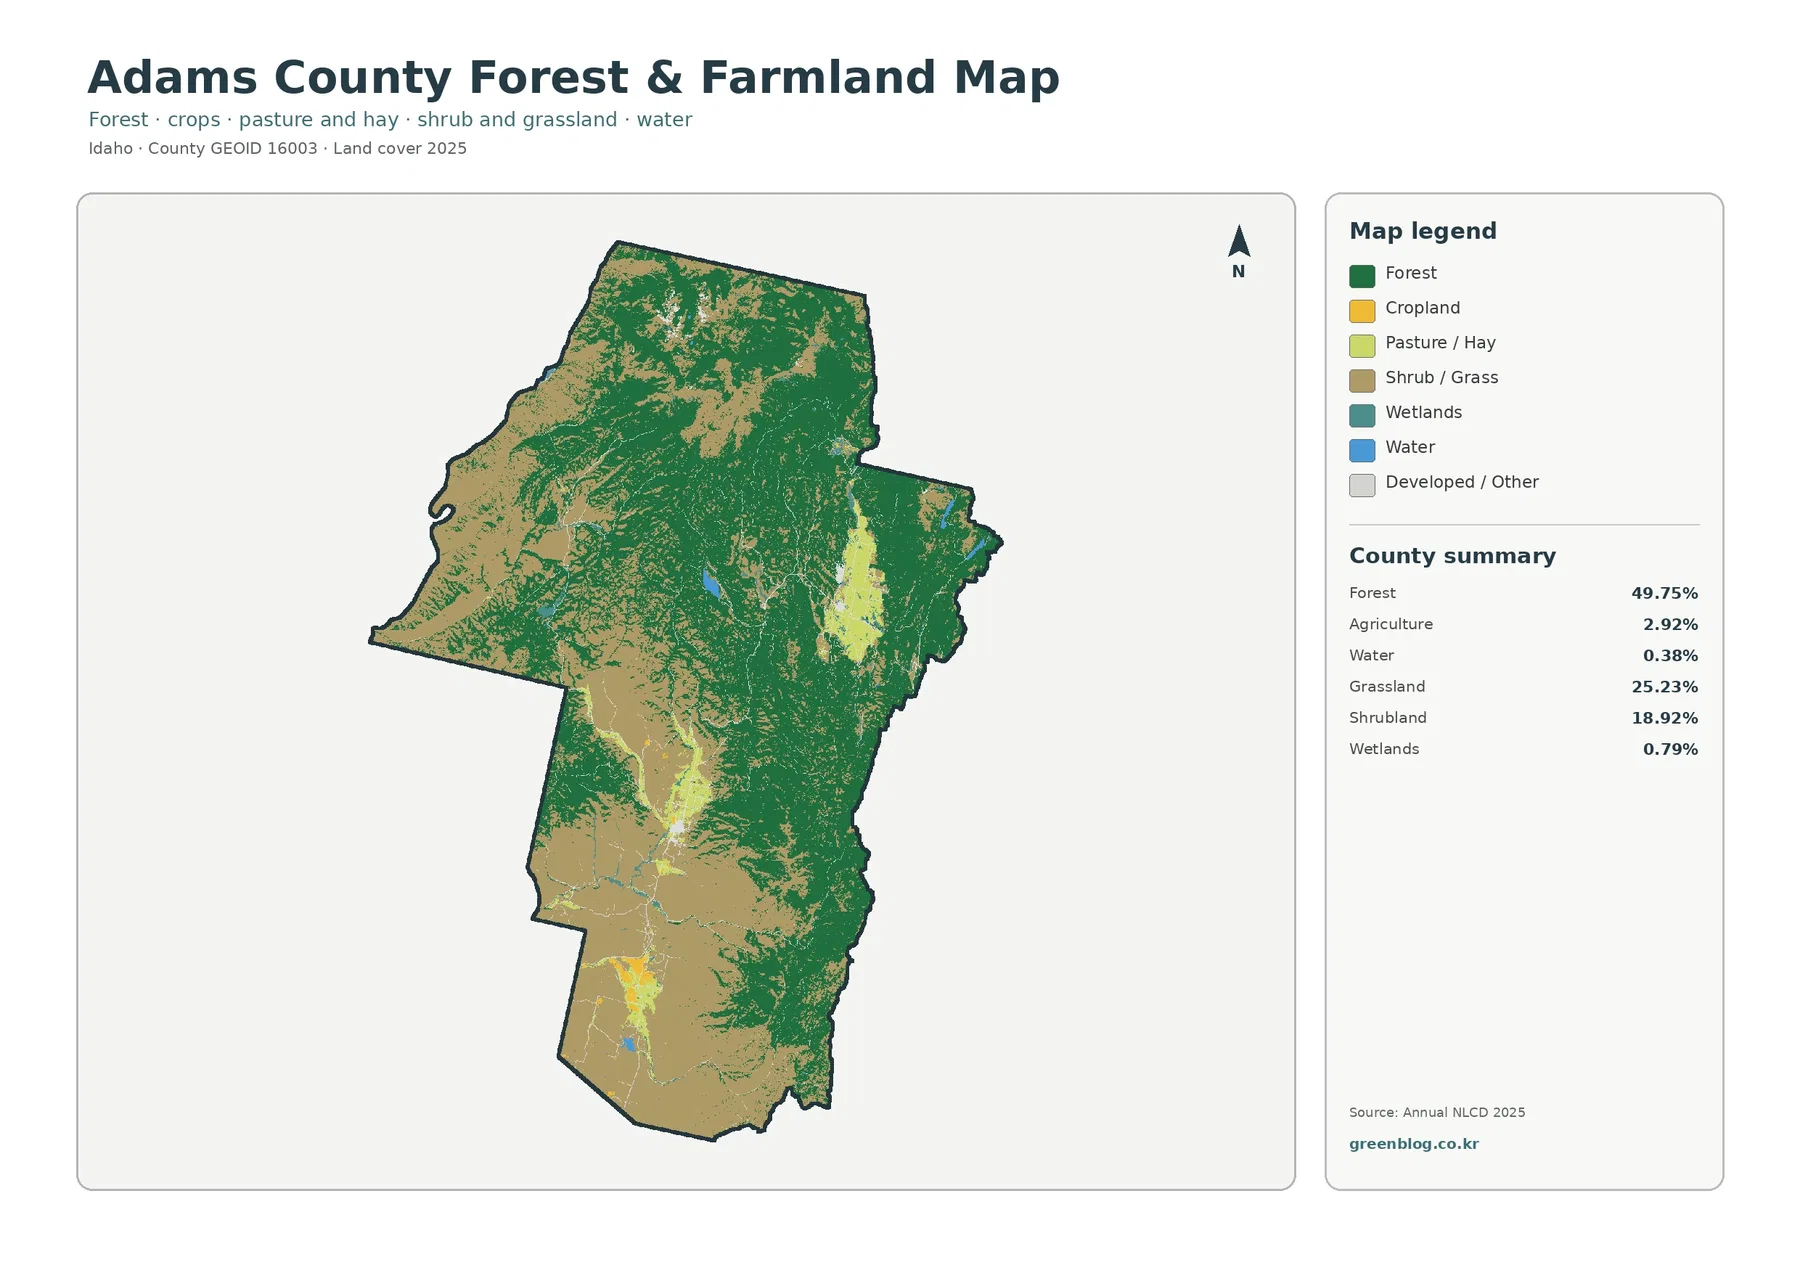
With the smaller classes removed, the central and eastern forest blocks stand apart from the more continuous shrub and grass cover to the west. In the south, wooded fingers extend into broader open ground, while the few agricultural patches occupy narrow spaces within that vegetation mosaic. The simplified view therefore emphasizes a real east–west and north–south contrast instead of presenting Adams County as one continuous forest.
The agricultural areas do not form a countywide farm belt. They occupy a few defined corridors and pockets inside a much larger natural landscape. This distinction matters in Adams County because many of the broad light-toned areas are grassland or shrubland rather than farmland. The vegetation map separates those open natural surfaces from the much smaller cultivated footprint.
Adams County’s official website places county offices in Council. The county Road & Bridge Department also identifies operational shops in Council, New Meadows, and Indian Valley. Those names are useful reference points for understanding where community activity occurs, but the land-cover images themselves do not draw city limits or label road classes. A colored patch should not be assigned to a municipality or parcel without checking a separate place or boundary layer.
The U.S. Forest Service describes the Payette National Forest region as a mix of deep canyon country, high peaks, heavily forested terrain, and dry grasslands. That regional setting matches the sharp forest-to-open-vegetation contrasts visible across Adams County. It does not mean that every green area on this map lies inside National Forest ownership, however; NLCD classifies surface cover and does not draw administrative forest boundaries.
Hard surfaces occupy only a small fraction of Adams County
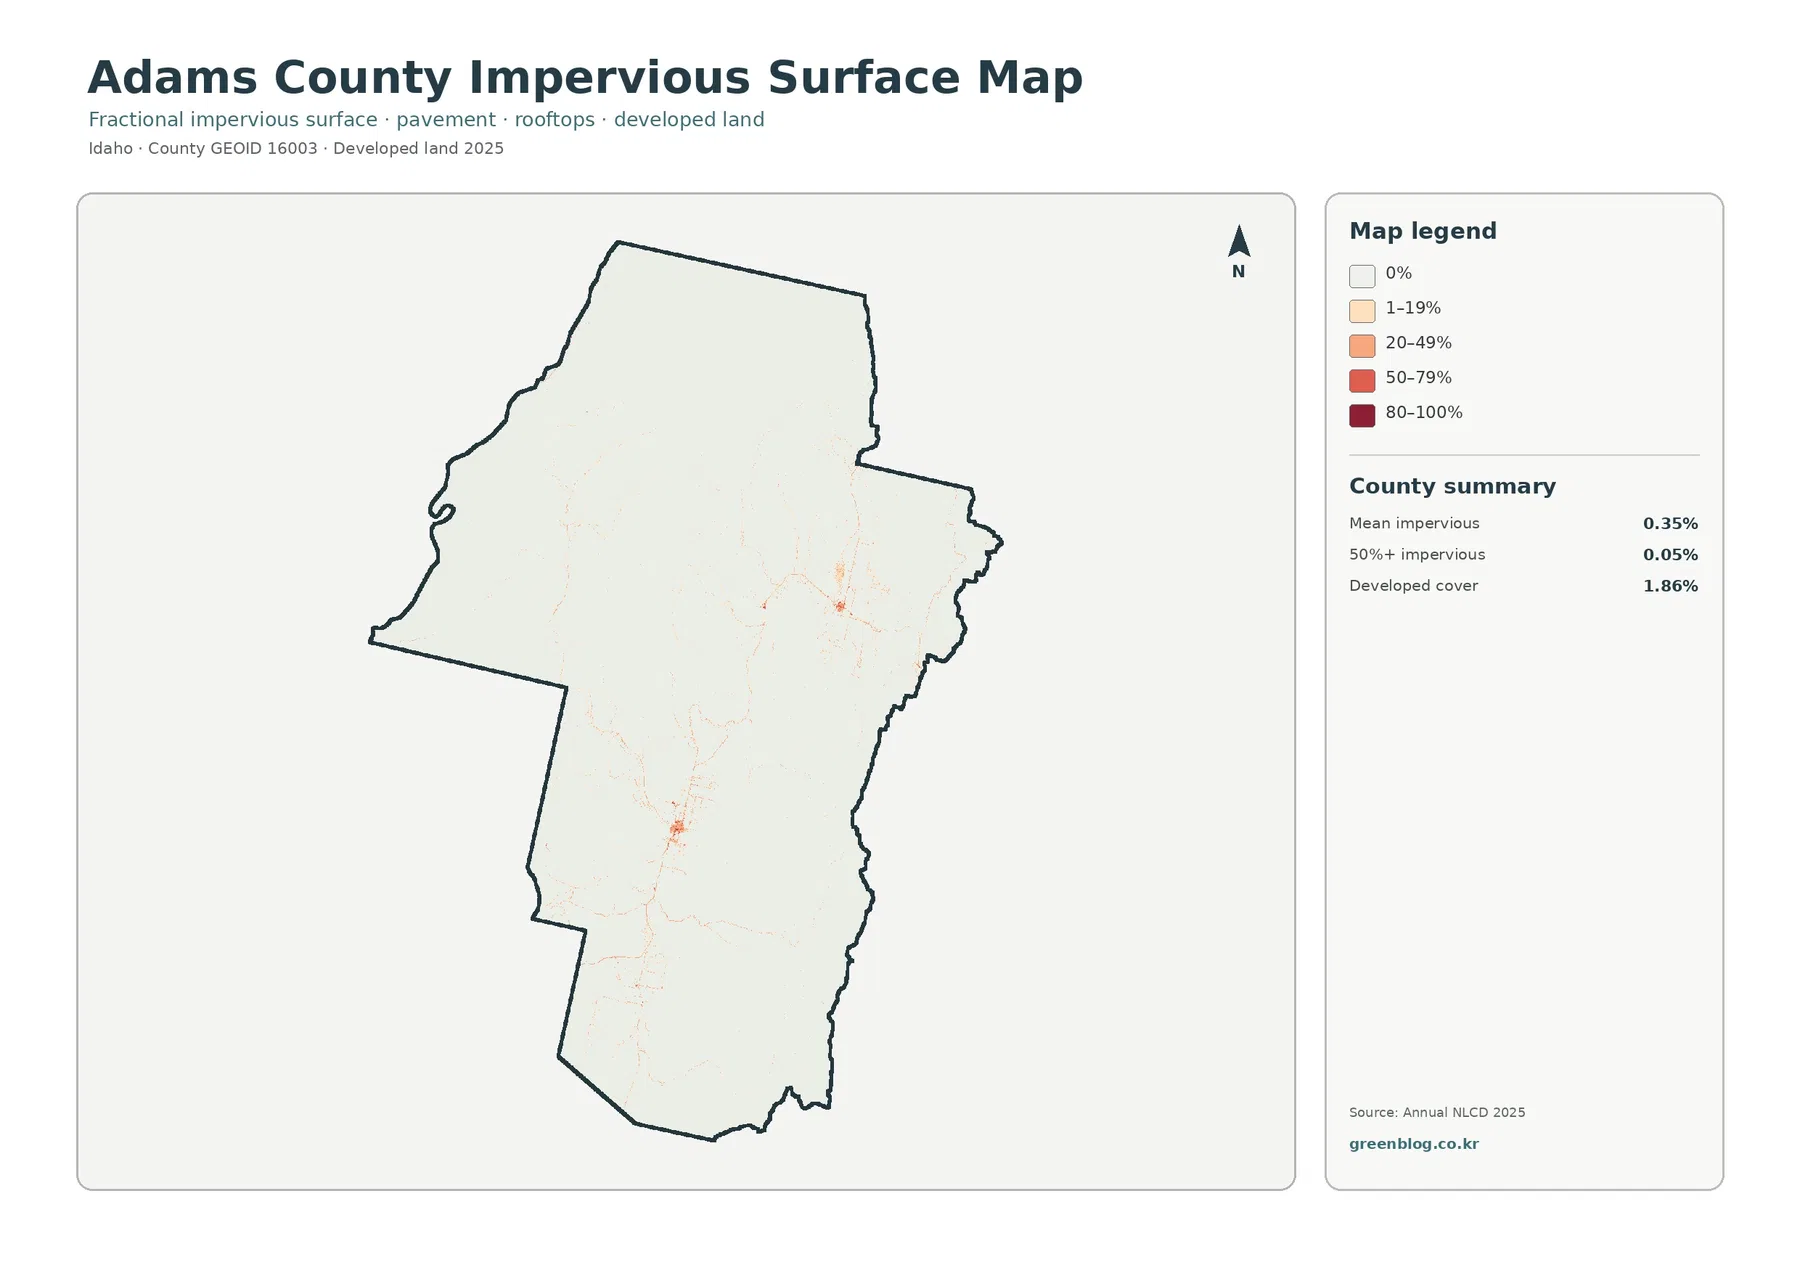
The impervious-surface map changes the visual scale of the discussion. Impervious surface means pavement, rooftops, parking areas, and other hard materials that do not readily absorb rainfall. Adams County’s mean impervious cover is only 0.35%, while land with more than 50% impervious cover accounts for 0.05%. The background is therefore overwhelmingly pale, with stronger colors appearing in only a few compact nodes and thin connecting traces.
That pattern is consistent with the 1.86% developed-land share shown on the general map, but the two measures should not be treated as identical. A developed NLCD class can include lawns, trees, bare soil, and other permeable surfaces around buildings or roads. The impervious product isolates the hard-surface fraction. A county can therefore have a larger developed class percentage than its mean impervious percentage without any contradiction.
The narrow darker lines connect the county’s small built concentrations, but they should not be read as a road map. The image does not identify route numbers, traffic volumes, public versus private roads, or legal access. Around Council, New Meadows, Indian Valley, and the connecting traces, the layer only indicates where rooftops and pavement are more concentrated than across the surrounding forest and open ground.
Placed after the 2025 overview, the impervious layer makes Adams County’s scale contrast clear: forest, grassland, and shrubland fill nearly all of the county, while hard surfaces remain confined to small nodes and thin traces. Viewed alone at a large scale, those darker built marks can look more extensive than their 0.35% countywide mean actually represents.
The 1985–2025 comparison is mostly forest and other class difference, not urban conversion
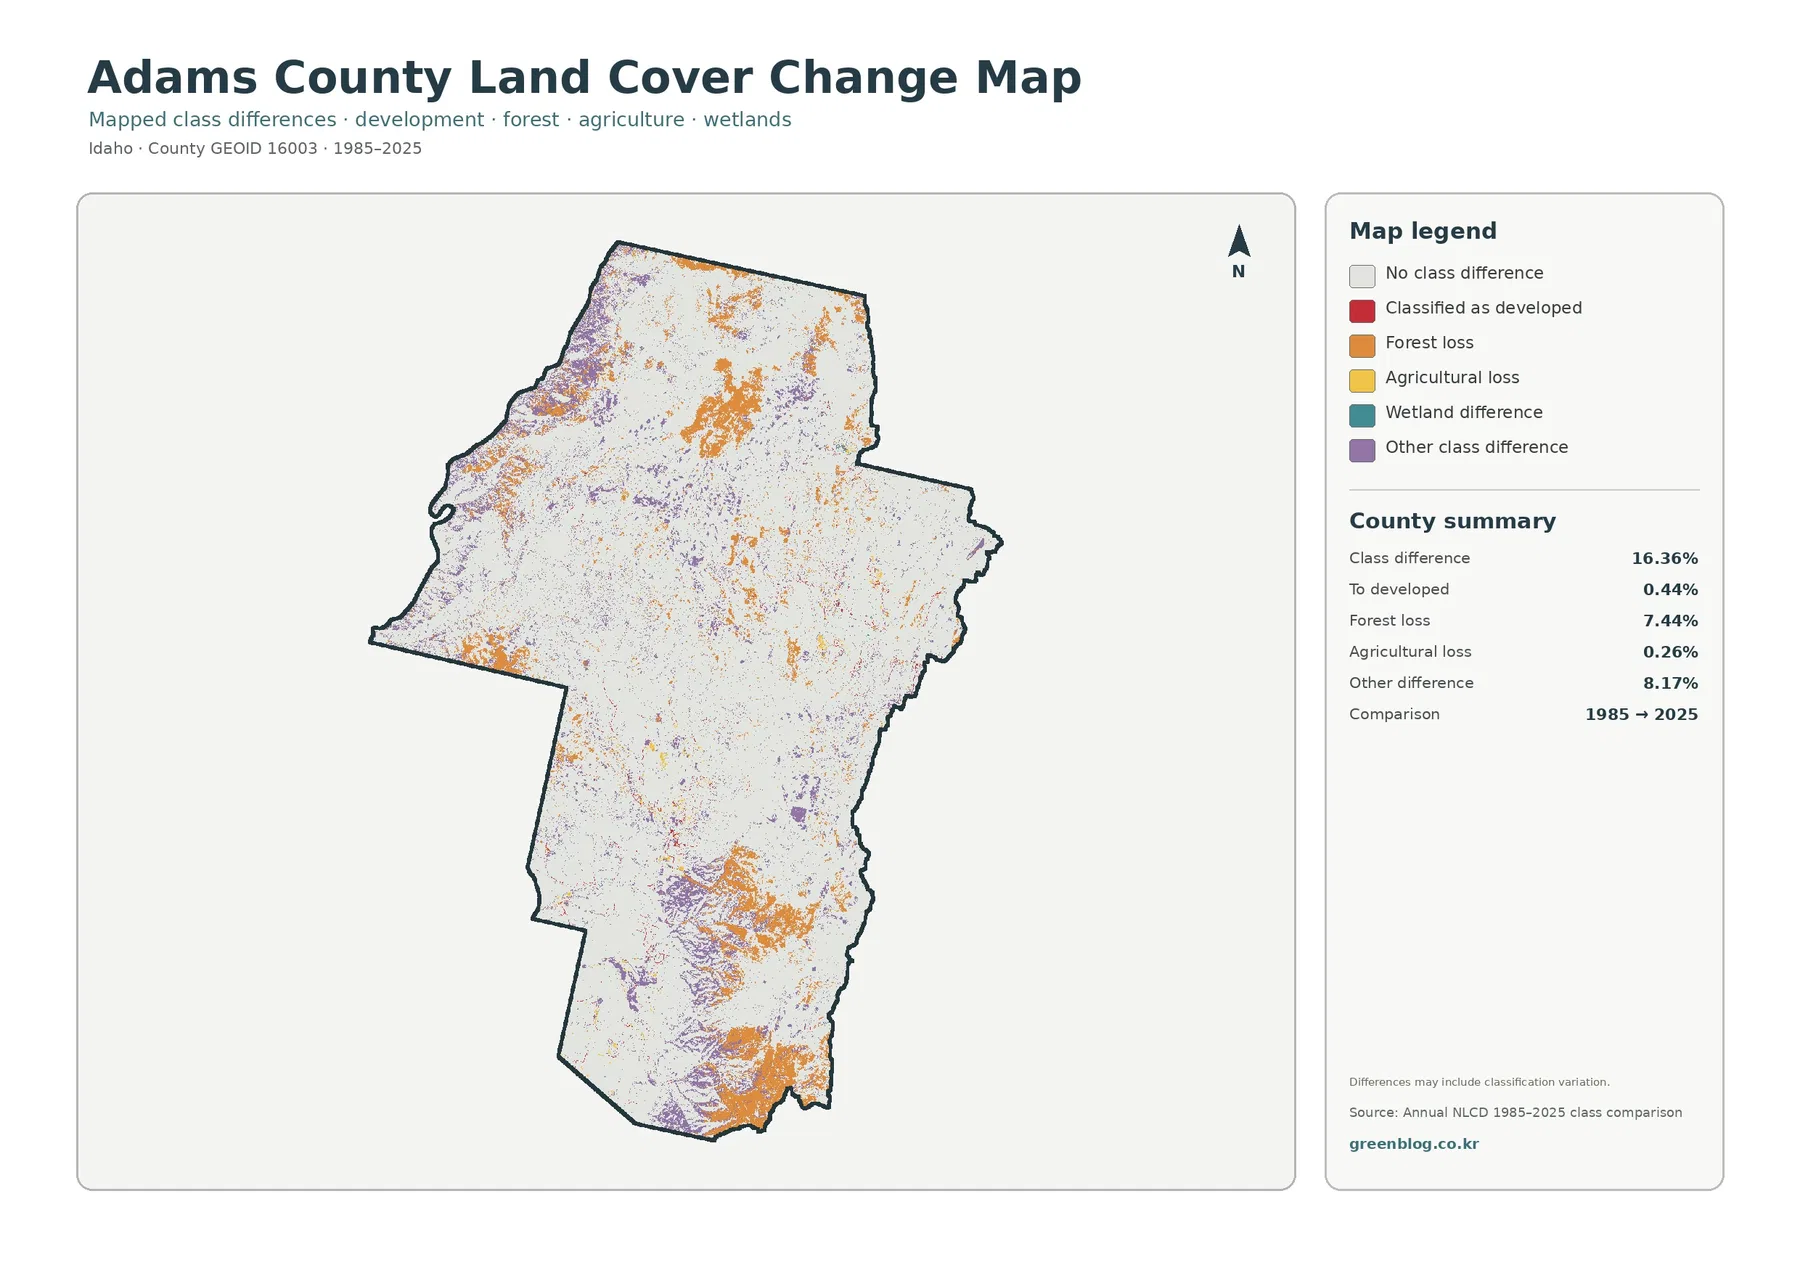
The change layer compares the 1985 and 2025 endpoints rather than telling a year-by-year story. Overall class difference is 16.36%. Forest loss is listed at 7.44%, classified-to-developed at 0.44%, agricultural loss at 0.26%, and other difference at 8.17%. The map also includes a wetland-difference category. Taken together, the displayed categories show that most mapped difference cannot be reduced to simple urban expansion.
Orange forest-loss patches appear in both northern and southern parts of Adams County. On this two-date layer, “forest loss” means that a cell was classified as forest at one endpoint and as another class at the other endpoint. The color alone does not identify permanent clearing, timber harvest, wildfire, disease, or development; those explanations require intermediate imagery and other records.
The 0.44% classified-to-developed figure is much smaller than the total class-difference percentage. Some red marks fall near the same settlement corridors highlighted by the impervious layer, but that overlap does not establish a cause. A red cell cannot by itself distinguish road work, housing, commercial construction, a classification adjustment, or another process.
The “other difference” category is 8.17%, larger than any single listed change category except the combined total. Much of the endpoint difference can therefore involve movement among shrubland, grassland, forest, barren ground, and other non-developed classes. A specific orange, red, or other-colored patch should be checked against intermediate imagery before assigning a date or cause.
Choose the Adams County view by the feature being compared
The 2025 land-cover map contains the full mix of forest, grassland, shrubland, agriculture, developed cover, water, wetlands, and minor classes. It shows why Adams County is neither uniformly wooded nor uniformly open: broad western and southern grass-and-shrub areas interrupt the forest, and only a few narrow agricultural concentrations break the natural-cover pattern.
The forest-and-farmland version isolates the wooded blocks, open vegetation, and small cultivated pockets. The impervious layer isolates rooftops, pavement, and the county’s few built concentrations. The class-difference layer should be read only as a comparison between the 1985 and 2025 endpoints, not as a continuous history of what happened in the intervening years.
For a built-surface comparison, place the 2025 overview beside the impervious layer and compare the small Council–New Meadows–Indian Valley footprint with the surrounding natural cover. For vegetation change, compare the simplified forest-and-farmland view with the 1985–2025 layer. Keeping the images large enough to read is more informative than shrinking all four legends into one crowded panel.
Each downloadable JPG is 2480 × 1754 pixels. The supplied asset manifest does not identify these files as meeting an A3 high-resolution reference, so a proof print should be checked before producing a large poster. When resizing, preserve the original aspect ratio so Adams County’s outline and the narrow agricultural and developed features are not distorted.
What the maps cannot answer
Annual NLCD is designed for consistent regional land-cover classification, not parcel surveying. Its raster cells summarize the predominant class within each mapped cell. A single cell can contain trees, grass, a ditch, pavement, and a building while still receiving only one main class. Enlarging the JPG makes the pixels easier to see but cannot recover parcel-level detail that was never present in the source data.
Land cover is also different from land use, zoning, and ownership. A forest-colored area is not automatically protected land, and a developed-colored area does not tell whether the legal use is residential, commercial, industrial, or public. Wetland colors are not a jurisdictional wetland determination. For permits, ownership, road status, property boundaries, or regulatory decisions, consult current county and agency records rather than this reference map.
The current maps represent the supplied 2025 observation year. Construction, vegetation recovery, fire effects, forest management, agricultural activity, or other changes after that date may not appear. The two-date map has a separate limitation: a location could change several times between 1985 and 2025 and still end in a class similar to its starting class. Intermediate imagery is needed when timing matters.
At county scale, the four images clearly separate Adams County’s forested high country, western and southern open vegetation, small agricultural pockets, limited built surfaces, and endpoint class differences. They should not be used to decide parcel boundaries, legal access, ownership, wetland jurisdiction, or current site conditions, because those questions require current site-specific records.
Download the four Adams County JPG maps
The ZIP below contains the four original JPG maps discussed on this page: 2025 land cover, forest and farmland, impervious surface and developed land, and the 1985–2025 land-cover class-difference map. The set keeps the countywide forest–grassland pattern, the small farm pockets, the limited hard-surface footprint, and the endpoint-difference layer in one package.
Frequently Asked Questions
What is the largest land-cover class in Adams County?
Forest is the largest 2025 class at 49.75%. Grassland follows at 25.23% and shrubland at 18.92%, so the county is best understood as a mix of extensive forest and extensive open vegetation rather than forest alone.
Why is developed cover 1.86% while mean impervious cover is only 0.35%?
Developed classes can contain lawns, trees, soil, and other permeable surfaces around buildings and roads. Impervious cover isolates hard surfaces such as rooftops and pavement, so its countywide average can be much lower than the developed-land share.
Does 16.36% class difference mean 16.36% of the county was physically damaged?
No. It is the share of mapped cells assigned different classes at the 1985 and 2025 endpoints. The summary includes 7.44% forest loss, 0.44% classified as developed, 0.26% agricultural loss, and 8.17% other difference. Determining the timing and cause of a specific change requires additional evidence.
Sources and Reference Data
- MRLC Annual NLCD Data – official access point for current land-cover and comparison products
- USGS Annual NLCD Land Cover Classification – definitions for forest, grassland, shrubland, agriculture, developed land, wetlands, and other classes
- Adams County, Idaho – official county information, GIS access, public services, and natural-resource links
- Adams County Road & Bridge – official reference for county road operations in Council, New Meadows, and Indian Valley
- USDA Forest Service – Payette National Forest – official regional background on western Idaho forest, canyon, mountain, and grassland environments
Map File Information
The ZIP contains four original JPG maps for comparing Adams County’s forest, grassland, shrubland, limited agriculture and development, hard surfaces, and 1985–2025 class differences.
- Included Files: Original high-resolution map files shown in this article
- File Type: JPG images packaged in a ZIP archive
- Intended Use: Printing, education, presentations, and map-based projects
Related Maps
Green Map creates custom-edited map images using open geographic data sources such as geoBoundaries, Natural Earth, OpenStreetMap, and government open data. These maps are edited visual materials, not raw data files, and are provided for education, documents, presentations, and graphic reference.