Shrubland dominates the 2025 Bannock County map, covering 53.06% of the county, yet the most striking contrast sits in the north. A dense developed area around Pocatello and Chubbuck stands beside broad shrub-covered uplands, while agriculture, wetlands, and smaller built places follow the long interior valley toward the south. Forest becomes much more prominent along the eastern and southeastern sides.
The page pairs four views of the same county: 2025 land cover, forest and farmland, impervious surface with developed land, and a 1985–2025 class-difference layer. The WebP images appear in the article, and the four original 2480 × 1754 JPG maps are available together in one ZIP download. Together, the four views separate the countywide natural cover from the narrower agricultural and developed corridor, making the north–south contrast clear without treating Bannock County as one uniform landscape.
Table of Contents
A shrub-covered county narrows into a very different Portneuf Valley landscape
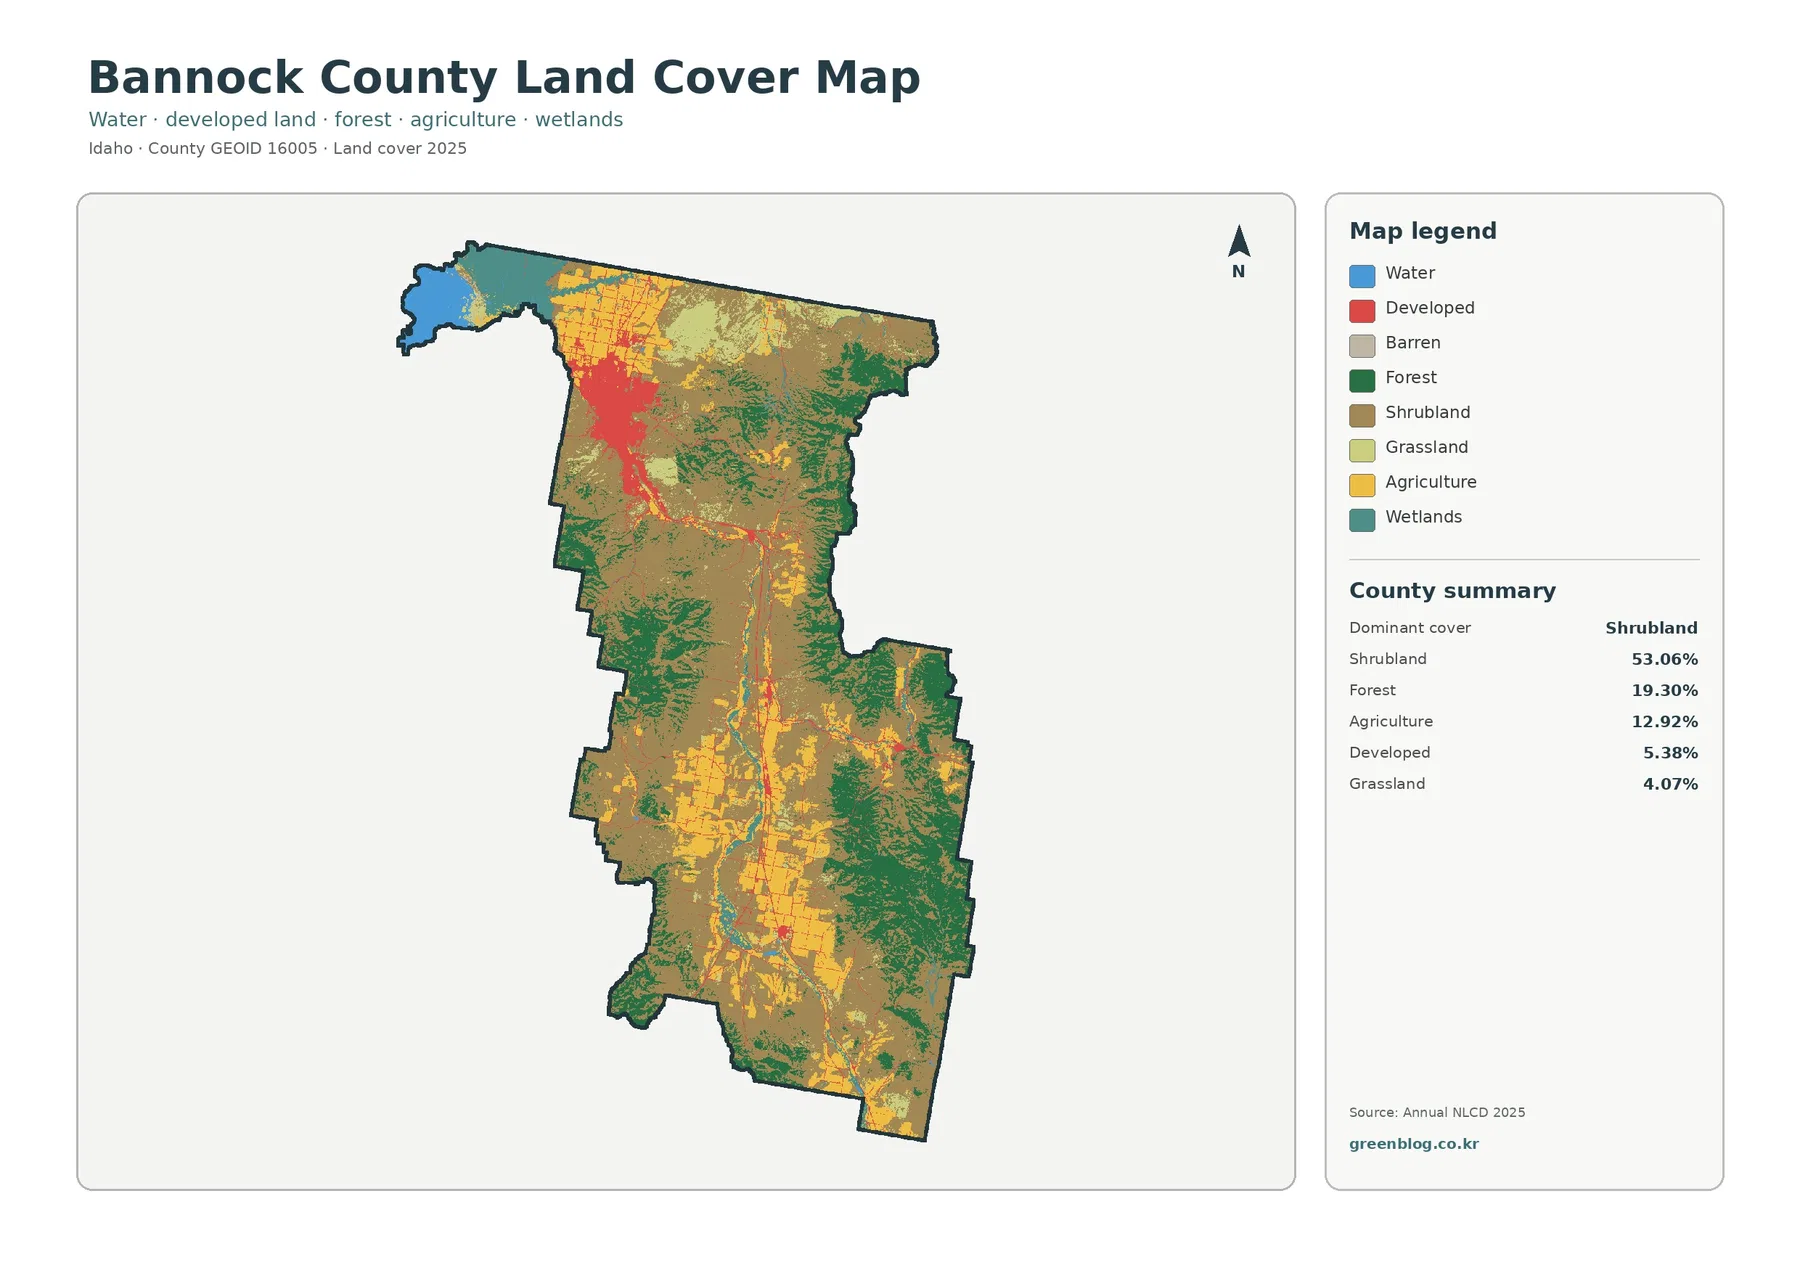
The county summary places shrubland first at 53.06%. Forest accounts for 19.30%, agriculture 12.92%, developed land 5.38%, grassland 4.07%, wetlands 3.56%, and open water 1.62%. Those percentages explain the overall balance, but the map adds an important second layer: the classes are not evenly mixed. Large shrub-covered areas occupy much of the west and central uplands, while forest forms broader green blocks farther east and southeast.
The northwestern portion looks almost like a different county. A large blue water body occupies the far northwest, broad agricultural blocks spread immediately east and southeast of it, and a strong red developed concentration appears farther south. Federal and Idaho sources place American Falls Reservoir partly in Bannock County, so that large water body is a useful geographic reference when orienting the map. Open water is only 1.62% countywide, but its concentration in one large feature makes it visually prominent.
South of that water and farm area, the largest developed footprint corresponds broadly with the Pocatello–Chubbuck part of the county. Bannock County’s own GIS services list both cities and show them as major mapped places in the north. The land-cover image does not draw municipal boundaries, so an individual red cell should not be assigned to a city without a boundary layer. What the image does establish clearly is that the county’s largest continuous built surface is concentrated in this northern area.
A narrow sequence of agriculture, wetlands, water, and small developed patches extends south from the northern urban concentration. Idaho water agencies describe the Portneuf River system through the McCammon, Inkom, Pocatello, and Chubbuck area. The long central strip on the land-cover map broadly matches that valley setting: cultivated ground and settlement occupy a narrow route while shrubland and forest expand quickly on either side.
Agriculture is concentrated in the valley instead of spread across the shrubland majority
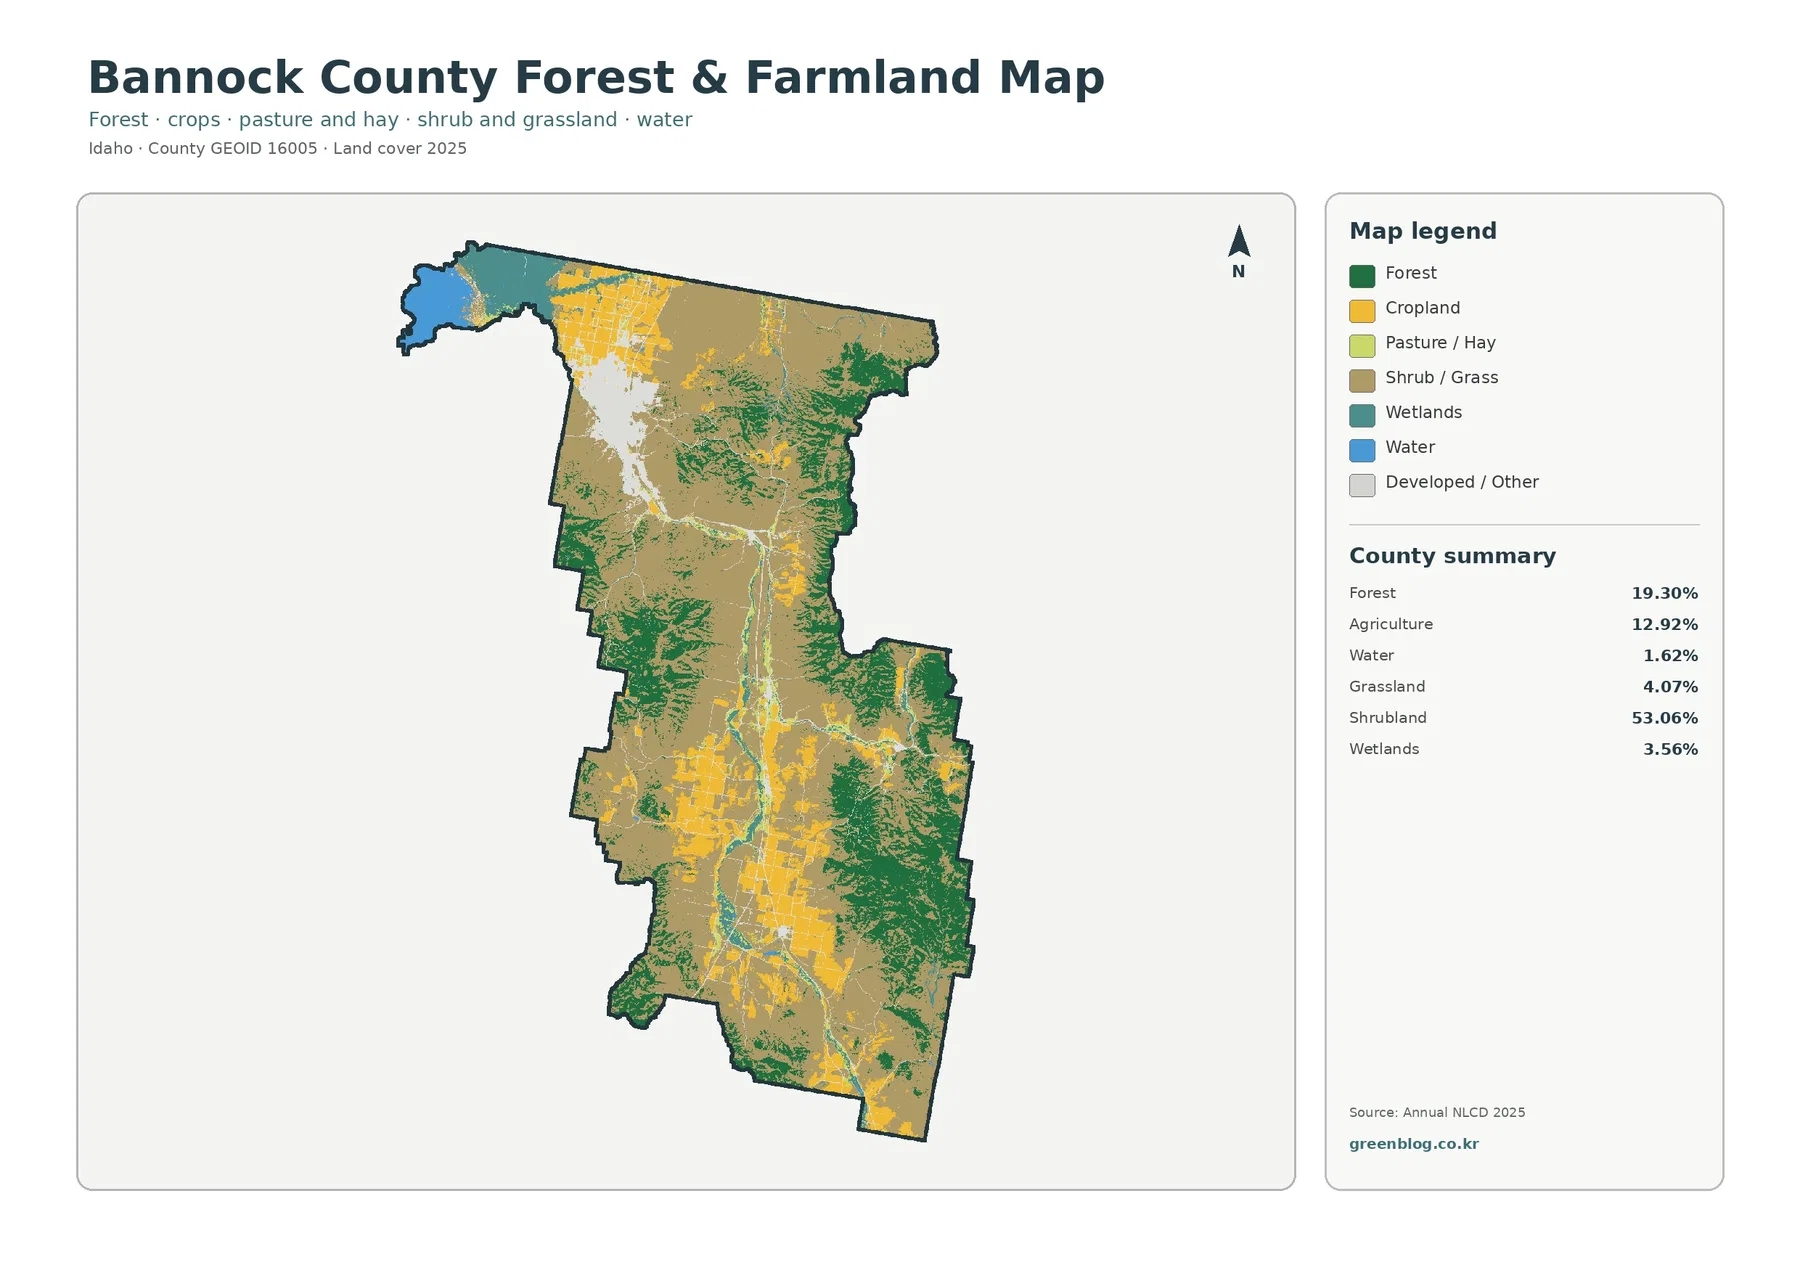
Agriculture covers 12.92% of the supplied 2025 summary, but it is far more concentrated than that number might suggest. The broadest farm blocks occur in the north, near the reservoir and the northern developed area. Farther south, agriculture becomes a chain of narrower fields and compact patches that follow the interior valley. It rarely forms a continuous countywide belt.
This simplified map is especially helpful in Bannock County because open natural cover can otherwise be mistaken for working land. More than half of the county is shrubland and another 4.07% is grassland. Those open classes can look superficially similar to lightly colored farm country at a quick glance, but the vegetation map separates cropland and pasture/hay from the much larger shrub-and-grass matrix.
Forest tells a different story. The 19.30% forest share is strongest in the east and southeast, with additional wooded pieces along the western and southern margins. Forest does not simply form a ring around the county. Instead, green blocks alternate with shrubland and valley agriculture, creating sharp local transitions. Those transitions are useful places to compare the full land-cover map with the simplified vegetation view.
The Portneuf River subbasin provides useful regional context for this arrangement. Idaho Department of Environmental Quality describes agriculture, rangeland, and urban land as major land uses in the subbasin. That description is not an NLCD class table, but it matches the broad county pattern seen here: cultivated and developed surfaces are concentrated in a valley surrounded by much larger areas of shrubland, grassland, and forest.
Wetlands account for 3.56%, more than twice the open-water share. In the vegetation image, wetland colors occur in narrow bands and small patches near the principal water corridor and the large northwestern water body. They should not be treated as open water or as a legal wetland determination. The map is a land-cover classification, while regulatory wetland boundaries require specialized current data.
Pocatello and Chubbuck create a compact hard-surface center in an otherwise low-impervious county
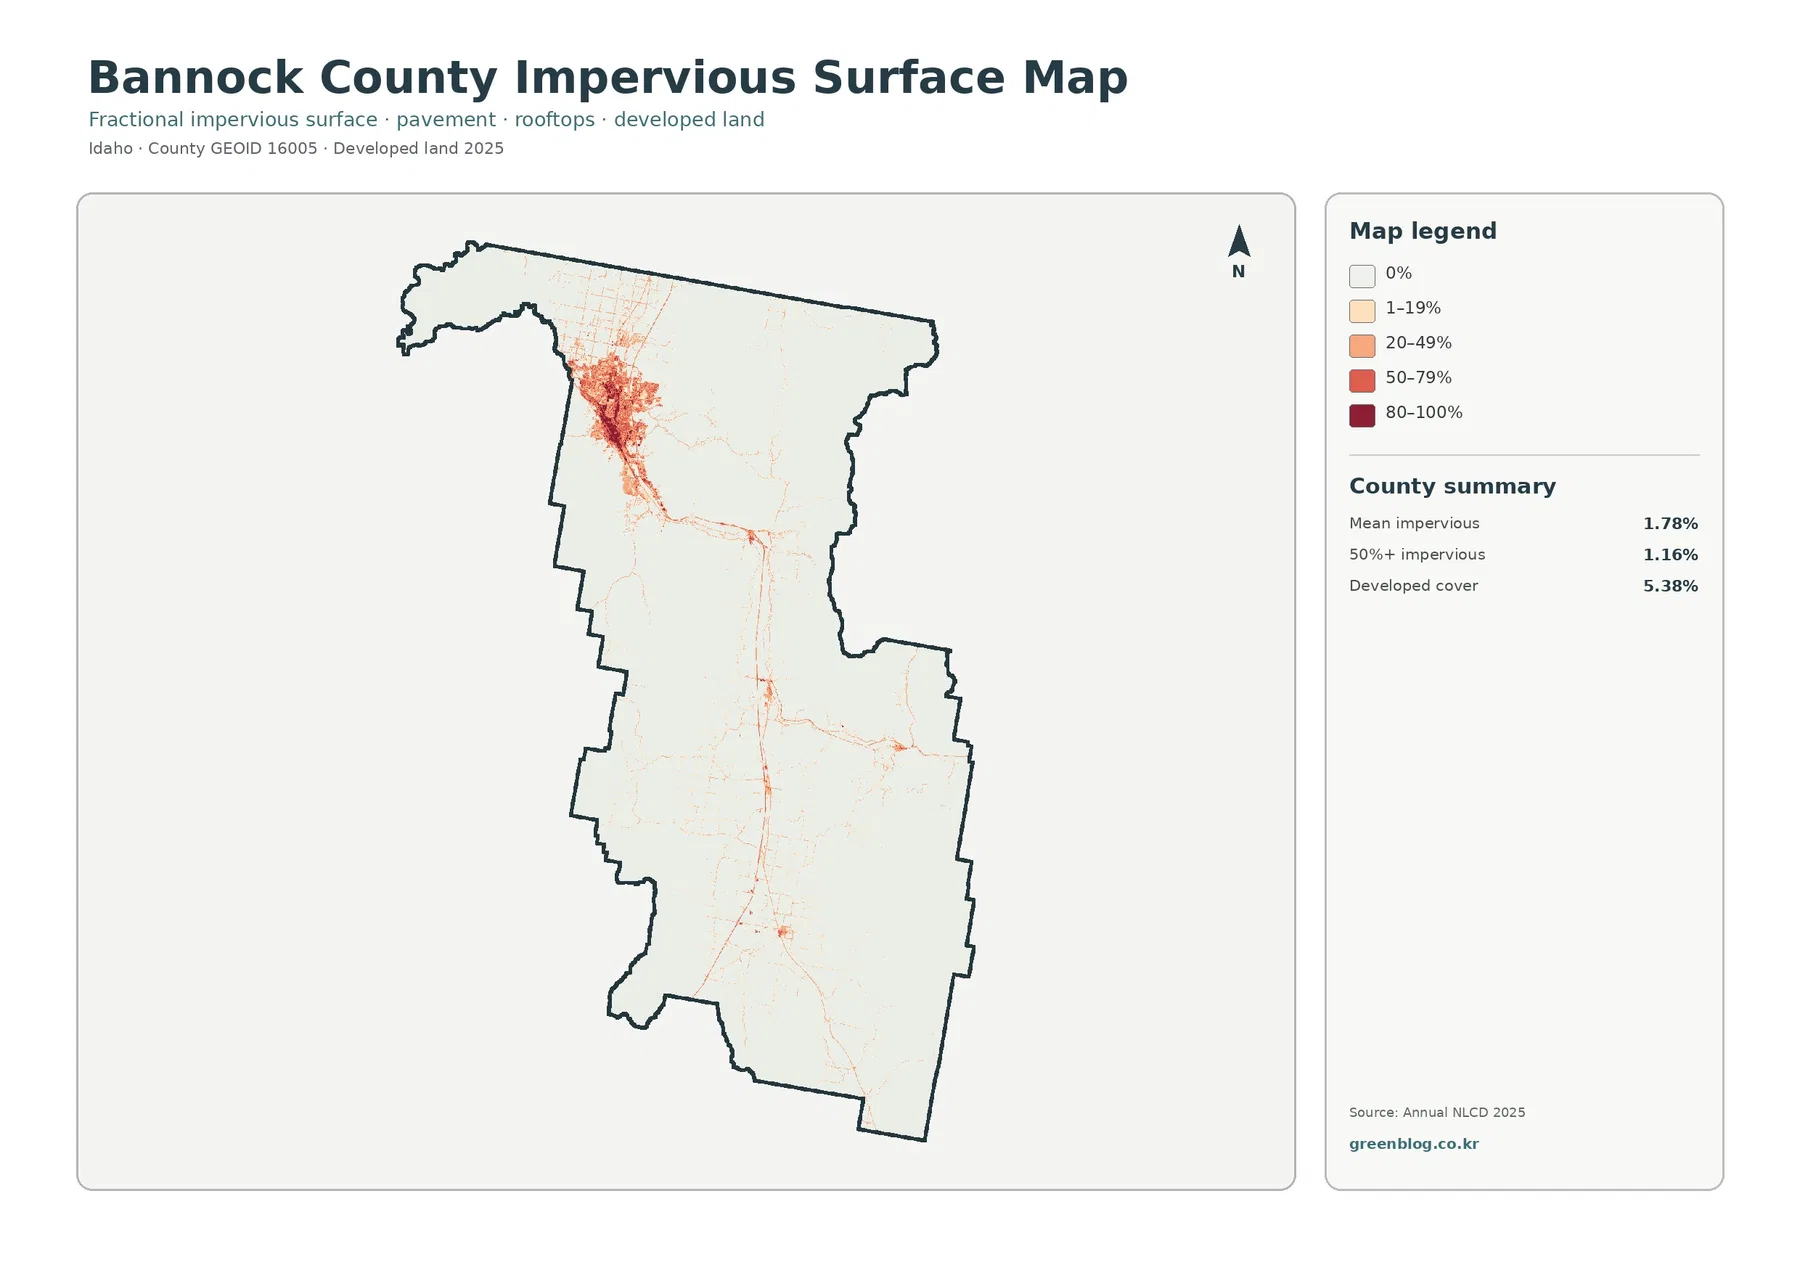
Impervious surface means pavement, rooftops, and similar materials that do not readily absorb water. Bannock County’s mean impervious value is 1.78%, and 1.16% of the county is mapped at 50% or greater imperviousness. Developed land covers 5.38%, a larger figure because developed NLCD classes can include lawns, trees, bare soil, and other permeable surfaces around buildings and roads.
The northern concentration is unmistakable. Dense orange and red values form a broad cluster where the county GIS places Pocatello and Chubbuck. Smaller hard-surface traces extend outward along connecting routes, but they fade quickly into near-zero backgrounds. This is why a low countywide average can coexist with a locally intense built area: most of Bannock County remains shrubland, grassland, forest, or agriculture.
The central valley appears as a much thinner network. Lines and small nodes continue south through the same general corridor occupied by agriculture and water features on the other maps. Official Bannock County mapping services cover places such as Inkom, McCammon, Arimo, Downey, and Lava Hot Springs in addition to Pocatello and Chubbuck. The impervious image does not label those cities or identify roads, so it is best used to compare concentration rather than to name every line.
Putting the impervious image beside the general land-cover map changes the scale of the story. The hard-surface layer makes the northern built area look dominant because almost everything else is pale. The land-cover map restores the county context: shrubland alone covers 53.06%, forest 19.30%, and agriculture 12.92%. The built footprint is regionally important but still occupies a relatively small share of the county’s total surface.
The 1985–2025 layer is driven more by agricultural and other class differences than by development
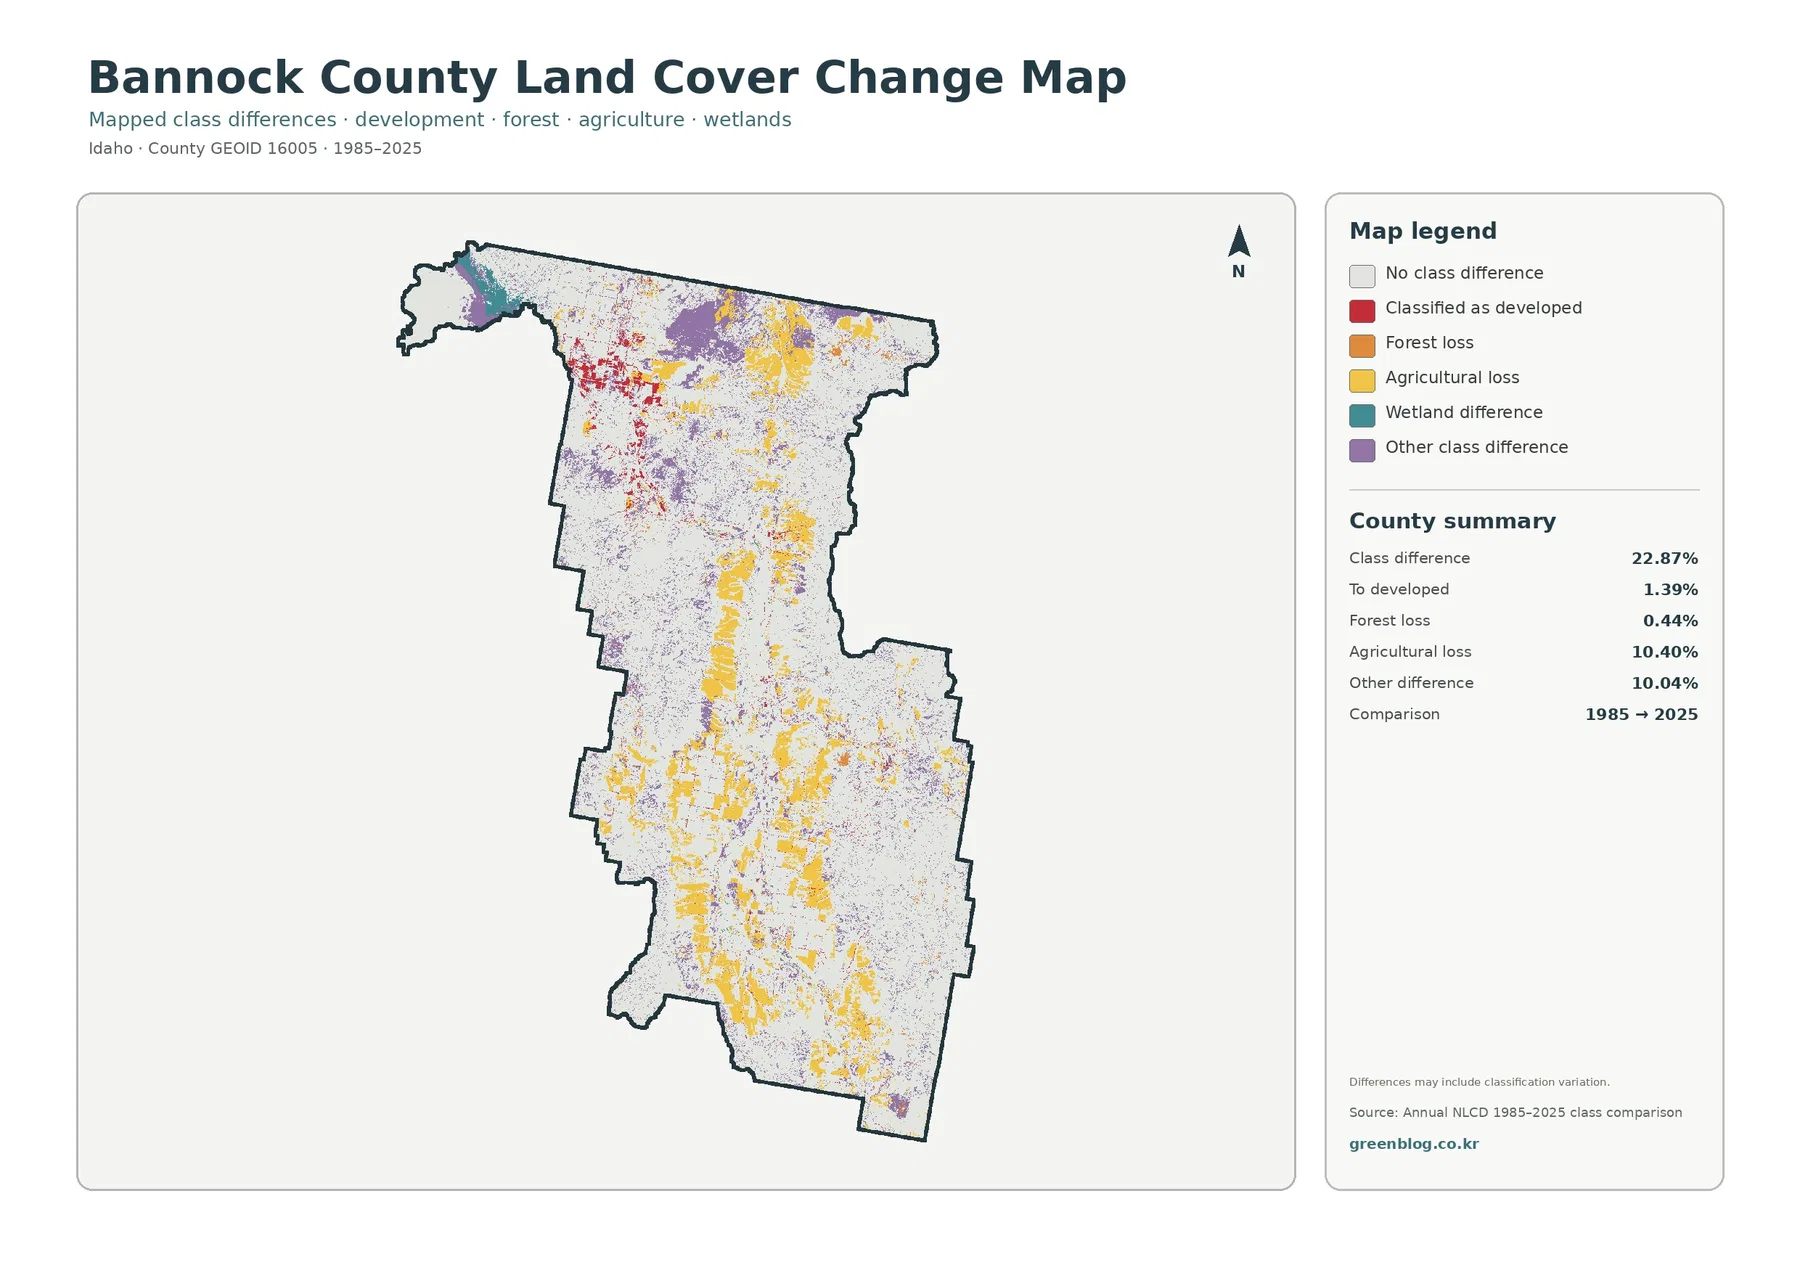
The change map compares the 1985 and 2025 endpoints rather than recording every year between them. In the supplied summary, 22.87% of cells have a different class at the two endpoints. Agricultural loss is the largest named category at 10.40%, followed closely by other class difference at 10.04%. Only 1.39% is listed as classified to developed, while forest loss is 0.44%.
Yellow agricultural-loss cells occur across the northern farm country and continue through the central and southern valley. Their location makes them easy to compare with the current agricultural map, but the label should be read carefully. It means a cell classified as agricultural at the earlier endpoint is in another class at the later endpoint. It does not by itself show whether farming ended permanently, whether a field rotated into grass, or whether the classification changed because of mixed cover.
Red cells classified to developed are much more limited than the yellow agricultural differences. They are concentrated most clearly near the northern urban area and appear in smaller amounts along the interior corridor. Their proximity to present-day built surfaces is a useful screening clue, not proof of a particular development project. Parcel records, construction history, or intermediate aerial imagery would be needed to determine what happened at a specific location.
Forest loss at 0.44% is a minor part of the countywide difference total. Orange patches appear around some forest edges, especially where green forest meets open shrub or grass cover. A two-date class change cannot identify logging, wildfire, disease, clearing, or vegetation recovery as the cause. The safest interpretation is simply that the endpoint class differs from forest at those cells.
The 10.04% other-difference category is nearly as large as the agricultural-loss figure. That matters in a county where shrubland and grassland are so extensive. Many endpoint changes can occur among shrub, grass, barren, forest, wetland, and other non-developed classes. Calling the full 22.87% “land converted to development” would therefore be incorrect; the mapped developed-conversion component is only 1.39%.
Frequently Asked Questions
What is the dominant land-cover class in Bannock County?
Shrubland is the largest 2025 class at 53.06%. Forest follows at 19.30%, agriculture at 12.92%, developed land at 5.38%, grassland at 4.07%, wetlands at 3.56%, and open water at 1.62%. The shrubland majority is strongest outside the narrow agricultural and developed valley.
Why does Pocatello look much stronger on the impervious map than on the countywide map?
The impervious layer isolates rooftops, pavement, and other hard surfaces, so the Pocatello–Chubbuck concentration stands out against a mostly pale county background. Mean impervious cover is only 1.78% countywide because most of Bannock County is shrubland, forest, grassland, or agriculture. The developed-land share of 5.38% measures a broader class than hard surface alone.
Does the 22.87% class difference mean that almost a quarter of the county was developed?
No. Only 1.39% is listed as classified to developed. The total also includes 10.40% agricultural loss, 10.04% other class difference, 0.44% forest loss, and other mapped differences. The layer compares 1985 and 2025 endpoints and does not identify the cause or timing of every changed cell.
Thirty-meter classification is useful at county scale but not for parcel decisions
Annual NLCD uses 30-meter raster cells. Each cell receives a predominant land-cover class even when the ground contains a mixture of pavement, grass, crops, shrubs, trees, water, or buildings. At county scale, this generalization keeps broad patterns legible, but it cannot reproduce a survey line, a narrow ditch, a small yard, or the exact edge of a field.
Land cover should also be kept separate from land use and zoning. A developed pixel does not tell you whether a parcel is zoned residential or commercial, and an agricultural pixel is not a legal statement about agricultural protection or ownership. Bannock County Planning & Development Services and the county GIS provide separate resources for zoning, parcel, planning, and local boundary questions.
The current maps represent the supplied 2025 observation year. Construction, vegetation change, crop conditions, fire effects, restoration, or water-level changes after that year may not appear. The 1985–2025 comparison is also a two-date snapshot. A cell could change several times between those dates and still end in a class similar to its starting point.
Each downloadable JPG measures 2480 × 1754 pixels. The 2480 × 1754 files fit screens, documents, classroom handouts, and many presentation layouts, but the asset manifest does not mark them as meeting an A3 high-resolution reference. Test a proof before making a large poster, and preserve the original aspect ratio so the county outline and narrow valley features are not stretched.
Map File Information
The ZIP contains the four original Bannock County JPG maps used here, covering current land cover, forest and farmland, impervious surface and developed land, and the 1985–2025 endpoint comparison.
- Included Files: Map images described in this article
- File Type: ZIP archive
- Intended Use: Printing, education, presentations, and map-based projects
Related Maps
Sources and Reference Data
- MRLC Annual NLCD Data – official access point for annual land-cover and change products
- USGS Annual NLCD Land Cover Classification – class definitions for shrubland, grassland, forest, agriculture, developed land, wetlands, and water
- Bannock County GIS – official county maps and local geographic reference
- Idaho DEQ Portneuf River Subbasin – official background on the Portneuf River basin and its agriculture, rangeland, and urban context
Green Map creates custom-edited map images using open geographic data sources such as geoBoundaries, Natural Earth, OpenStreetMap, and government open data. These maps are edited visual materials, not raw data files, and are provided for education, documents, presentations, and graphic reference.