The Humboldt County California Land Cover Map gives a countywide view of a landscape dominated by forest, with smaller areas of shrubland and grassland and a much more concentrated developed footprint in the west. The 2025 summary identifies forest as the dominant cover at 74.01%, followed by shrubland at 11.14%, grassland at 6.11%, developed land at 3.76%, and wetlands at 1.60%. Those percentages are useful on their own, but the map adds the more important geographic question: where do those categories actually occur?
This page includes four related maps: general land cover, forest and farmland, impervious surface and developed land, and a 1985–2025 land cover change comparison. The WebP versions are designed for quick viewing on the page, while the download section provides the four original JPG maps together in one ZIP file. Land cover describes what is visible on the ground surface from a classification system. It is not a parcel map, zoning map, ownership map, or statement about where future development is legally allowed.
Table of Contents
A forest-dominated 2025 landscape with development concentrated in one part of the county
Forest is the clearest feature of the general land cover map. Dark green covers most of the county from north to south and forms broad, continuous areas through much of the interior. The 74.01% forest share therefore matches what is immediately visible in the map rather than appearing as an abstract statistic. That classification does not identify tree species, stand age, ownership, or forest management condition. It simply indicates that those cells were classified as forest in the 2025 land cover data.
Shrubland and grassland provide the next layer of detail. Shrubland accounts for 11.14% of the county, while grassland represents 6.11%. These categories appear as larger patches around parts of the eastern edge, in the south, and within breaks in the forest. Looking at them alongside the forest prevents the county from being reduced to a single “all forest” description. Natural cover is extensive, but it includes several forms of vegetation that create noticeable differences from one part of the county to another.
Developed land is only 3.76% of the 2025 classification, yet its location is visually important. The largest red areas are clustered in the western middle portion of the county, with smaller developed patches extending away from that concentration. Tiny developed marks also appear elsewhere, but the broad forested interior contains relatively little red. A countywide average can therefore understate how visible development becomes inside a smaller settlement area. The map is most informative when total percentage and local concentration are considered together.
Water and wetlands occupy smaller shares but help define the western pattern. The forest and farmland summary reports 1.16% water, while the general map lists wetlands at 1.60%. A larger blue water feature is visible in the western middle area, and wetland colors occur around that part of the county and in other smaller locations. Narrow streams, wetland edges, and small water bodies may be simplified by a 30-meter raster classification, so these shapes should not be treated as surveyed or legal aquatic boundaries.
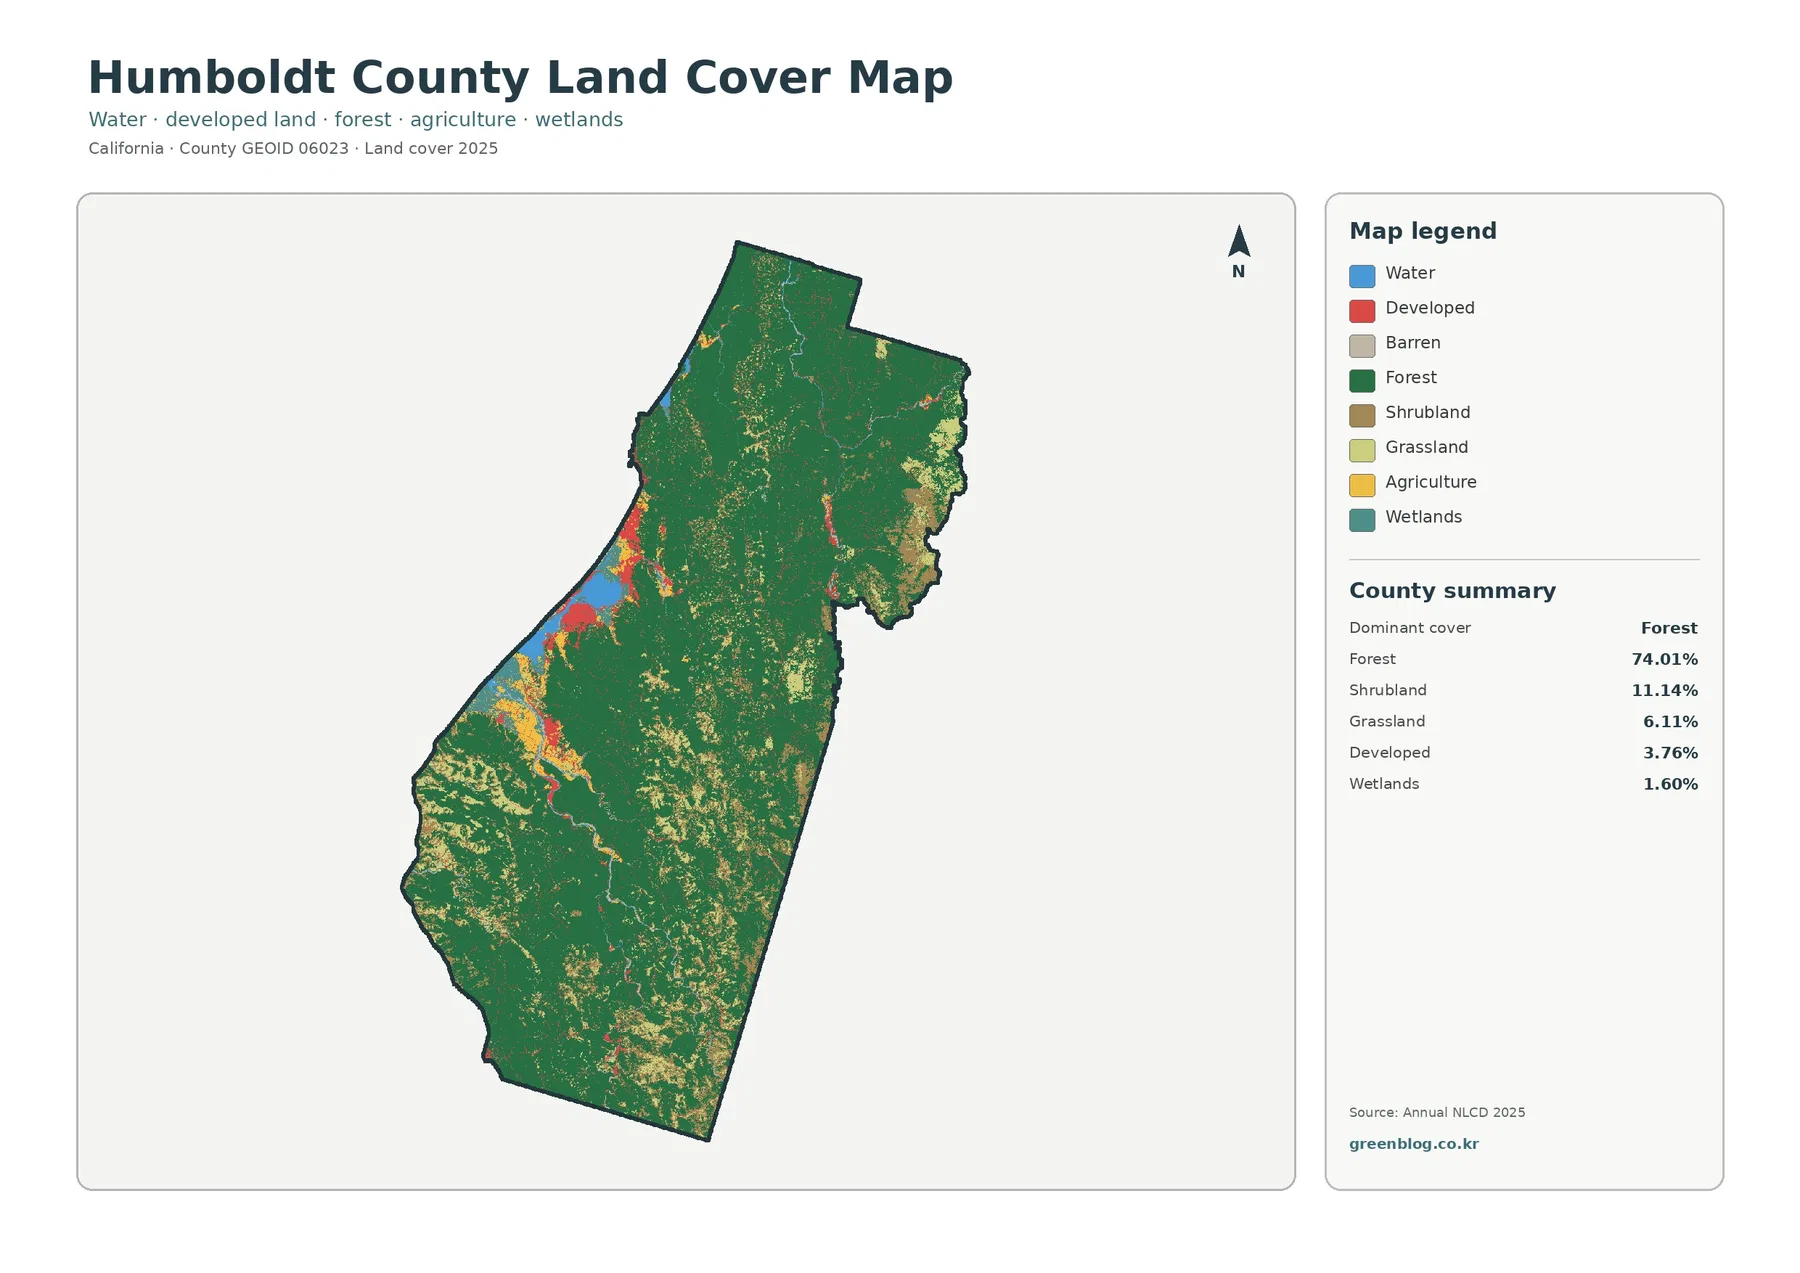
A practical way to read this map is to begin with the dominant green forest, then identify where shrubland and grassland interrupt it. After that, look for the red developed areas, blue water, and wetland colors. This order is easier than trying to memorize every legend class at once. It also keeps the focus on spatial distribution rather than treating a county summary table as the whole story.
Forest and farmland become easier to compare when the legend is simplified
The forest and farmland map groups the landscape into a smaller set of categories that are easier to compare in a classroom, report, or presentation. Forest again covers 74.01% and remains the dominant visual feature. Agriculture accounts for just 1.47%, so agricultural colors appear in relatively small areas instead of forming a broad countywide belt. The contrast is clear: Humboldt County’s mapped surface is primarily forest and other natural vegetation, while agriculture occupies a much smaller share.
Grassland at 6.11% and shrubland at 11.14% are far more extensive than agriculture. They occur along forest edges and in larger openings, especially toward portions of the east and south. These categories describe vegetation visible in the land cover classification. A grassland cell does not automatically mean that the site is used as pasture, just as shrubland does not reveal whether a parcel is privately owned, publicly managed, protected, or available for development.
Humboldt County’s Natural Resources Planning program addresses water resources, environmental restoration, habitat conservation, forest health, and other resource concerns. That official county context helps explain why forest, water, habitat, and open-space issues are important topics locally. It should still be kept separate from the satellite-based map. A planning program describes policies and management responsibilities, while Annual NLCD classifies the surface condition of raster cells for a given year.
The 1.47% agricultural share is useful for comparison, but it should not be used as a direct substitute for farm acreage or an agricultural land inventory. Cropland, pasture, and other agricultural conditions can be classified differently depending on the source and date. The map tells readers where agricultural cover was identified in the 2025 classification. Agricultural production, crop types, and protected farmland require dedicated agricultural records rather than inference from map color alone.
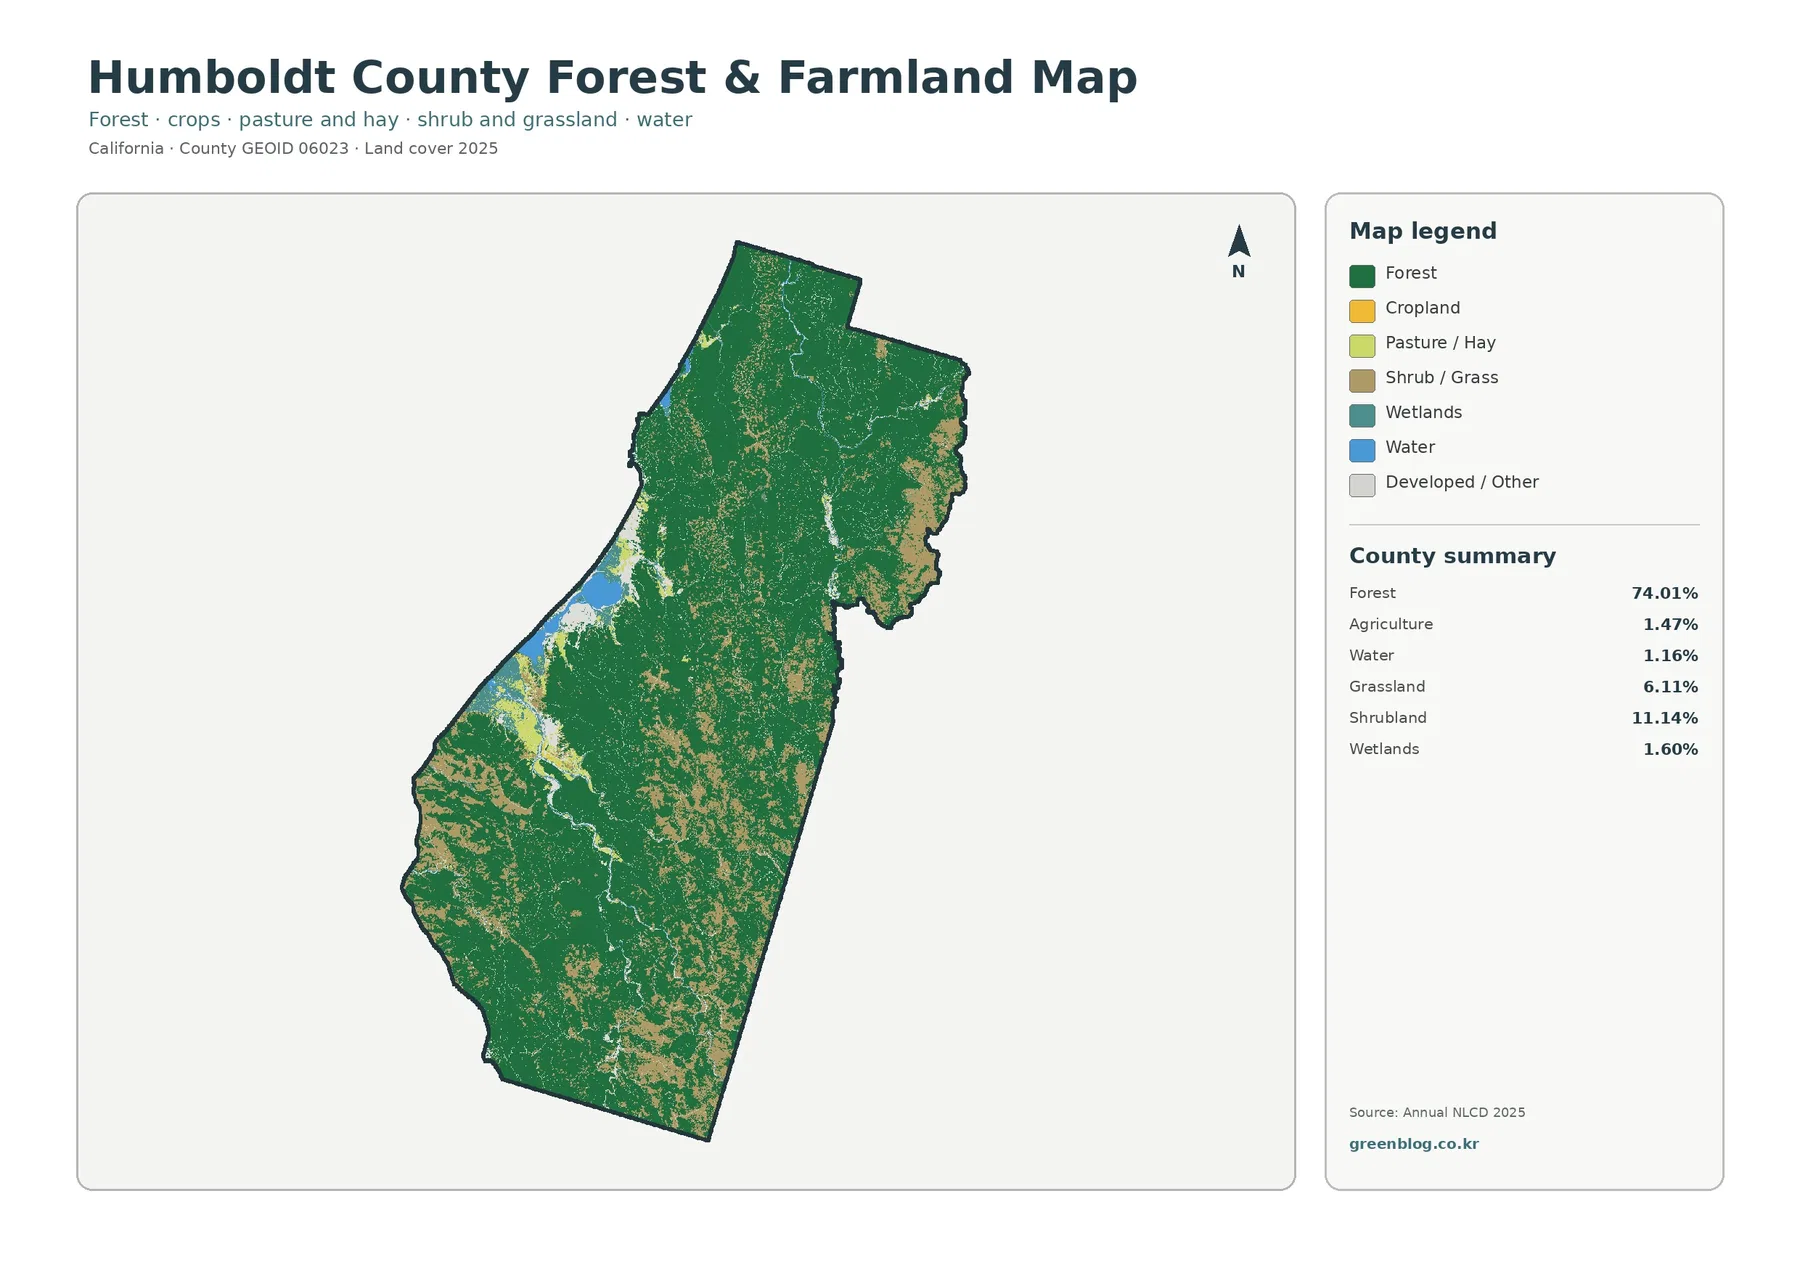
This simplified map works especially well when the goal is to explain the balance between forest and more open vegetation. The general map remains better for a fuller range of classes, and the impervious surface map is better for examining pavement and built surfaces. Choosing the map that matches the question makes the information easier to interpret and reduces the temptation to force one image to answer every land-related question.
Impervious surfaces reveal the concentrated footprint of roads, roofs, and pavement
Impervious surface measures the share of ground covered by materials such as rooftops, parking areas, and pavement that do not readily absorb water. Humboldt County’s mean impervious value is 0.91% for 2025, and 0.53% of the county is shown at 50% or greater imperviousness. Developed land covers 3.76%, which is a different measure. A developed land class may include lawns, trees, bare soil, and other surfaces that remain partly permeable, so developed area and impervious area should not be expected to match.
The strongest orange and red values are concentrated in the western middle part of the county. Smaller marks and thin lines extend outward from that main concentration. The same area contains the most visible developed land on the general map, while much of the forested interior remains pale or nearly white in the impervious view. This pattern shows where hard surfaces are relatively concentrated without requiring the reader to identify individual roads or buildings from a county-scale image.
A county mean of 0.91% combines very different local conditions. The value averages together areas with relatively dense roads and buildings and large forested areas with almost no mapped impervious surface. It therefore should not be used as the impervious percentage for a particular town, neighborhood, watershed, or parcel. For local stormwater work, a more detailed dataset and local drainage information would be necessary.
Humboldt County’s Natural Resources staff describe environmental review and resource management work related to roads, bridges, public facilities, parks, open space, and other county-managed features. Impervious surface information can provide useful background for those kinds of questions because it shows where hard surfaces are concentrated. It does not, however, predict flooding by itself. Rainfall, slope, soils, drainage systems, waterways, and other physical conditions all affect how water moves through a landscape.
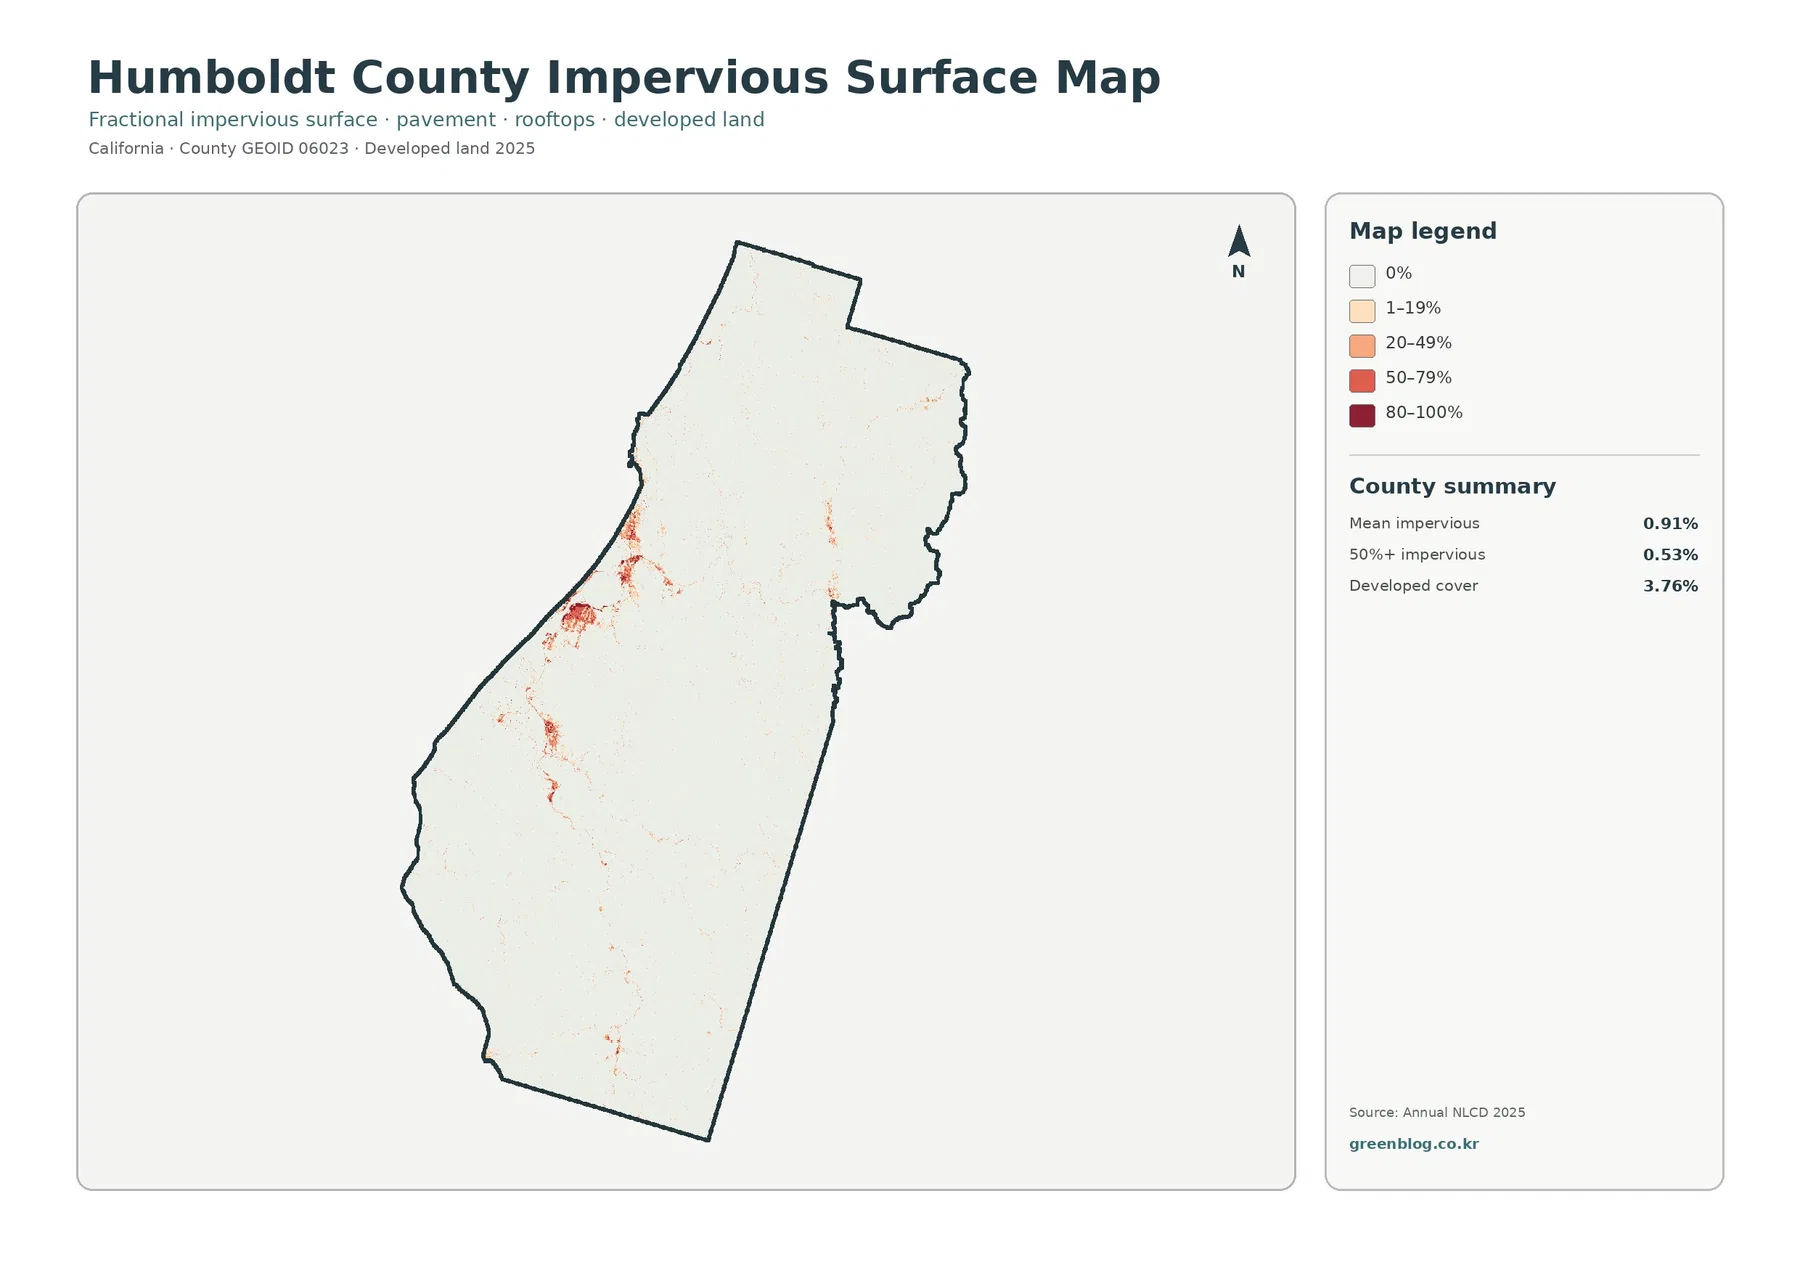
Placing the general land cover and impervious maps side by side makes the difference between “developed” and “hard surfaced” easier to explain. One map classifies a broader developed landscape, while the other estimates the intensity of pavement and roofs. That distinction is useful in environmental education, planning context, and presentations because it prevents a common mistake: assuming every developed cell is completely covered by concrete or asphalt.
The 1985–2025 change map should be read as a classification comparison, not a cause map
The land cover change map compares classifications from 1985 and 2025. The county summary reports a class difference across 14.54% of the area. The largest named components are “other difference” at 7.91% and forest loss at 5.44%, followed by 0.96% classified as a transition to developed land and 0.14% agricultural loss. These values describe differences between the two mapped classifications. They do not mean that 14.54% of the county changed for one reason or that every changed cell represents a permanent, verified land conversion.
Orange forest-loss cells are especially visible in parts of the east and northeast, with additional patches elsewhere. Comparing those areas with the 2025 map shows a mixture of forest, shrubland, and grassland in many of the same locations. A cell that was forest in the earlier classification and another category in 2025 may reflect real vegetation change, but the map alone cannot identify the cause. Fire, timber harvest, regrowth, seasonal conditions, image characteristics, and classification methods all may need to be examined before drawing a conclusion.
Purple “other difference” is the largest change category at 7.91% and is scattered across much of the county. Because this category collects class differences that are not placed into the separately named developed, forest-loss, agricultural-loss, or wetland categories, it is intentionally broad. The safest way to use it is as a locator for areas where the two classifications disagree. A reader who needs a specific explanation should compare additional Annual NLCD years, aerial imagery, or a more specialized local dataset.
The 0.96% transition to developed land is small in countywide percentage terms but is more visible around the western developed concentration. Comparing it with the present-day impervious map can show where long-term classification changes to development overlap with current areas of hard surfaces. Even then, the value is not a building-permit total, urban-growth boundary, or parcel-development figure. It is the share of cells assigned to the mapped transition-to-developed category in this two-date comparison.
Agricultural loss is listed at 0.14% and appears only in small scattered pieces. That value should not be interpreted as a complete measure of farmland conversion. Agricultural classification can be affected by crop condition, fallow periods, moisture, acquisition date, and the rules used by the classification system. Long-term agricultural change is better evaluated with agricultural statistics and land-use records in addition to a two-date land cover comparison.
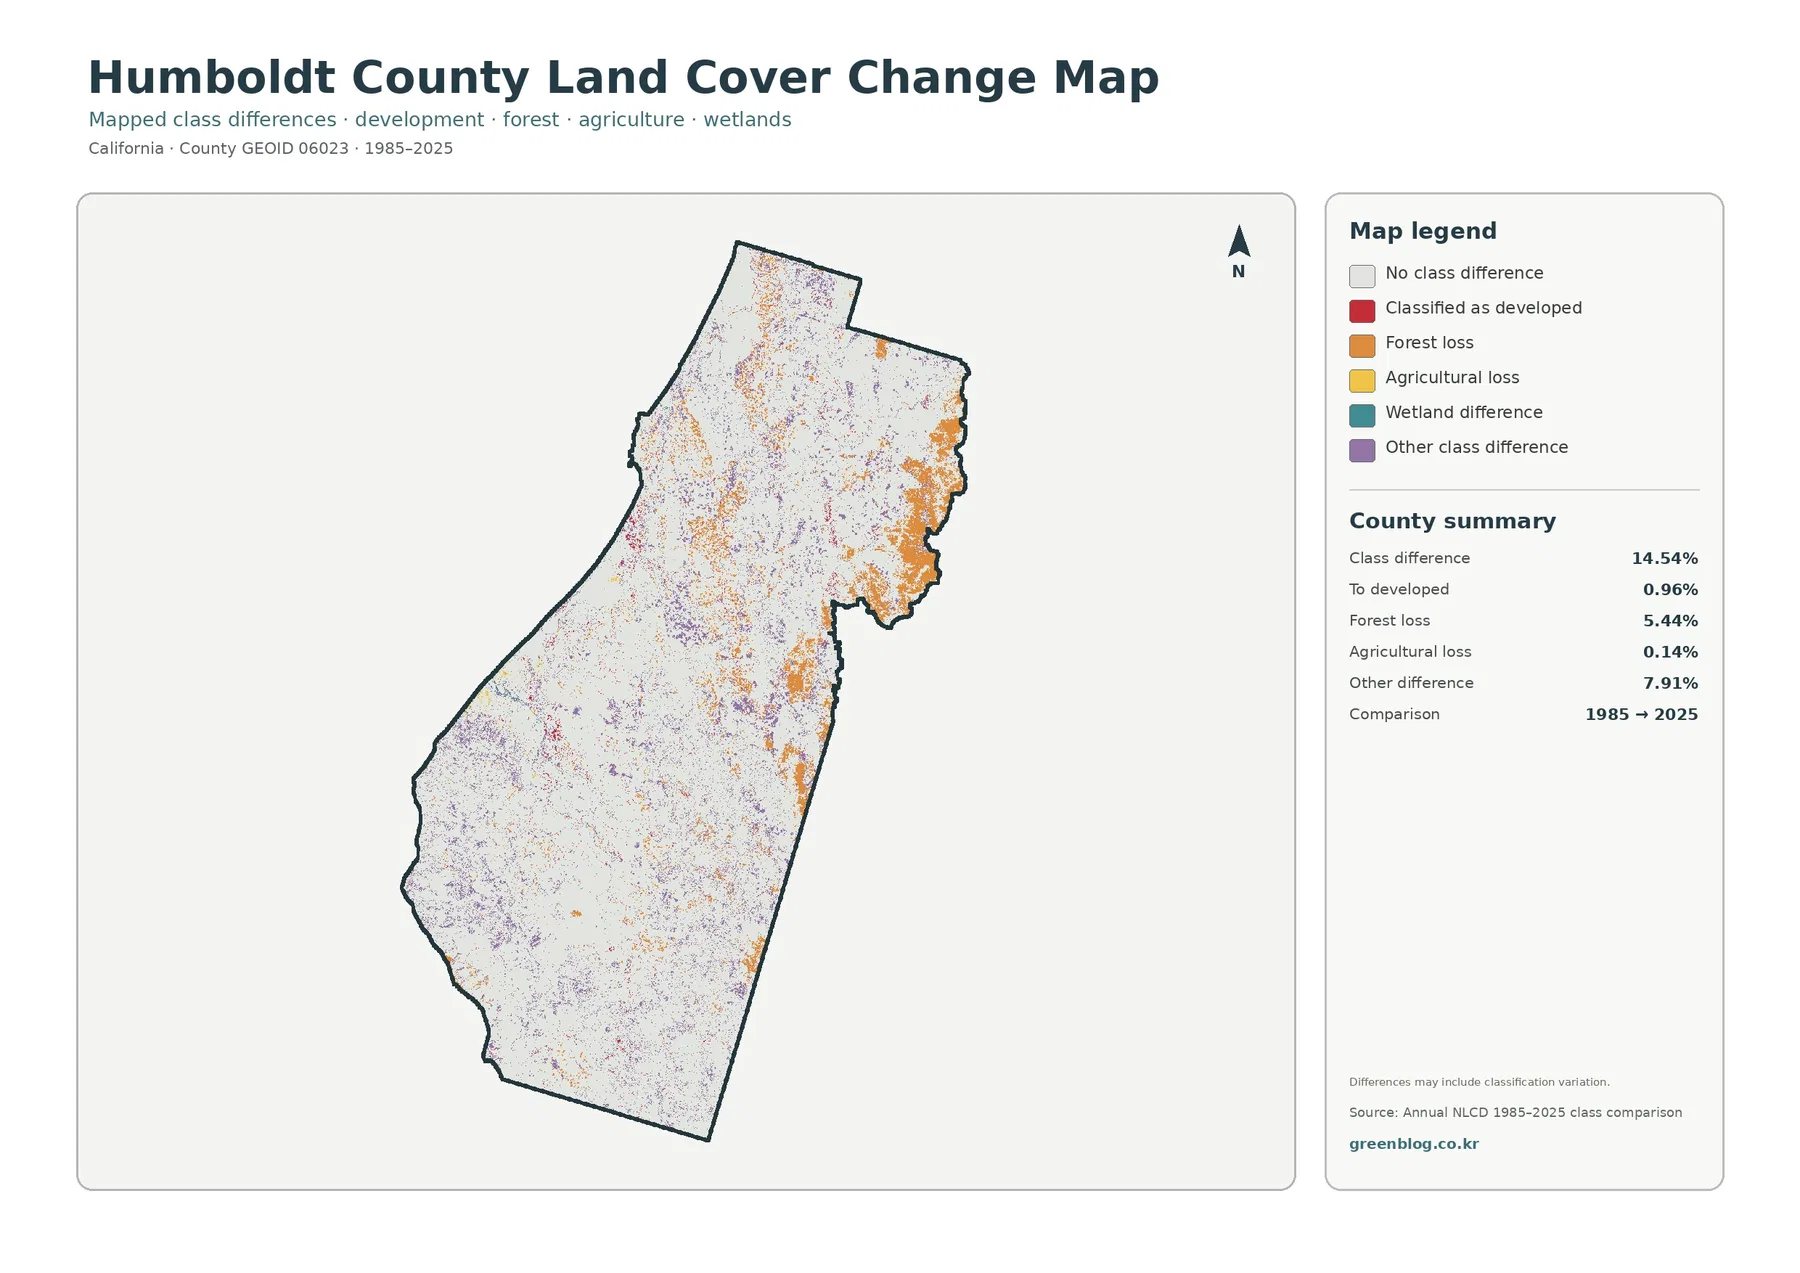
The map itself notes that differences may include classification variation. That warning matters in a forested county where vegetation boundaries can be complex and where a 30-meter cell may contain more than one real surface type. Change mapping is most useful for identifying places that deserve closer review. It is less reliable when a single map color is treated as proof of a specific event or management decision.
What becomes clearer when all four maps are used together
The general land cover map is the best starting point when a reader needs the full set of major classes. The forest and farmland map simplifies the comparison between wooded and more open landscapes. The impervious map focuses on roads, roofs, and pavement rather than broad developed classes. The change map adds a time dimension by comparing 1985 with 2025. Because each map answers a different question, the four-map set is more useful than treating any one image as a complete description of the county.
For environmental education, the forest and farmland map can introduce the 74.01% forest share before the general map adds shrubland, grassland, water, wetlands, and development. A watershed or habitat discussion can use the water and wetland locations as orientation points, but detailed habitat boundaries require dedicated ecological sources. The county’s official conservation and open-space planning material can provide policy context without being confused with the raster land cover classification.
For settlement and infrastructure context, the general and impervious maps work well together. The 3.76% developed land share identifies the broader developed footprint, while the 0.91% mean impervious value shows that hard surfaces occupy a much smaller countywide share. The western concentration stands out in both views. This combination is useful for presentation graphics because it communicates both the extent of development and the intensity of paved or built surfaces.
For long-term comparison, the 2025 maps should remain visible when the change map is discussed. A change color by itself does not tell the reader what the current surface is. Looking back to the present-day map helps distinguish areas that are forest today from those classified as shrubland, grassland, developed land, water, or another class. Captions should keep the dates explicit so that a current-condition image is not accidentally presented as if it were a forty-year change product.
Download the four original JPG maps
The on-page WebP images are convenient for quick viewing, while the downloadable ZIP contains the four original JPG maps: general land cover, forest and farmland, impervious surface and developed land, and the 1985–2025 land cover change comparison. Because the maps use the same county boundary, they can be placed side by side in reports, slide decks, lessons, and research notes without having to collect separate images from different locations.
Keep the title, legend, and date when using the images in a document. The general, forest/farmland, and impervious maps describe 2025 conditions, while the change map compares 1985 and 2025. Cropping away the legend can make similar colors difficult to interpret, especially when a color represents a different concept in another map. Retaining the full map frame is usually the safest option for reuse.
These maps are county-scale reference graphics, not substitutes for a survey, parcel record, zoning map, legal wetland boundary, engineering plan, or site-specific environmental study. For decisions that depend on exact boundaries or recent conditions, use the map to locate the area of interest and then consult the appropriate local or agency dataset.
Important limits of a 30-meter land cover classification
Annual NLCD products generally use raster cells about 30 meters across to classify broad areas consistently. That scale works well for countywide comparison, but it can simplify narrow roads, small buildings, thin wetland strips, stream edges, and complex forest boundaries. A single cell may contain trees, grass, soil, and pavement at the same time even though the mapped product must assign one category or one percentage value.
For that reason, a value such as 74.01% forest should be understood as a county summary within one classification system rather than a surveyed measurement of every individual forest edge. The same caution applies to shrubland, grassland, wetlands, and agriculture. Small or narrow features are especially likely to be generalized at this scale, and mixed pixels can create transitions that look sharper or simpler than conditions on the ground.
The map year also matters. The current-condition products represent 2025, so development, vegetation recovery, disturbance, or water changes after that date are not included. The change map compares only 1985 and 2025. A location could have changed several times between those dates and still appear as a simple two-date difference, or it could return to a similar class and show no difference at all. Annual or intermediate imagery is necessary when the sequence of change matters.
Humboldt County’s General Plan conservation and open-space materials discuss the management and protection of water, forests, soils, rivers, open space, and other natural resources. Those policy documents are valuable context, but they are not the same as the satellite-based classification. One describes planning goals and resource policy; the other describes a generalized surface condition for a particular observation year. Keeping those purposes separate avoids confusing land cover with land use or regulatory status.
Used with these limits in mind, the four maps provide a clear countywide picture. Forest dominates at 74.01%, shrubland and grassland form the next largest natural categories, and developed and impervious surfaces are concentrated in a much smaller western area. The change product adds locations where the 1985 and 2025 classifications differ, especially in the forest-loss and other-difference categories. Together, the maps are most useful for orientation, comparison, education, and visual analysis rather than parcel-level decisions.
Frequently Asked Questions
What is the largest land cover class in Humboldt County in 2025?
Forest is the dominant class at 74.01%. Shrubland follows at 11.14% and grassland at 6.11%, while developed land accounts for 3.76%. The map also shows that most development is concentrated in the western part of the county.
Why is developed land 3.76% while mean impervious surface is only 0.91%?
Developed land is a broader land cover class. Developed areas can still contain lawns, trees, soil, and other permeable surfaces. Impervious surface measures hard surfaces such as roofs and pavement, so the countywide impervious average can be much lower than the developed land share.
Does 5.44% forest loss mean that exactly that share of forest was permanently removed?
No. The change map compares classifications from 1985 and 2025. Real vegetation change may be involved, but imagery, classification methods, mixed pixels, disturbance, and recovery can also affect the result. Additional time-series or local forest data are needed to identify a cause.
Sources and reference links
Land cover and impervious surface classifications can be reviewed through MRLC Annual NLCD Data and the USGS Annual NLCD Land Cover Classification. County boundary and FIPS reference data are available from the U.S. Census Bureau TIGER/Line Shapefiles.
County-specific planning and natural-resource context can be found through Humboldt County Natural Resources Planning and the Humboldt County General Plan Elements. These sources discuss resource management and policy, which should be distinguished from the satellite-based land cover classification itself.
Map File Information
The ZIP includes four original JPG maps for Humboldt County: 2025 general land cover, forest and farmland, impervious surface and developed land, and 1985–2025 land cover change.
- Included Files: Use only the versions confirmed in the article and supplied images
- File Type: Use the confirmed download contents
- Intended Use: Printing, education, presentations, and map-based projects
Related Maps
- Alameda County California Land Cover Map
- Alpine County California Land Cover Map
- Amador County California Land Cover Map
Green Map creates custom-edited map images using open geographic data sources such as geoBoundaries, Natural Earth, OpenStreetMap, and government open data.
These maps are edited visual materials, not raw data files, and are provided for education, documents, presentations, and graphic reference.