Adams County in western Illinois has a geography that changes quickly from the Mississippi River edge to the rolling interior. Quincy occupies the most prominent position on the western side of the county, where the boundary bends with the river. North and east of Quincy, smaller communities such as Ursa, Mendon, Camp Point, Golden, and Clayton spread across a dense network of creeks and numbered roads. Payson and Plainville sit farther south, while Liberty appears in the southeastern half.
This Adams County Illinois Map page brings together the county outline, town and road locations, a ranked city-distribution view, named waterways, and elevation. You can download high-resolution JPG copies of all supplied maps in one ZIP file, using the same map set shown in the article for printing, lessons, presentations, or closer study. The maps are most useful for county-scale orientation rather than parcel, flood, navigation, or engineering decisions.
The detailed county map also marks recognizable Quincy reference points including the Adams County Courthouse, Adams County Ambulance, and John Wood Community College. Farther from Quincy, the visual emphasis shifts from built-up areas to thin roads, streams, and small communities. That change is especially clear when the overview is compared with the water and elevation maps.
Table of Contents
Quincy anchors the Mississippi River side of Adams County
The county overview makes the western boundary immediately recognizable because it follows the bends of the Mississippi River rather than a simple straight line. Quincy sits beside that boundary and is drawn as the largest urban area on the map. Just outside the county to the west is the river corridor, while the eastern and southern edges of Adams County are much more regular in shape.
From Quincy, a reader can work outward through the county. Ursa lies to the north and Mendon farther northeast. Coatsburg and Camp Point occupy the north-central to eastern portion, followed by Golden and Clayton closer to the eastern boundary. Payson and Plainville appear in the south, with Liberty to the southeast. LaPrairie and Columbus are also labeled, giving the overview more local detail than the simplified city map.
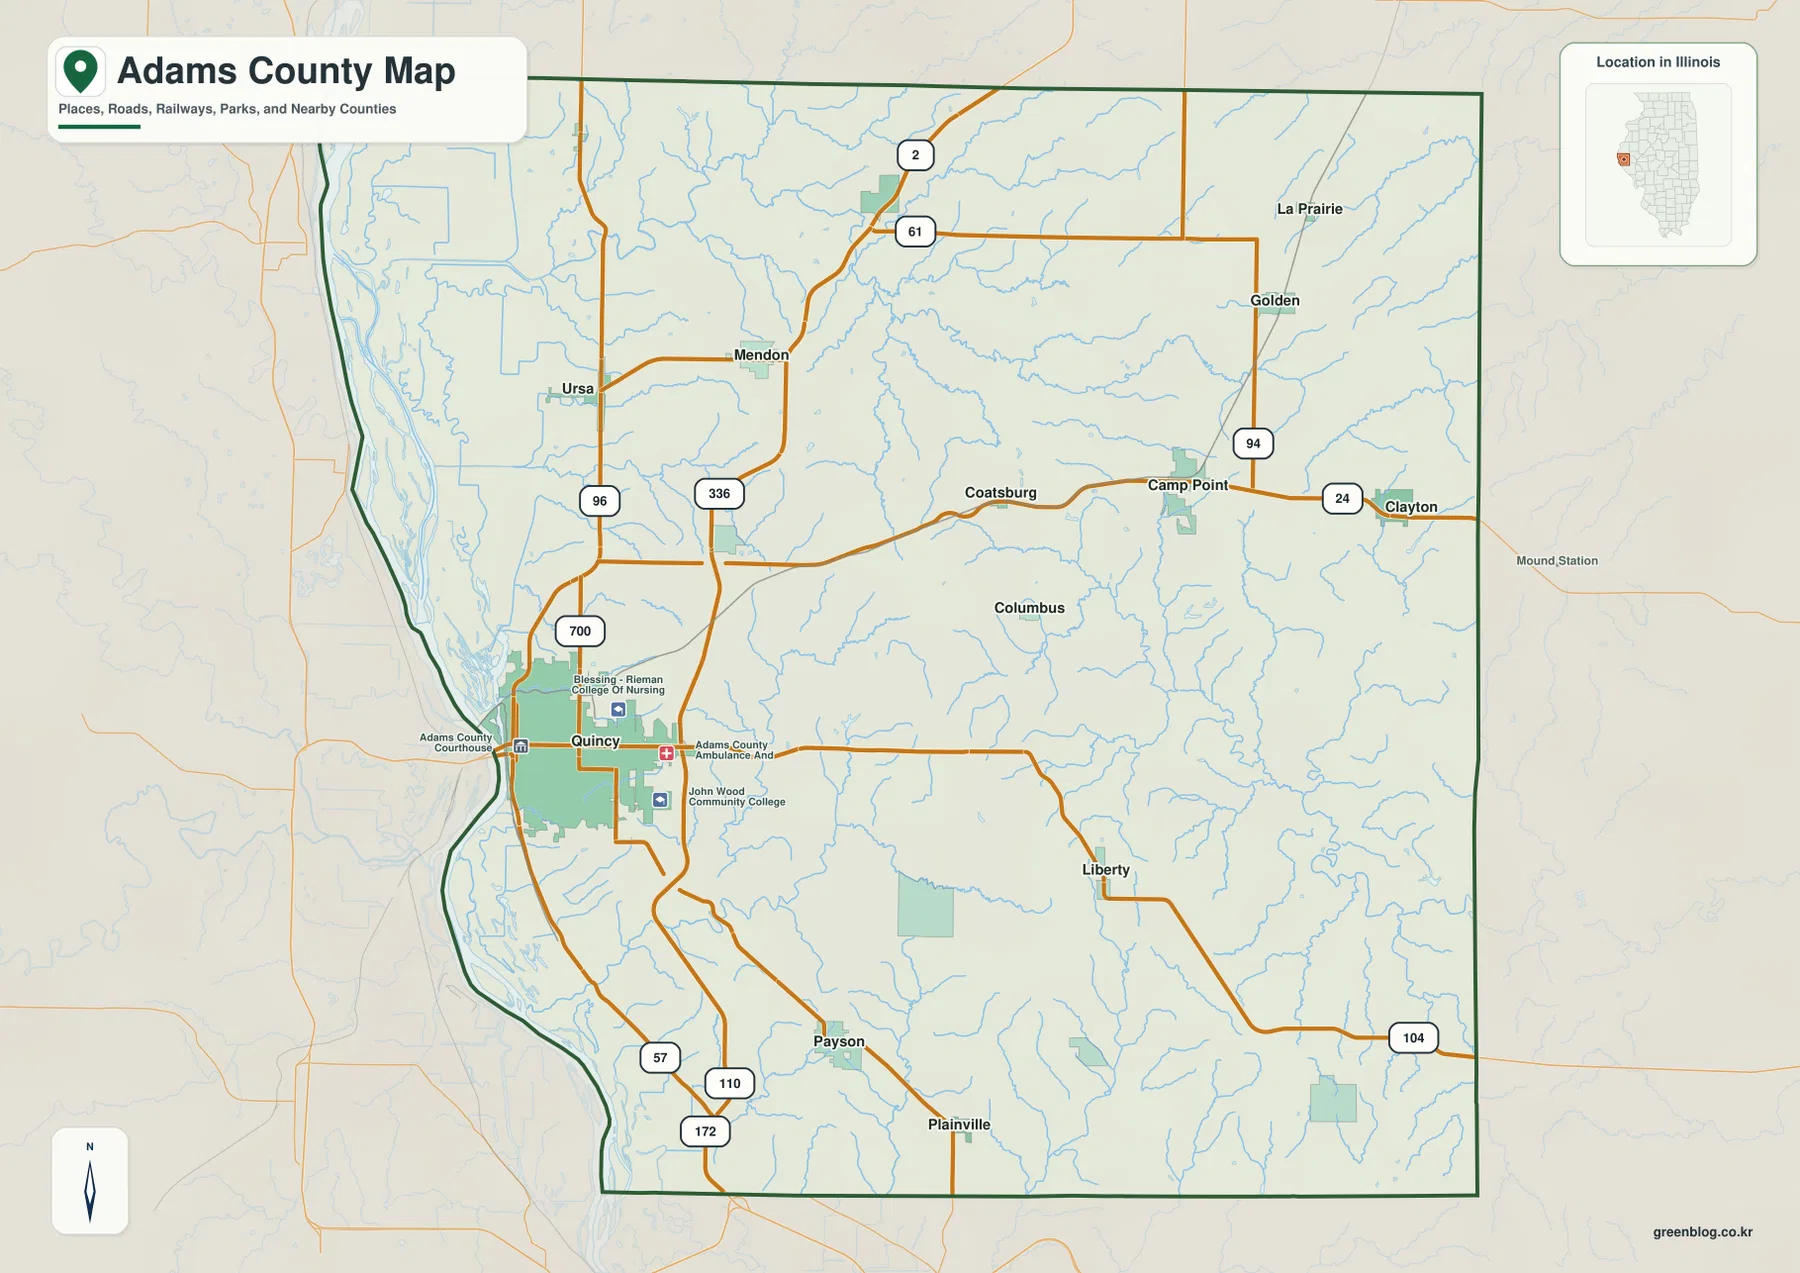
A web of numbered routes links these places. The map shows route numbers including 24, 61, 94, 96, 104, 110, 172, and 336, with the heaviest concentration of roads around Quincy and several crossings or junctions near Camp Point. The purpose of the overview is to show geographic relationships. It does not provide live closures, construction notices, lane information, or exact parcel boundaries.
A simple way to orient the county
Start at Quincy on the west, then look north toward Mendon, northeast toward Camp Point, east toward Clayton, and south toward Payson. That sequence makes the county easier to remember than trying to learn every road at once. The curving Mississippi River boundary remains a useful visual reference as you move between the different maps on this page.
For land ownership, legal boundaries, or current driving conditions, a county-scale overview is not precise enough. Those tasks require current assessor, transportation, or land-management information. The map works best as a broad reference for where towns, highways, and natural features sit in relation to one another.
Six ranked places show how dominant Quincy is
The city-distribution map strips away much of the road detail and highlights six locations. Quincy is ranked first, followed by Camp Point, Mendon, Payson, Ursa, and Golden. The printed CITY INDEX lists values of 39,109 for Quincy, 1,230 for Camp Point, 1,167 for Mendon, 1,167 for Payson, 726 for Ursa, and 693 for Golden.
Because the supplied image does not state a census year or statistical reference beside those values, this article treats them as the index numbers printed on the map rather than claiming that they are current population counts. What the map clearly supports is the large difference between Quincy and the five smaller places, as well as their geographic spread across the county.
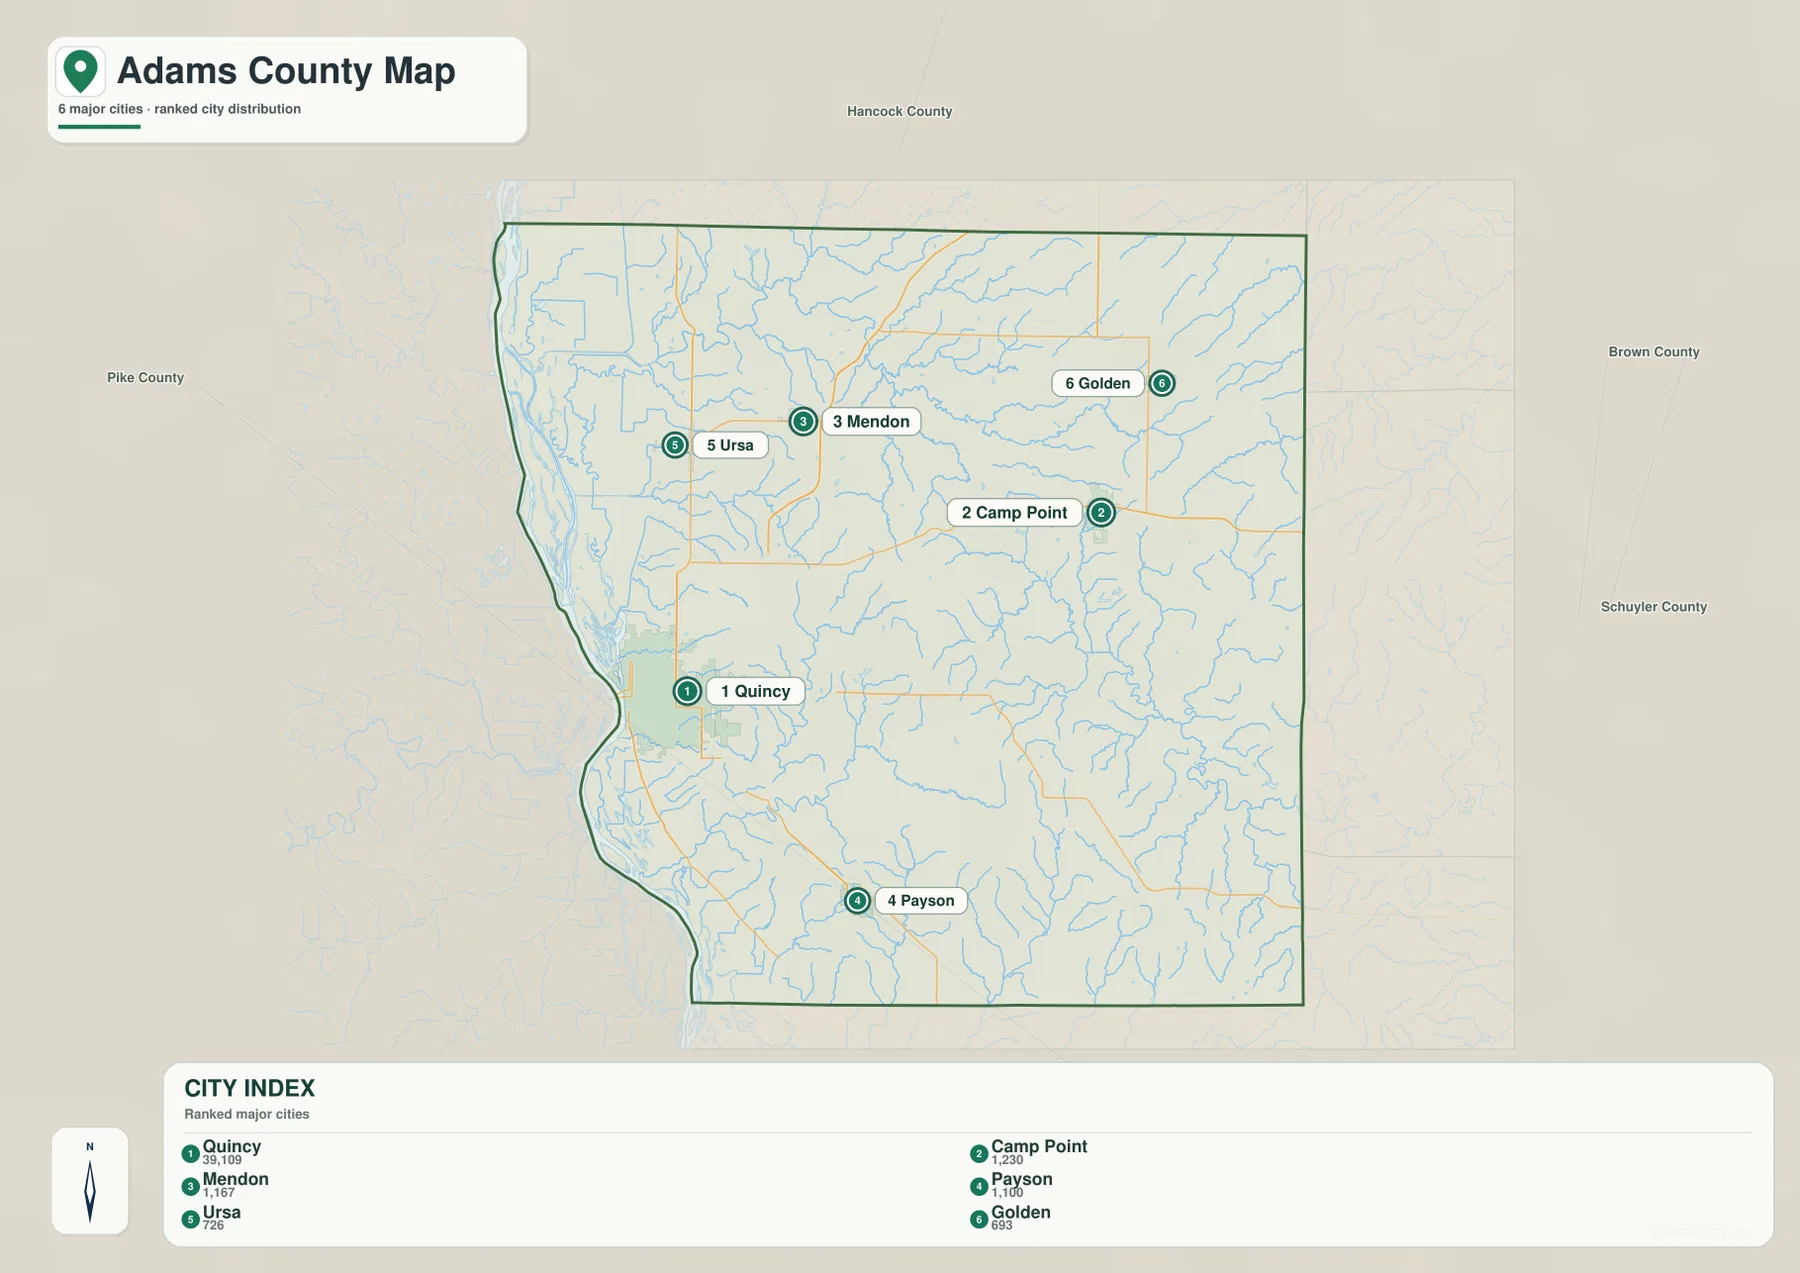
The positions are as useful as the rankings. Quincy is on the western river edge, Ursa and Mendon are in the northern half, Camp Point and Golden are farther east, and Payson is distinctly south of the other ranked places. Neighboring county names around the frame—Hancock, Brown, Schuyler, and Pike—provide additional orientation without turning the graphic into a detailed road map.
The CITY INDEX is not presented as a current census table
The printed numbers are useful for comparing the map’s ranked places, but the image does not identify the date behind them. If a task requires current official population figures, consult the U.S. Census Bureau directly. Here, the city map is used primarily to explain the relative prominence and location of the six labeled communities.
Creeks feed the Mississippi River lowlands
The terrain-and-water map puts the western side of Adams County in a different light. Along the Mississippi River corridor, the map labels Indian Grave Lake in the northwestern area, Goose Lake farther south, then Big Lake and Sand Lake near the southwestern river plain. Bay De Charles and Heath Bay are labeled still farther south. These water bodies make the broad river-margin lowlands visually distinct from the interior.
Named creeks dominate the inland half. Bear Creek crosses the north, joined by South Fork Bear Creek and nearby Bigneck Creek. Cedar Creek is labeled in the northeast. Mill Creek and Burton Creek run through the central and southern interior, and McKee Creek appears in the southeast. Many smaller tributaries branch between these named streams, creating a fine network across the county.
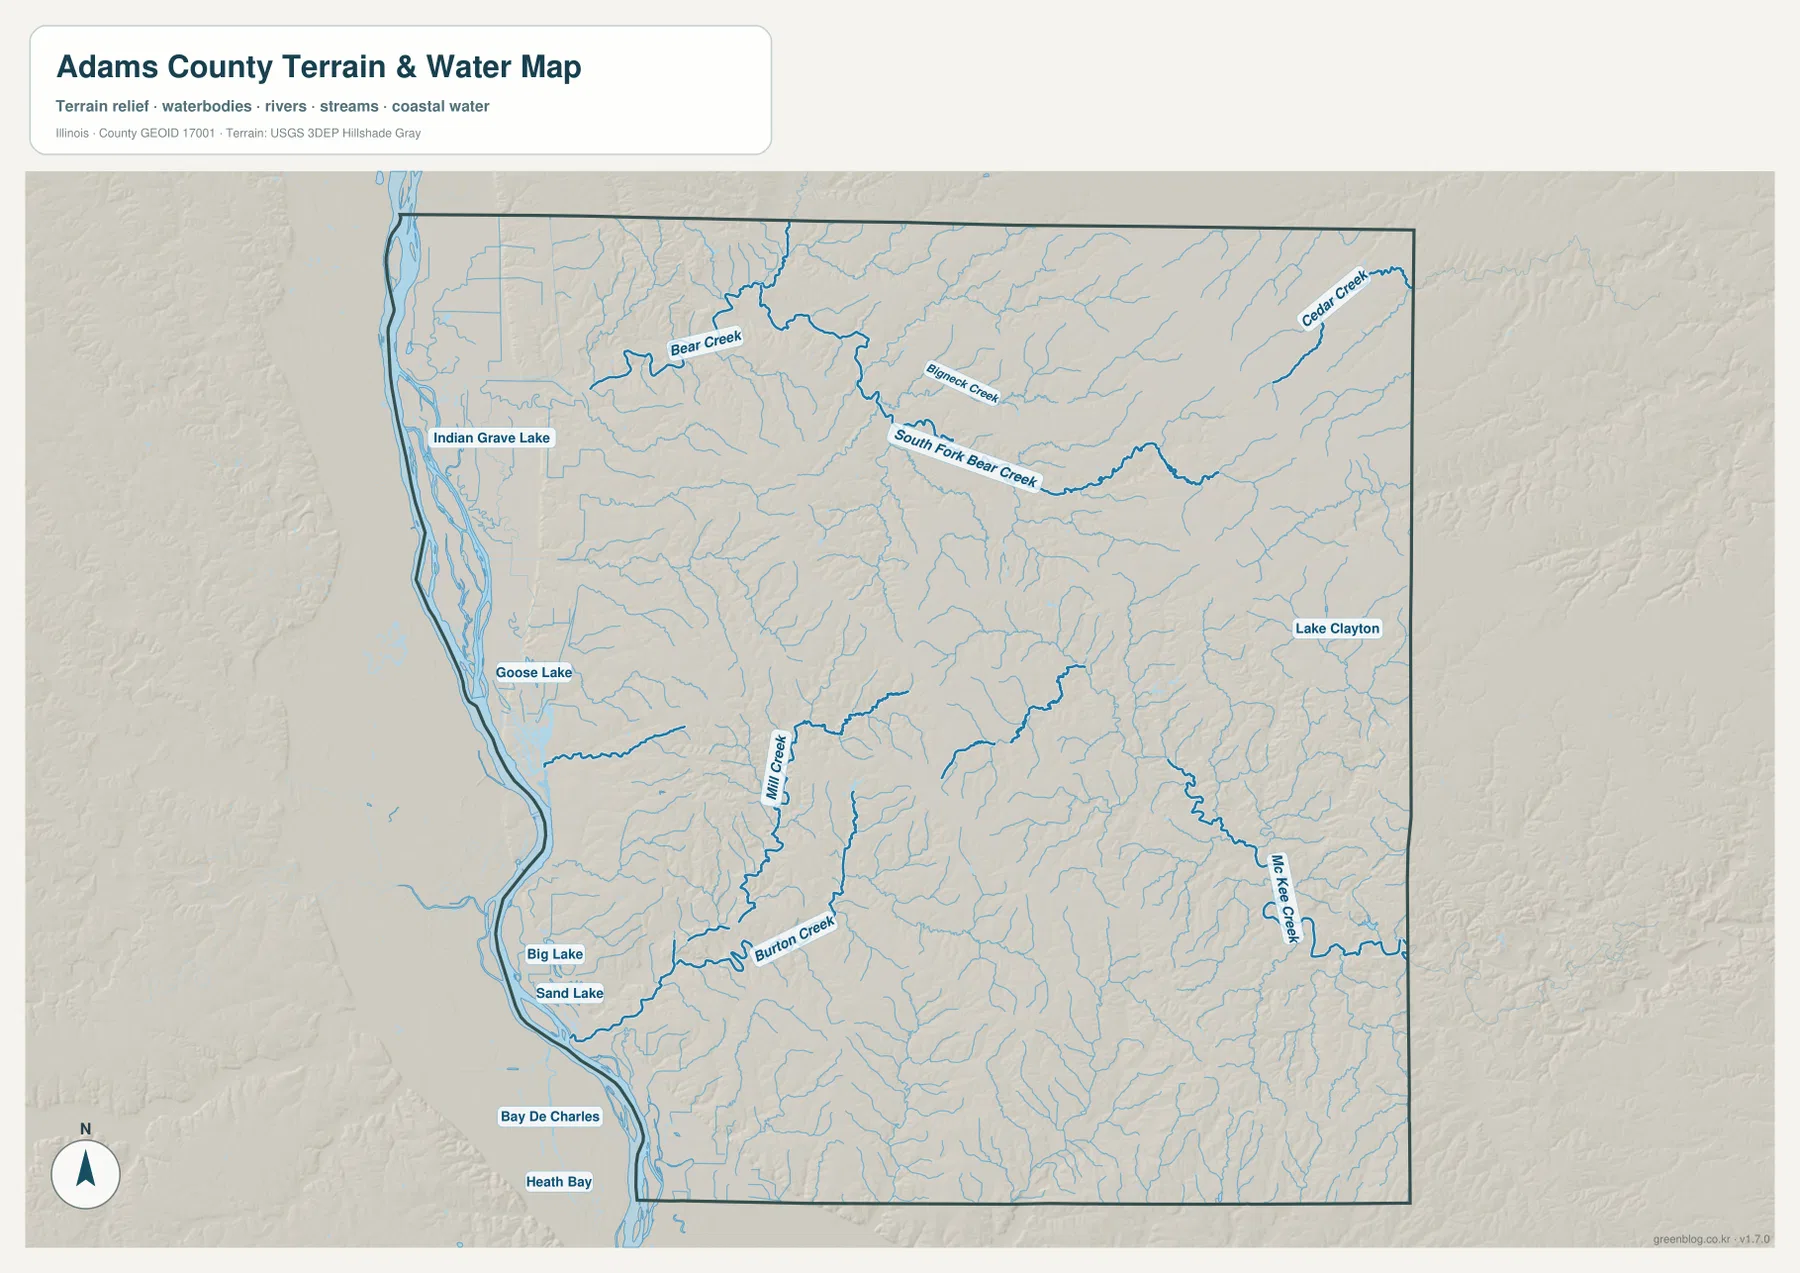
The shaded background explains why the drainage network changes from west to east. The river margin is broad and comparatively flat, while the interior is cut by many small valleys. Streams weave through those lower corridors between rolling ridges. The map therefore connects two features that look separate on the county overview: the major Mississippi River boundary and the numerous small creeks that drain the inland terrain.
This is a water-reference map, not a flood or navigation chart
The map shows the location of water features and terrain at county scale. It does not provide flood zones, live river stages, water depth, levee condition, navigable channels, boat access, or legal access to private land. Use current USGS and responsible agency information for any safety, boating, flood, or regulatory decision.
Elevation climbs away from the western river edge
The elevation map makes the county’s west-to-east contrast especially clear. A broad dark-green strip follows the Mississippi River side, representing the lower ground. Moving east, green gives way to yellow and tan, while brown ridges become more common through the central, southeastern, and eastern interior. The surface is not a mountain landscape, but the repeated hills and valleys create much more relief than the flat river margin.
The map reports an actual countywide elevation range of about 138 to 262 meters, with a mean of about 199 meters. Its color legend uses several bands from roughly 143 to 237 meters, while the separate “Actual” line records the wider minimum and maximum found in the underlying county data. Those figures summarize the mapped county as a whole; they are not exact elevations for Quincy, Camp Point, a road junction, or a specific property.
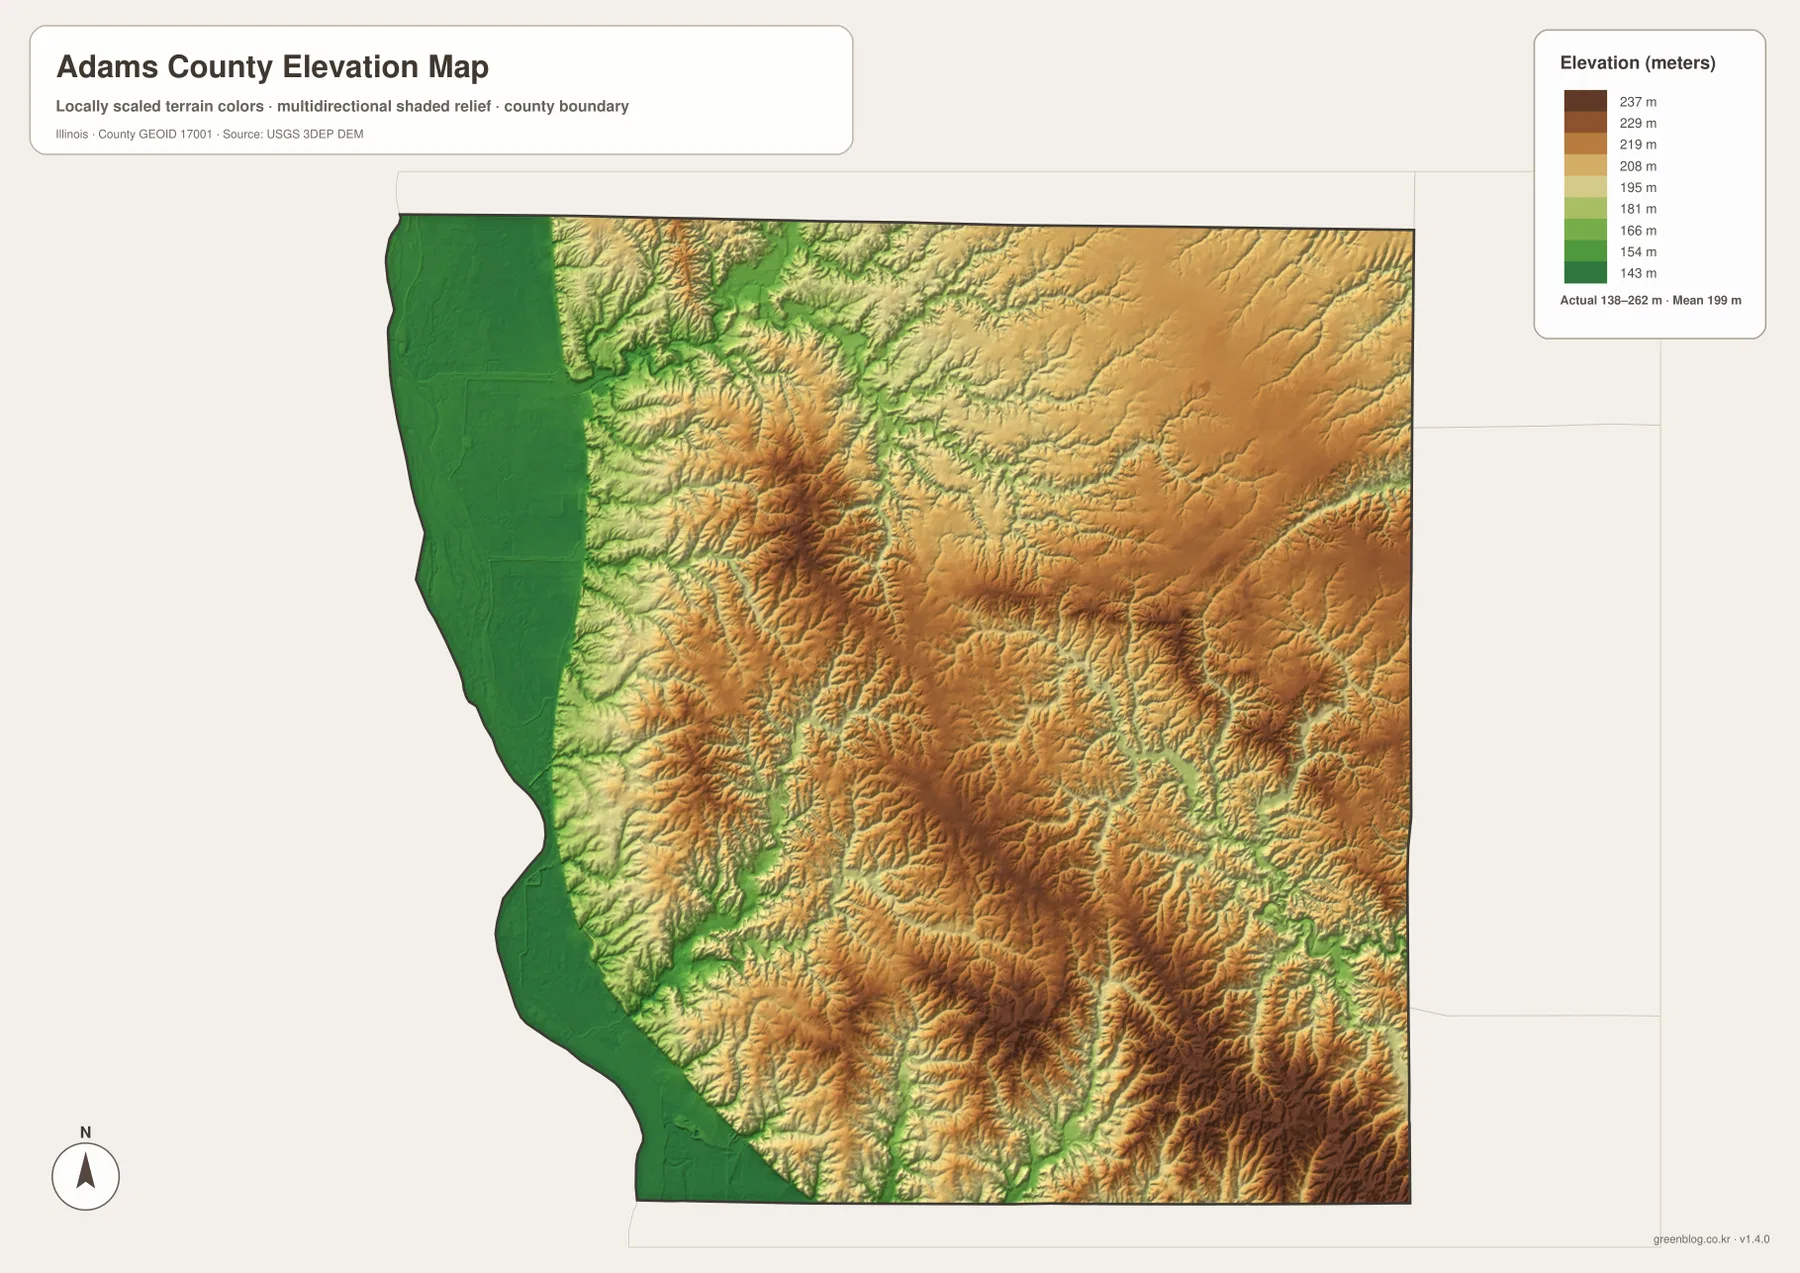
Reading the elevation and water maps together is particularly useful. The lakes and broad river-margin water features sit in the low western zone, while inland creeks occupy small valleys that cut through higher rolling ground. This relationship can be seen at a glance, but the elevation surface remains a generalized county-scale visualization rather than a substitute for a surveyed benchmark or engineering-grade terrain model.
138 to 262 meters is the countywide data range
Do not assign the low or high endpoint directly to a named town just because it appears near a green or brown area. Exact elevation for an address, structure, bridge, or construction site should come from location-specific source data or a professional survey. The map is designed for comparing broad areas within Adams County.
Which Adams County map fits the task?
Choose the county overview when you need towns, major numbered roads, county boundaries, and streams in one image. Use the city-distribution map when the main question is how Quincy, Camp Point, Mendon, Payson, Ursa, and Golden are arranged and ranked on the supplied index. The water-and-terrain map is better for the Mississippi River margin, named creeks, lakes, and bays. The elevation map is the clearest option for comparing the low western floodplain with the rolling interior.
For a quick study sequence, locate Quincy and the river on the overview first. Then compare the other ranked communities on the city map. Move to the water map to trace Bear Creek, Mill Creek, Burton Creek, and the lakes beside the Mississippi. Finish with elevation to see why the western edge appears broad and low while the interior is broken into many ridges and shallow valleys.
All four maps are explanatory county references. The overview is not a parcel or live traffic map, the city index is not presented as a dated census table, the water map is not a flood or navigation product, and the elevation map is not survey-grade. Within those limits, the set is useful for printing, teaching, presentations, regional orientation, and general geographic reference.
Frequently Asked Questions
Are the CITY INDEX values current population figures?
The supplied map prints values such as 39,109 for Quincy and smaller figures for five other places, but it does not show a census year or statistical date beside that index. This article therefore treats them only as values printed on the supplied city map. Use current U.S. Census Bureau data when an up-to-date official population figure is required.
Does 138 to 262 meters give Quincy’s elevation?
No. The elevation map labels 138–262 m as the actual range across the county dataset and gives a mean of about 199 m. It does not assign those endpoints to Quincy or any other specific town. Exact point elevations require location-specific source or survey data.
Can the water map be used to evaluate Mississippi River flood risk?
No. The map is a geographic reference for rivers, creeks, lakes, bays, and terrain. It does not contain flood-hazard zones, live river stages, levee information, water depth, or navigation conditions. Consult current agency products for flood or safety decisions.
Sources and Reference Material
The article is based on the supplied Adams County maps and the place names, water features, roads, and elevation values visible in those files. The official national sources below provide further reference for boundary, hydrography, and elevation data.
- U.S. Census Bureau TIGER/Line Shapefiles – county boundaries and geographic reference data
- USGS National Hydrography – rivers, streams, lakes, and related hydrography data
- USGS 3D Elevation Program – elevation and terrain data
Map File Information
The high-resolution JPG originals for the Adams County overview, city-distribution map, terrain-and-water map, and elevation map are bundled in one ZIP file. Each image is a 3,638 × 2,572-pixel landscape file suitable for larger displays, printed reference sheets, lessons, and presentation graphics.
- Included Files: 4 high-resolution JPG maps
- Printable Size: 3,638 × 2,572 pixels each
Related Maps
Green Map creates custom-edited map images using open geographic data sources such as geoBoundaries, Natural Earth, OpenStreetMap, and government open data.
These maps are edited visual materials, not raw data files, and are provided for education, documents, presentations, and graphic reference.