Floyd County is a northwestern Georgia county where the shape of the land is almost as important as the county boundary itself. Rome sits near a major river junction, Cave Spring is far to the southwest, and long narrow ridges run through several parts of the county. The four maps on this page separate those features so they remain easy to read: one map covers roads and places, another focuses on the two major cities, a third names rivers, creeks, lakes, and reservoirs, and the elevation view shows how low valleys fit between higher ridges. After reviewing the maps, you can download four high-resolution A3 JPG files in one ZIP for printing, classroom use, presentations, or local research.
Rome is the main anchor on both the county and city maps. It appears near the center-east of Floyd County, where several numbered roads converge and where landmarks such as Berry College and the Floyd County Courthouse are labeled nearby. Cave Spring occupies a very different position near the southwestern edge. The water map adds the county’s defining river relationship: the Oostanaula River comes down from the north, the Etowah River approaches from the east, and the Coosa River continues away from their junction near Rome. The elevation map then shows that this meeting place lies within lower terrain framed by long ridges.
Table of Contents
Roads, Rome, and the Irregular Floyd County Boundary
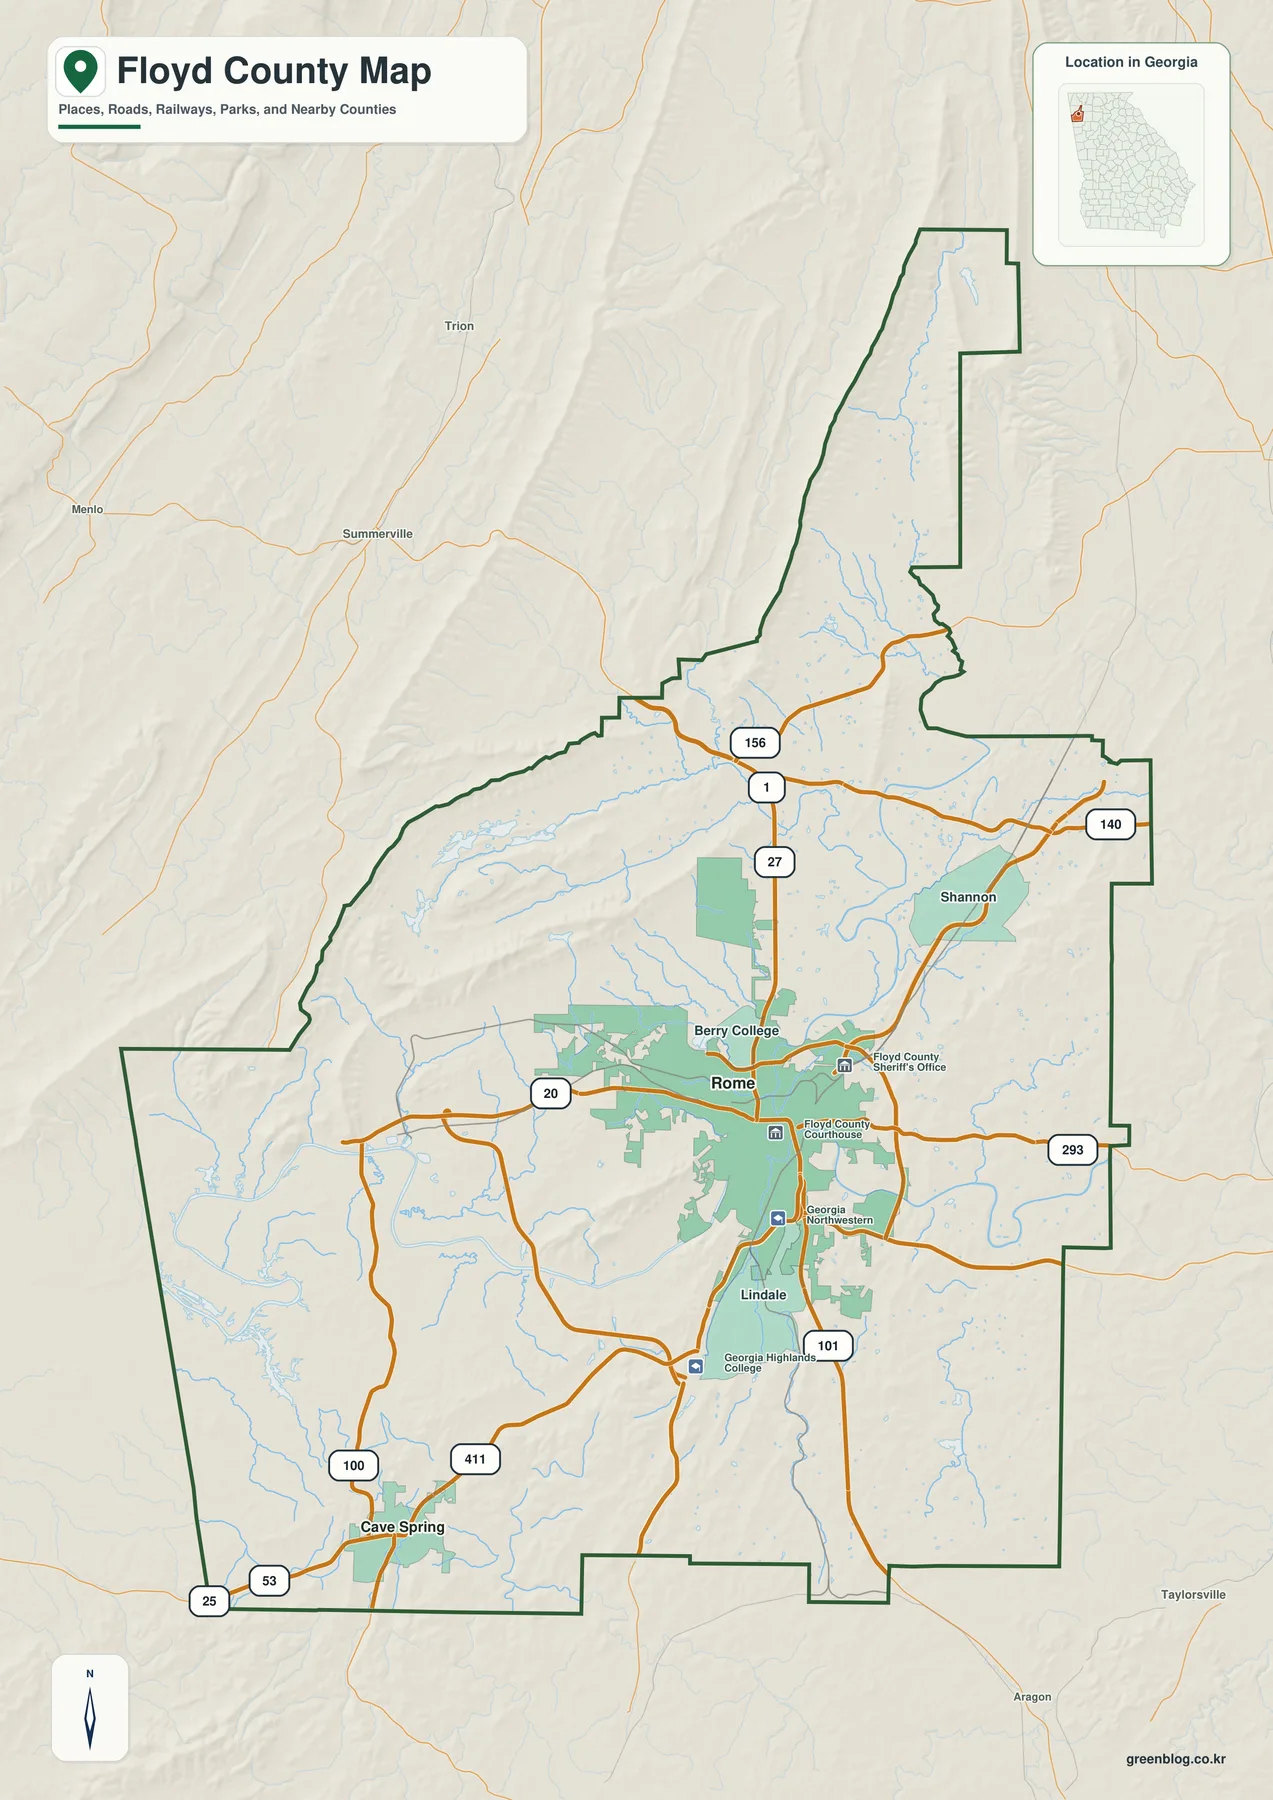
The county map gives Rome the strongest visual emphasis because roads, urban areas, and public landmarks cluster around it. Route numbers 20 and 27 cross the Rome area, while 101 continues south and 1 and 156 provide northern references. Labels 140 and 293 appear toward the east, and the southwest around Cave Spring includes 100, 411, 53, and 25. The map does not attempt to replace current street navigation; instead, the numbered roads make it possible to see how the main communities connect across a county that has a wide southern half and a long, narrow northern extension.
Several place labels help orient the urban center. Berry College appears northwest of central Rome, and the Floyd County Courthouse and Floyd County Sheriff’s Office are marked within the developed area. Lindale lies south of Rome, Shannon appears to the north, and Georgia Highlands College is labeled farther south. These points make the map more useful than a bare boundary outline because they show where the built-up Rome area sits in relation to the surrounding countryside and the roads leaving the city.
Floyd County’s outline is unusually important to the way the map reads. A narrow section extends far north, while the central and southwestern parts spread much more broadly. The eastern edge contains several steps and projections rather than one straight line. Outside the county boundary, Summerville, Trion, Menlo, Taylorsville, and Aragon provide regional reference points. Those surrounding labels are useful when a reader wants to place Floyd County within northwestern Georgia without turning the page into a larger state map.
Rome and Cave Spring on a Two-City Distribution Map
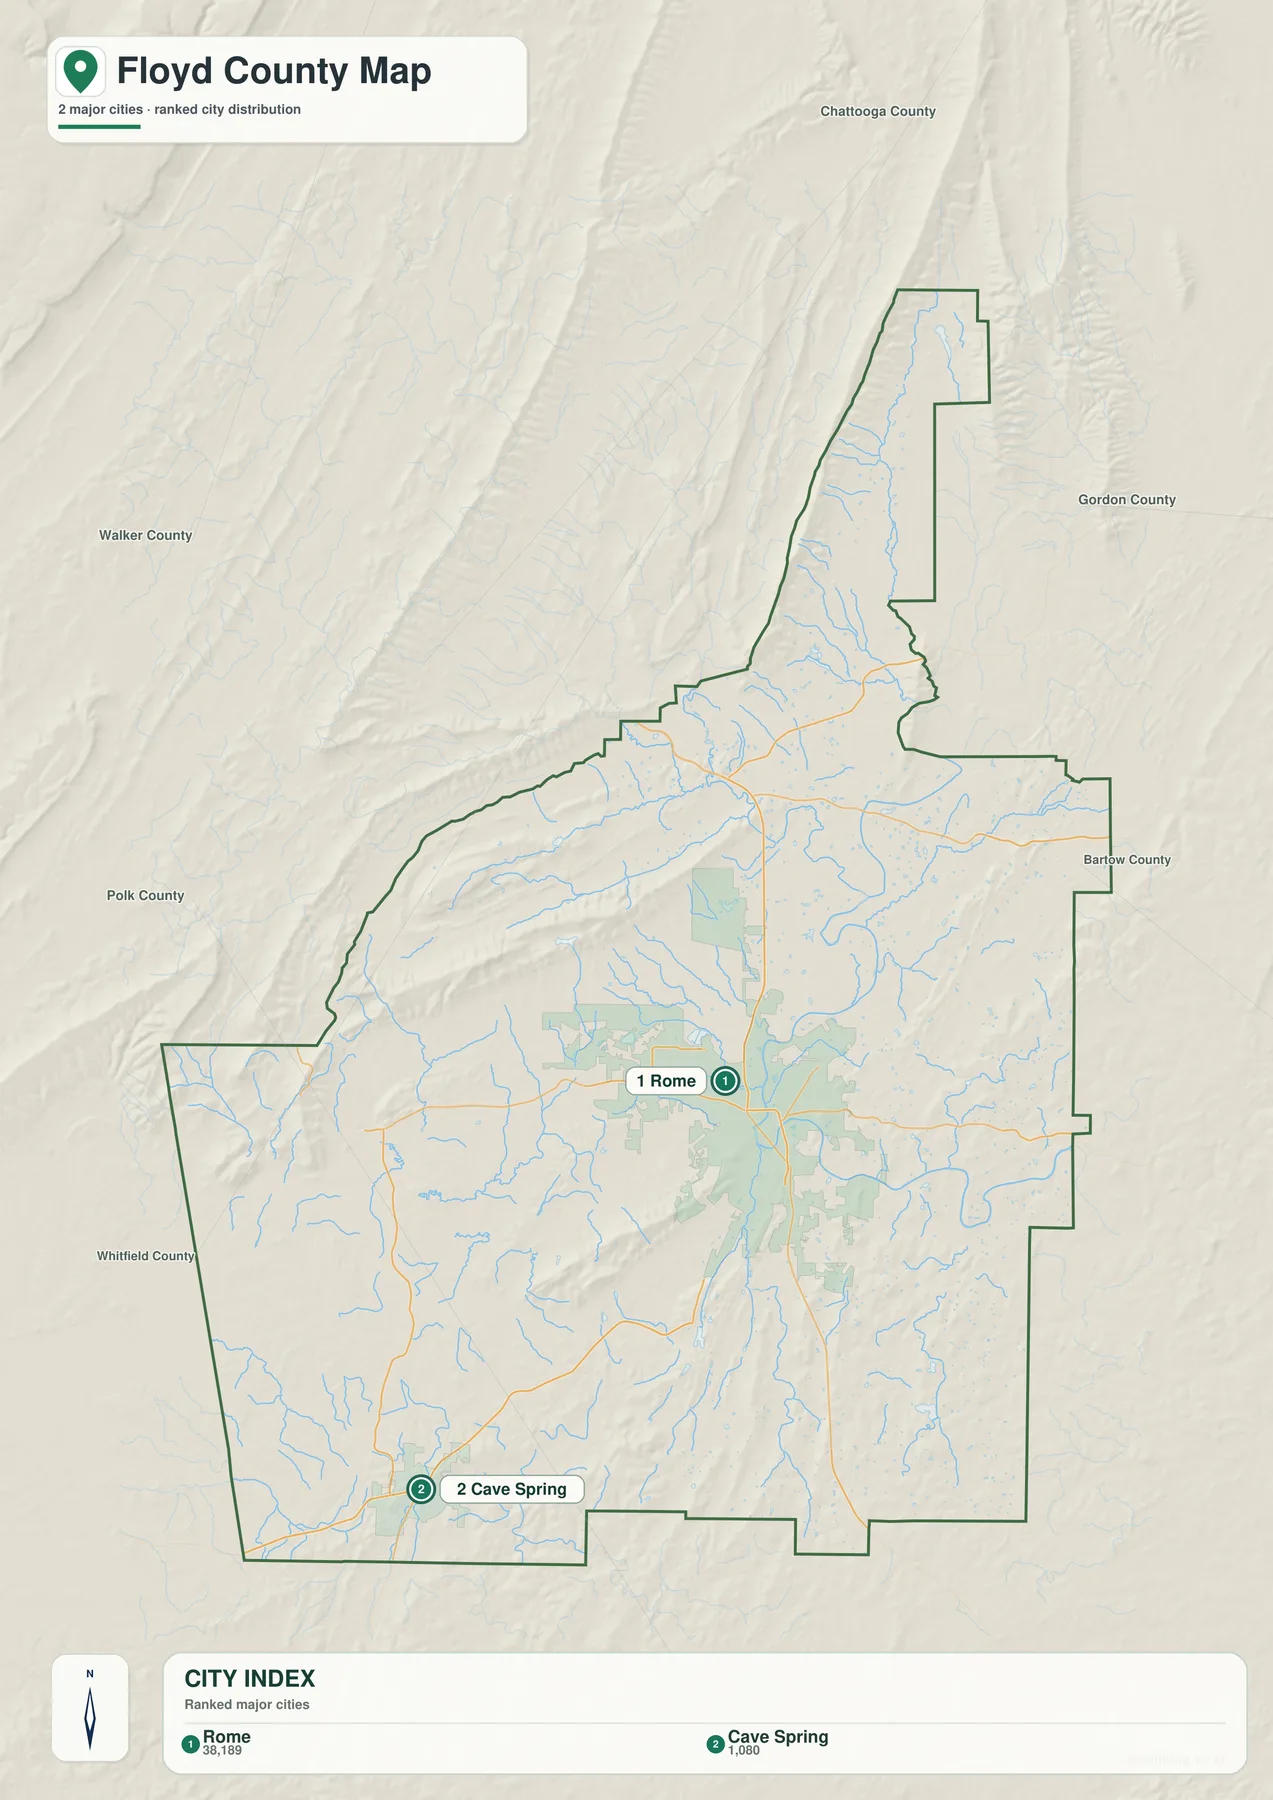
The city map removes most of the detailed road and landmark information and highlights only two major cities. Its city index shows Rome at 38,189 and Cave Spring at 1,080. Those numbers are reproduced from the supplied map as ranking values and should not be treated as a newly calculated population estimate for this article. Readers who need current official demographic figures can use the Census QuickFacts link in the sources section.
The geographic contrast matters more than the numbers. Rome occupies the central-eastern portion of the county and spreads across a visibly larger developed area. Cave Spring appears near the southwestern edge, separated from Rome by a broad stretch of rural land, streams, roads, and ridges. A reader who sees only a list of city names might assume the two communities sit close together, but the map makes their separation obvious. The simplified view is therefore useful when the question is where the two main city labels fall inside the county rather than which road to take between them.
Neighboring counties are also labeled around the city map. Chattooga and Gordon help frame the northern side, Bartow appears on the east, and Polk, Walker, and Whitfield provide references around the western and southwestern portions. These are orientation labels rather than survey lines for legal boundary work. Their value is in showing why Rome feels relatively central to the broader county while Cave Spring sits much closer to the outer edge.
The Oostanaula–Etowah Junction and the Coosa River
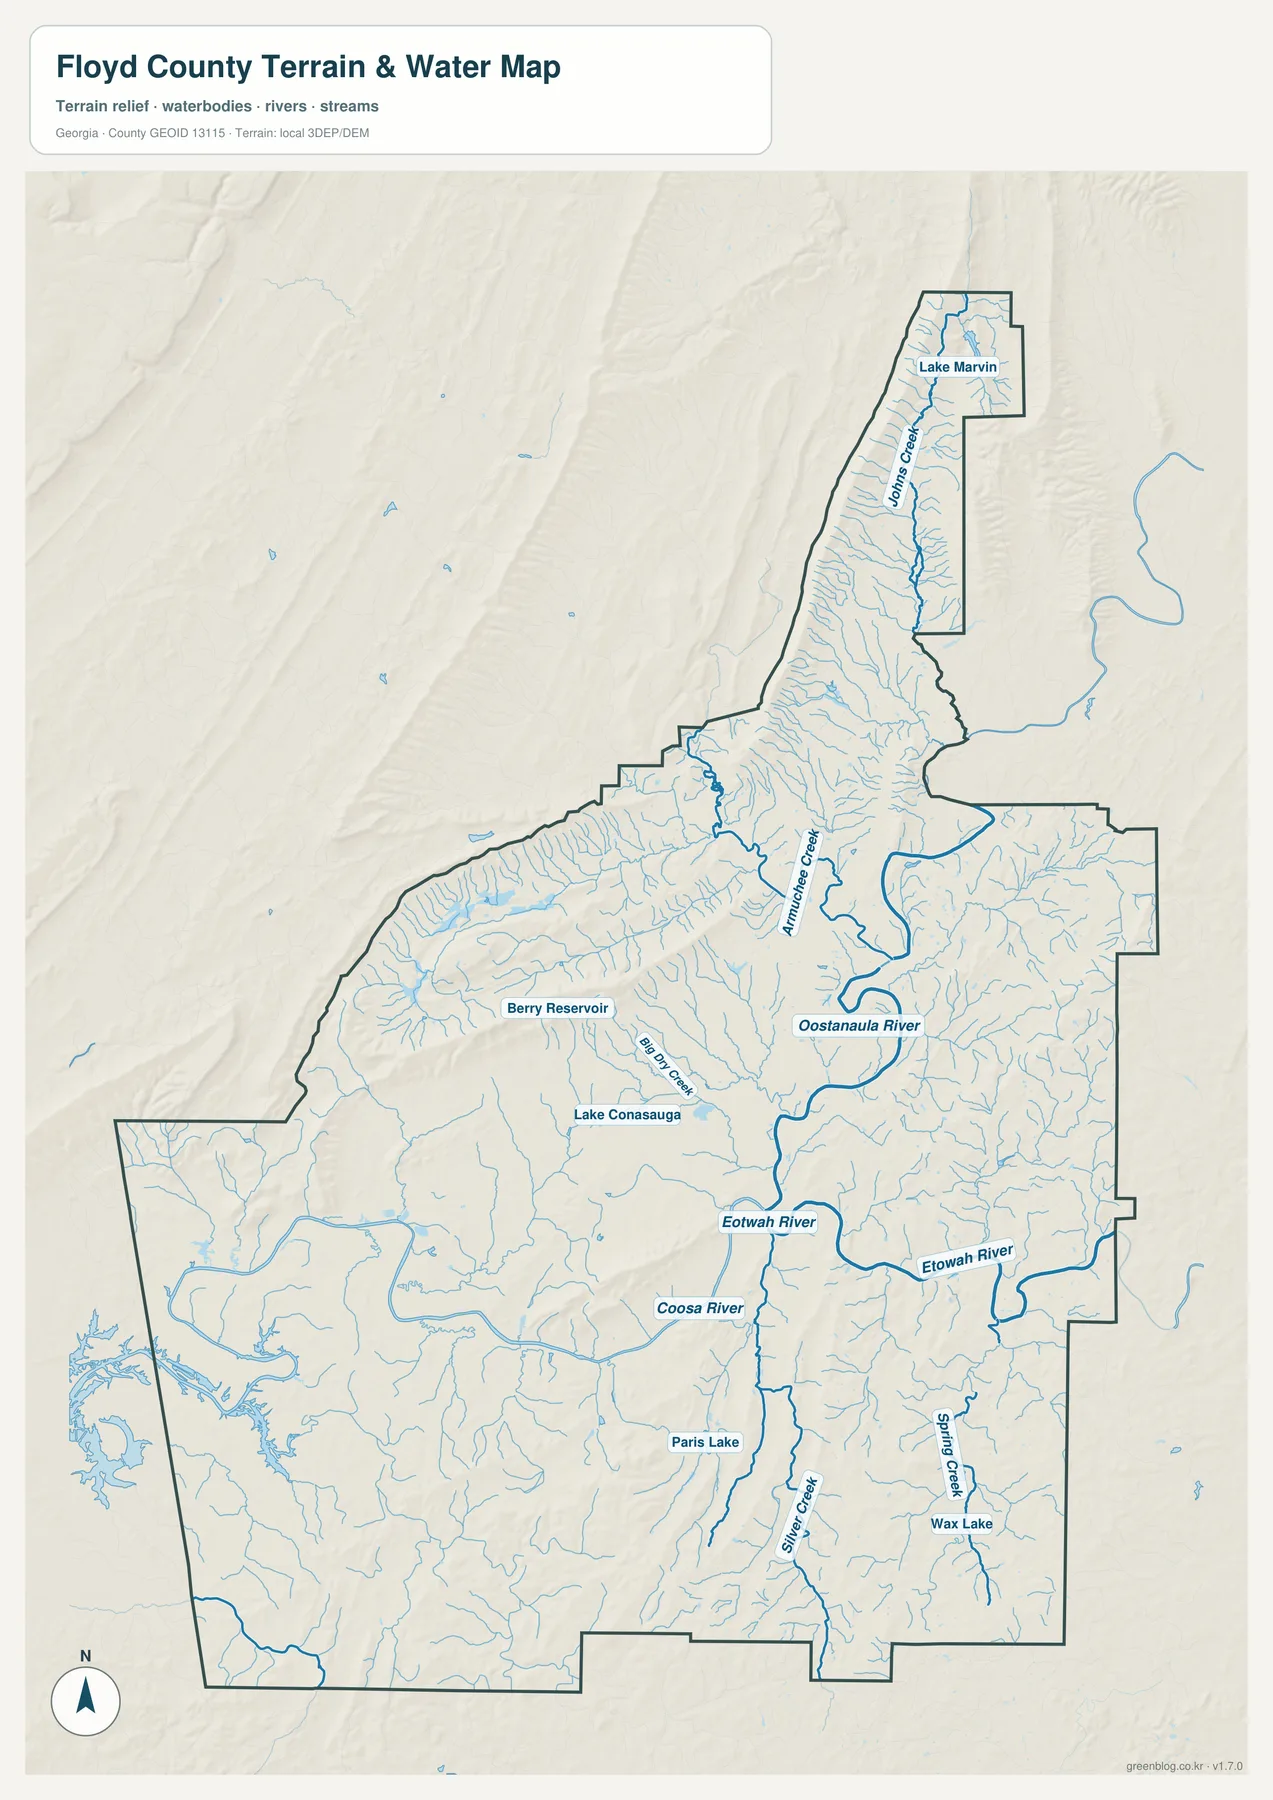
The most important feature on the water map is the meeting of the Oostanaula and Etowah rivers near Rome. The Oostanaula follows a broad corridor from the north, while the Etowah approaches from the east. Below their junction, the waterway is labeled Coosa River as it continues south and then westward across the county. This arrangement gives Rome a very clear physical-geography setting. The city is not simply placed near an arbitrary blue line; it lies close to the point where two major named rivers come together and a third named river continues downstream.
Smaller waterways fill the spaces between the main rivers and the ridges. Johns Creek is labeled in the long northern extension, Armuchee Creek appears farther south, and Big Dry Creek is shown west and northwest of Rome. Silver Creek runs through the southern half, while Spring Creek is labeled in the southeast. Many additional tributaries branch from these named streams. The density of those blue lines is important because it shows how frequently the valleys are occupied by drainage channels, even in parts of the county far from the three large river names.
The map also identifies several standing-water features. Lake Marvin appears in the far north, Berry Reservoir is labeled west of the central river corridor, and Lake Conasauga is shown farther south. Paris Lake appears southwest of Rome, while Wax Lake is marked in the southeast near Spring Creek. These names are useful local reference points on the supplied map; the map does not imply that the water bodies are equal in size or purpose. Taken together with the creeks, they help a reader follow the county’s water geography beyond the main river junction.
This view is intended for county-scale orientation, not for determining flood insurance requirements, property boundaries, navigability, water depth, or a legal shoreline. Those questions require specialized and current official data. For a geography lesson, a presentation about Rome, or a local-history reference, however, the map clearly shows where the principal rivers and named tributaries lie and how the smaller water network connects with the broader county.
Elevation from About 172 to 552 Meters
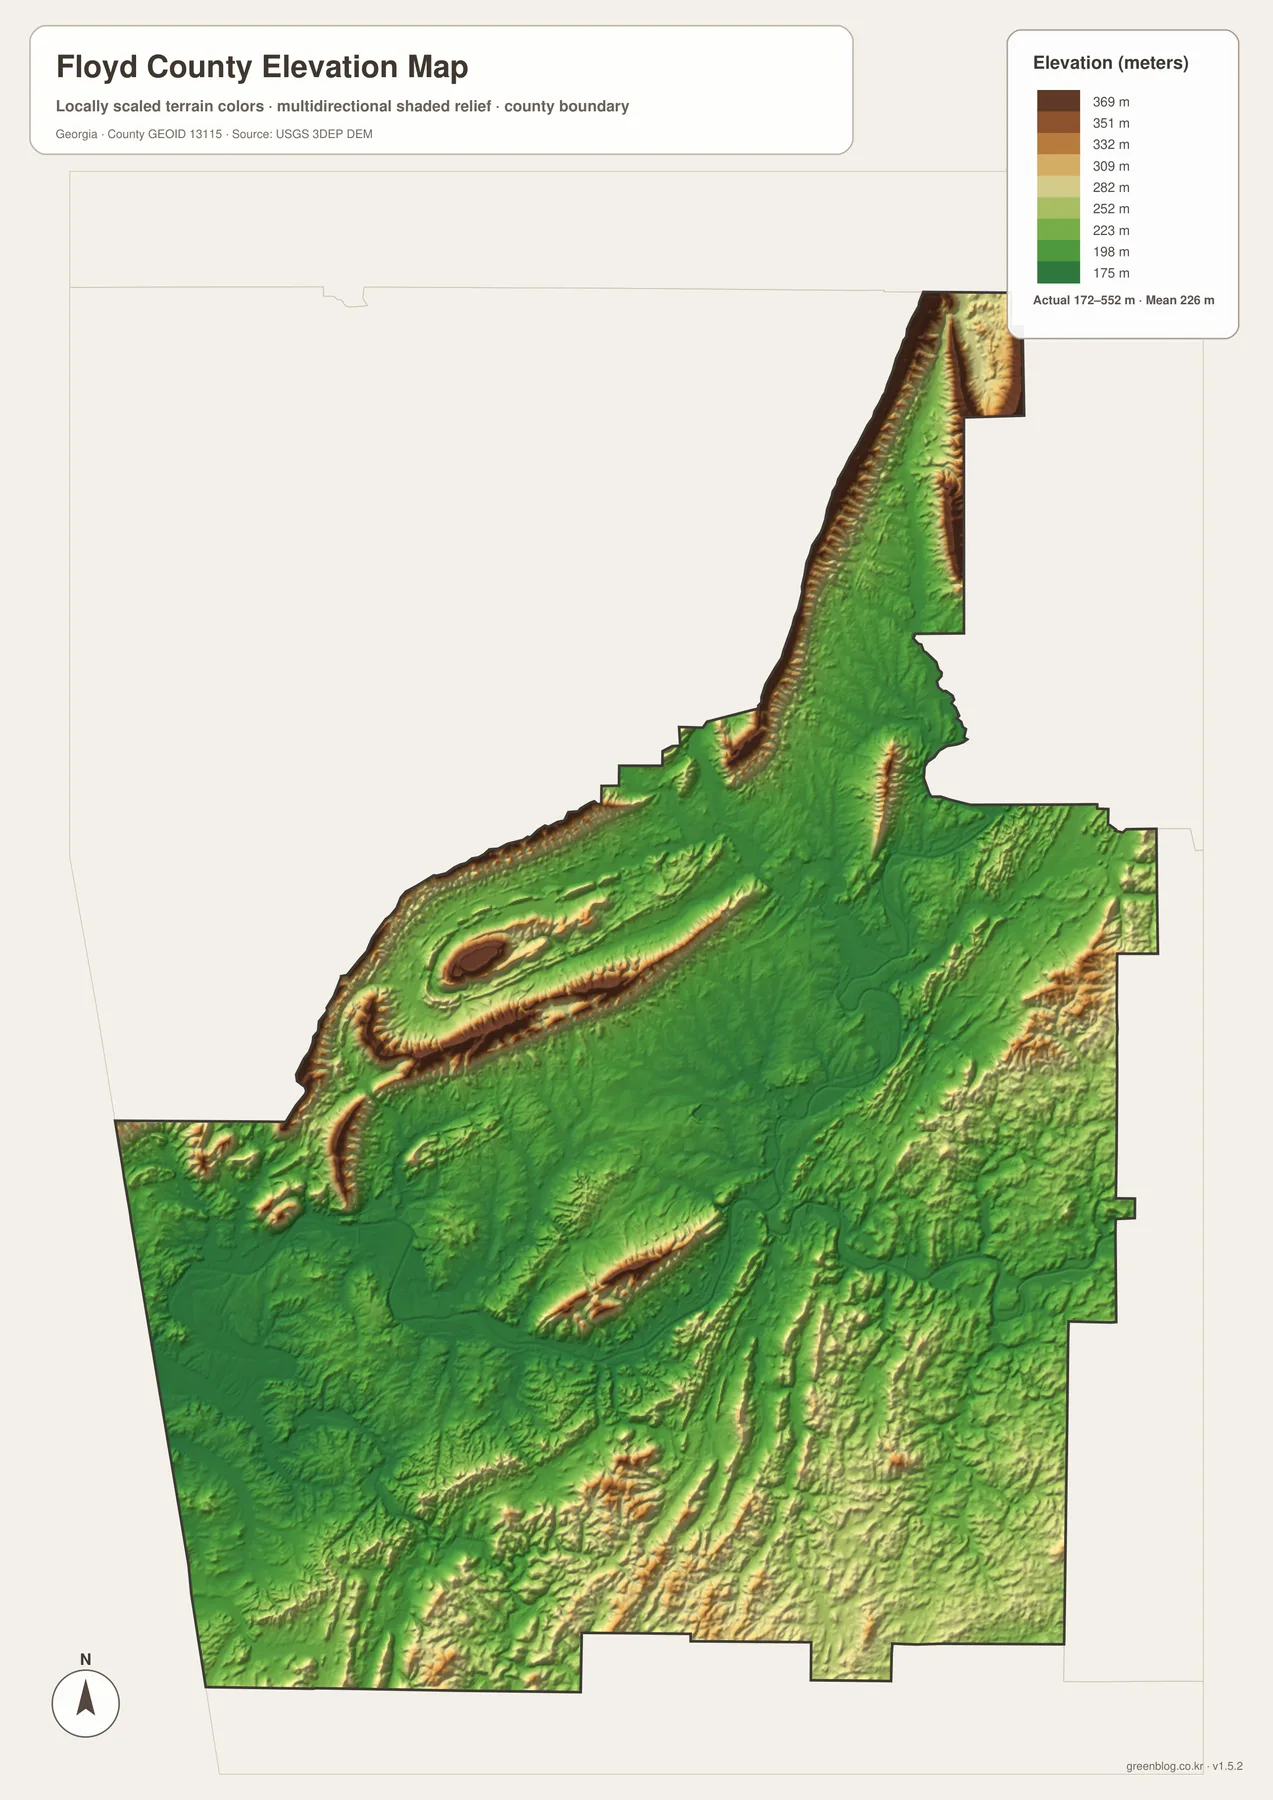
The elevation map reports an actual range of approximately 172 to 552 meters, with a mean of 226 meters. The county is dominated by green lower terrain, but the long brown and tan ridges are impossible to miss. Several of the strongest ridges run through the western and northwestern parts of Floyd County, and elevated terrain also borders sections of the narrow northern extension. The contrast creates a repeating ridge-and-valley appearance that is much more obvious on the shaded relief map than on the road map.
Rome and the major river corridors occupy relatively low ground. When the Oostanaula and Etowah paths from the water map are compared with the elevation colors, their valleys line up with broad green areas between the higher ridges. The Coosa corridor continues through lower terrain south of the junction. This does not mean every green pixel has the same elevation, but it does show the county-wide relationship between the main rivers and the lower landscape around them.
One of the most striking high areas appears west and northwest of Rome, where an elongated ridge system curves around a lower interior. Additional narrow ridges run through the central-southern and southeastern portions of the county. In the far north, the long county extension is bordered by sharply higher ground on both sides of a lower interior valley. These shapes explain why a county that may look simple on an administrative map becomes much more textured when elevation is added.
The color steps and hillshade are designed to make county-scale differences easy to see. They should not be used as a substitute for a site survey, construction-grade elevation measurement, drainage design, or engineering work. A detailed DEM or field survey is appropriate for those tasks. For general geographic comparison, the 172–552 meter range provides a clear way to distinguish the lower river valleys from the higher ridges surrounding them.
How Rome, Rivers, and Ridges Fit Together
The four map views answer different practical questions without repeating the same information. The general map is the best starting point for finding Rome, Cave Spring, numbered roads, and local landmarks. The city map then removes most of that detail so the separation between the two major city labels is easier to see. The water map shifts attention to the river junction near Rome and the tributaries crossing the county, while the elevation map explains why those waterways occupy broad green valleys between long higher ridges.
The relationship around Rome is especially useful. Roads and developed areas cluster near a low central valley, and the two major upstream rivers meet nearby. Once the Coosa River begins, the water continues through lower terrain rather than crossing the highest ridges. That visual relationship helps a reader connect the location of the county seat with the physical landscape. It also makes the map useful for a geography class because city location, water, and elevation can be discussed using the same set of county boundaries.
Cave Spring provides a contrasting reference in the southwest. It is much farther from the Rome river junction and sits within a different part of the ridge-and-valley pattern. The general map shows several road numbers around Cave Spring, while the elevation and water views add the surrounding terrain and drainage. A project focused on settlements might use the general and city maps together, whereas a project about physical geography would benefit more from the water and elevation maps.
The downloadable files are useful when the web previews are too small for the intended use. Each JPG keeps one focus—county reference, cities, water, or elevation—so a teacher, student, researcher, or presenter can choose a clean map rather than enlarging a crowded all-purpose image. The files share the same county boundary, which also makes it easy to compare one view with another in a document or slide deck.
Frequently Asked Questions
Which major rivers meet near Rome?
The supplied water map shows the Oostanaula River coming from the north and the Etowah River approaching from the east. They meet near Rome, and the downstream waterway is labeled the Coosa River.
Which cities are emphasized on the city map?
The simplified city map emphasizes Rome and Cave Spring. Rome occupies the larger central-eastern developed area, while Cave Spring is near the southwestern edge of Floyd County.
What elevation range does the map show?
The elevation legend states an actual range of about 172 to 552 meters and a mean of 226 meters. The map is intended to compare lower valleys and higher ridges across the county, not to provide survey-grade elevation for a specific property.
What is included in the downloadable ZIP?
The archive contains four high-resolution A3 JPG files: a general Floyd County map, a city map, a water map, and an elevation map. Each file emphasizes a different part of the county while using the same overall boundary.
Map File Information
Floyd County A3 Map Files
- Included Files: 4 high-resolution A3 JPG map files shown in this article
- File Type: JPG files in a ZIP archive
- Intended Use: Printing, education, presentations, and map-based projects
Related Maps
Sources and Reference Material
- U.S. Census Bureau QuickFacts: Floyd County – current official county statistics
- New Georgia Encyclopedia: Floyd County – county history and regional background
- New Georgia Encyclopedia: Rome – background on Rome
- U.S. Census Bureau TIGER/Line Shapefiles – county boundary and geographic reference data
- USGS National Hydrography – river, stream, and water-feature data
- USGS 3D Elevation Program – elevation data
Green Map creates custom-edited map images using open geographic data sources such as geoBoundaries, Natural Earth, OpenStreetMap, and government open data. These maps are edited visual materials, not raw data files, and are provided for education, documents, presentations, and graphic reference.