Agriculture fills most of Champaign County on the supplied 2025 land-cover map. The county summary assigns 85.18% to agriculture and 12.75% to developed cover, while the largest built concentration sits around the Champaign–Urbana area near the middle of the county. This Champaign County Illinois Land Cover Map is designed to compare that strong farm pattern with the much smaller areas of forest, wetlands, water, and hard urban surfaces.
Four views are included: current land cover, forest and farmland, impervious surface and developed land, and a 1985–2025 class-difference map. The WebP images can be read on the page, and the four original 2480 × 1754-pixel JPG files are available together in one ZIP. They work well for county profiles, classroom comparison, presentations, and broader landscape reference.
Table of Contents
A farm-dominated county with one much stronger urban concentration
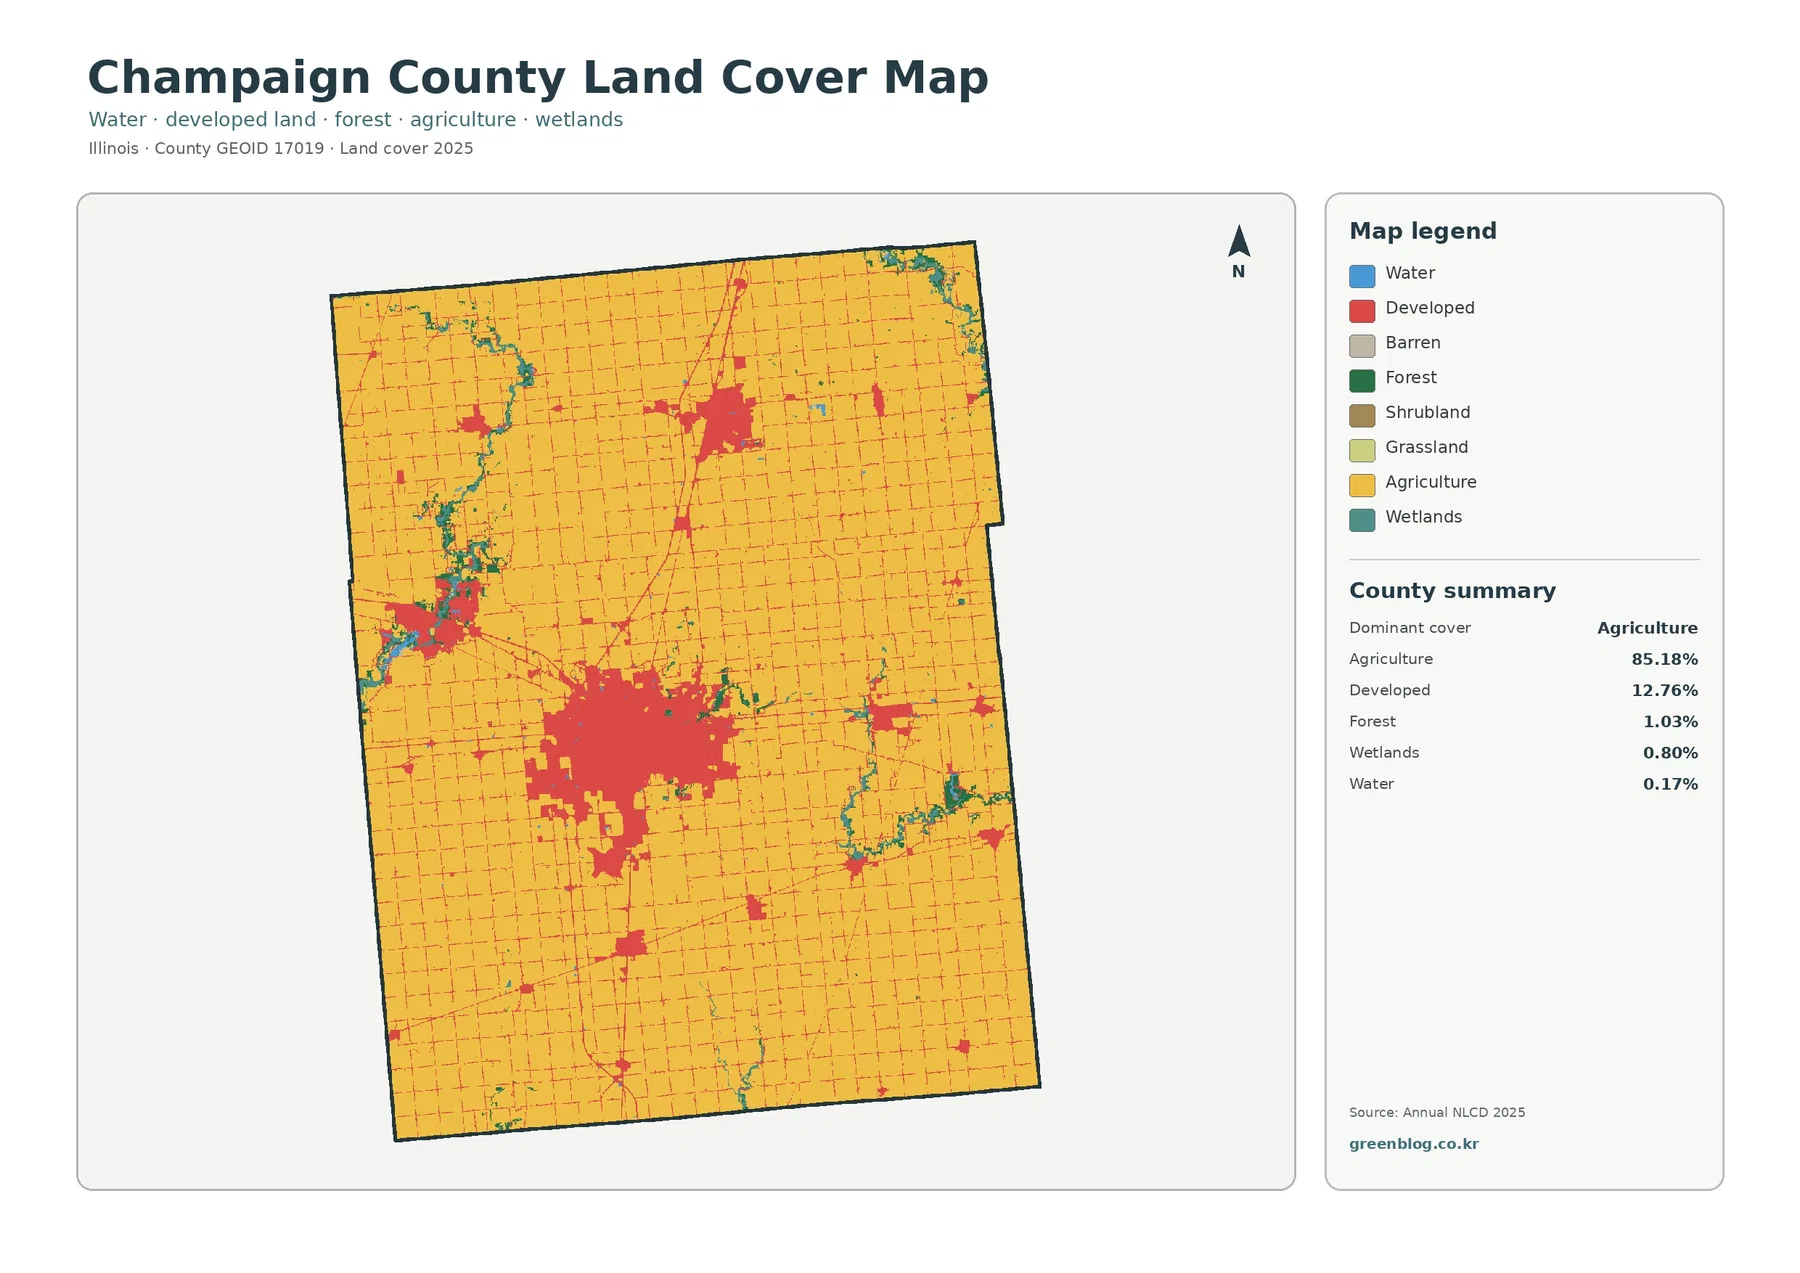
Agriculture accounts for 85.18% of the mapped county. Developed cover is 12.75%, followed by forest at 1.03%, wetlands at 0.80%, and open water at 0.17%. The companion vegetation summary also lists grassland at 0.03% and shrubland at 0.02%. Those figures make the main pattern unusually clear: working land dominates the county, while most other cover occupies a small share.
The spatial pattern adds information that the percentages cannot show. Yellow agricultural cells extend across nearly every side of the county, forming large, regular blocks. A broad red cluster interrupts that grid around Champaign and Urbana. Smaller developed patches appear elsewhere, but none approach the size of the central concentration. Fine red traces also cross rural areas without turning the surrounding landscape into continuous development.
The official Champaign County website notes that Interstates 57, 72, and 74 meet within the county. Linear developed traces on the land-cover image broadly fit a road-centered settlement pattern, but the preview has no route labels. It is therefore useful for showing where built cover and transportation corridors appear together, not for naming a specific highway from color alone.
Land cover describes the surface class assigned from imagery. It is not zoning, ownership, a parcel survey, or permission to develop. An agricultural cell does not identify a crop or a farm operator, and a developed cell may contain lawns, trees, bare soil, and other permeable surfaces along with buildings and pavement.
The impervious layer separates hard surfaces from the broader developed class
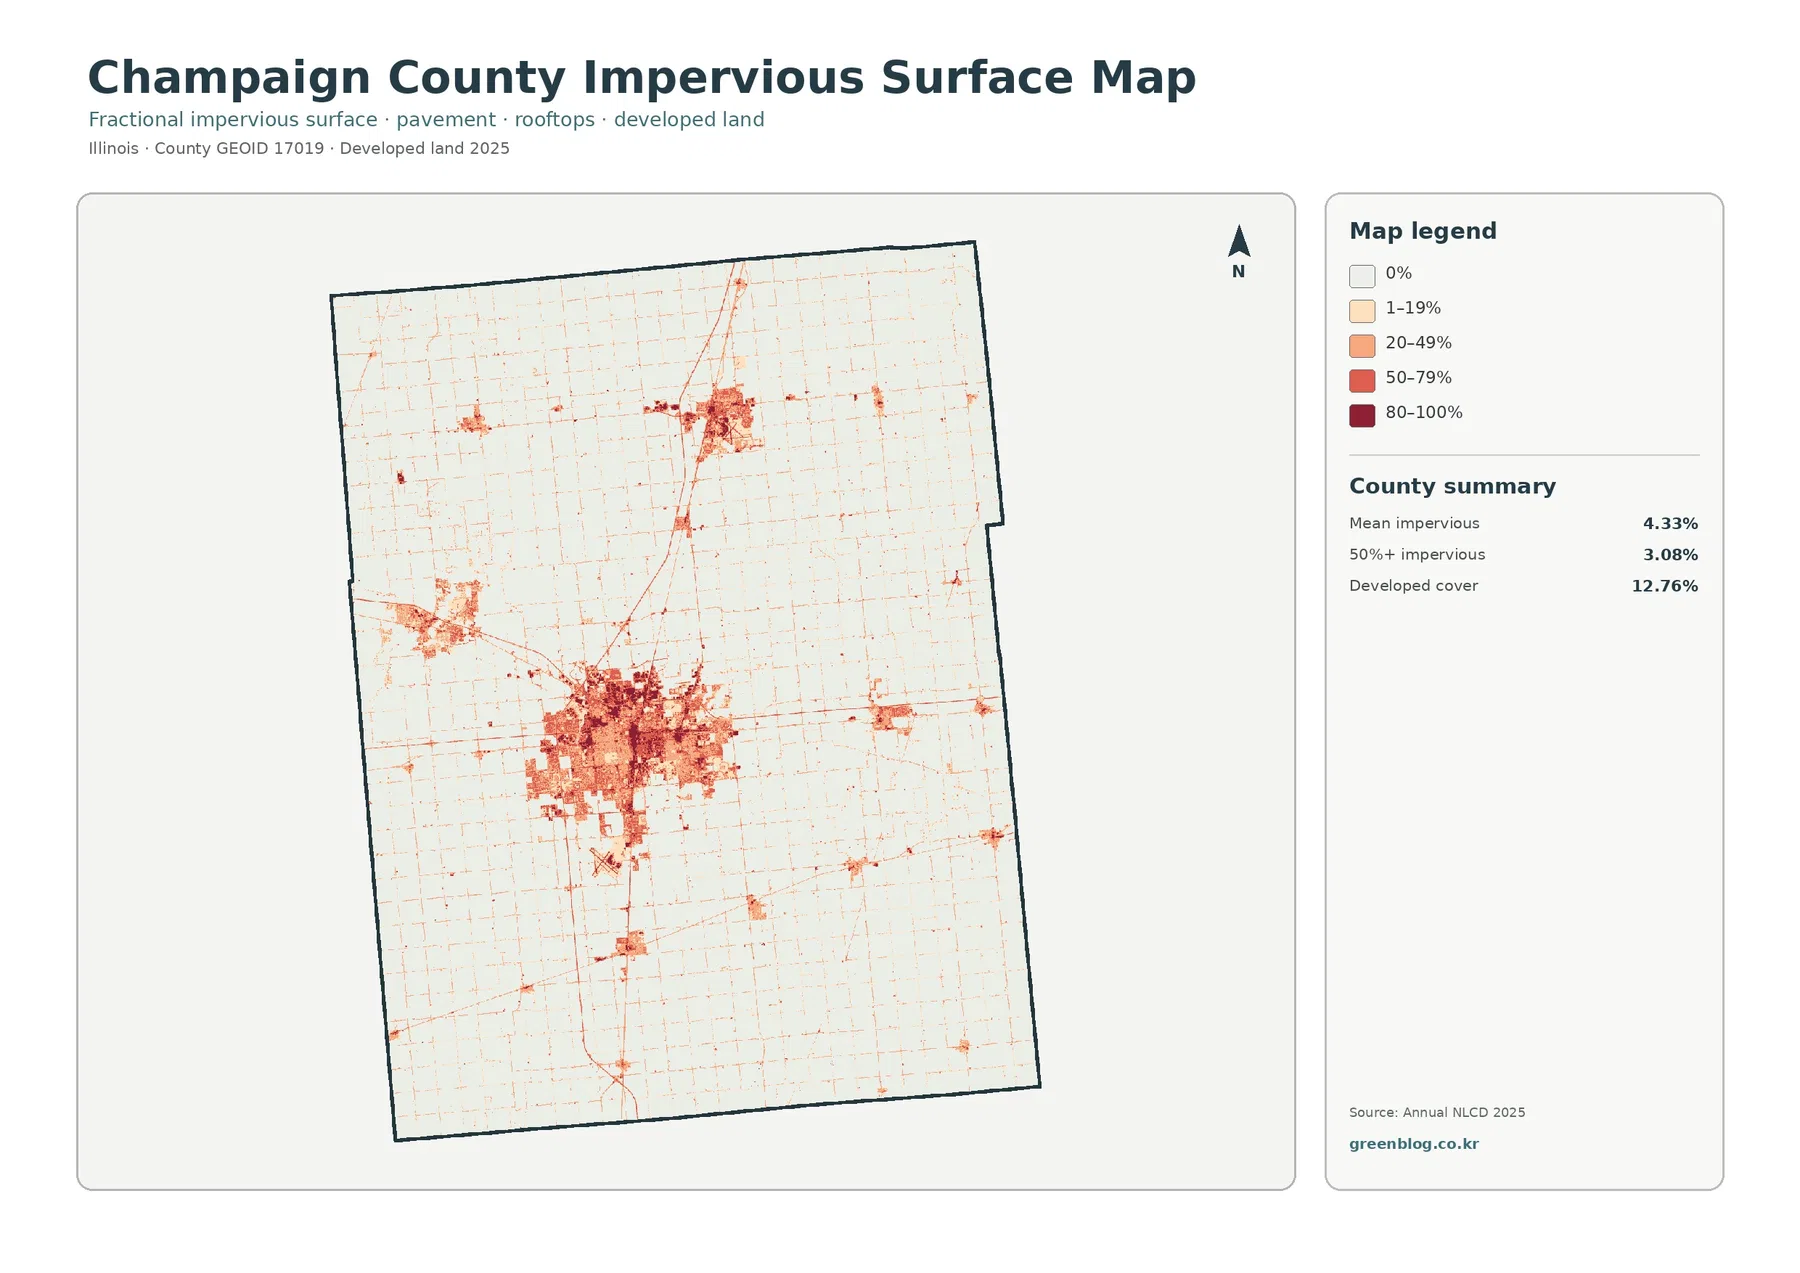
Mean impervious cover is 4.33%, and 3.08% of the county is mapped at 50% impervious or greater. Both values are lower than the 12.75% developed share because developed land is a broader category. A neighborhood can be classified as developed even when much of each 30-meter cell is lawn, tree canopy, or exposed soil rather than a roof or paved surface.
The darkest tones form a large, connected concentration in the Champaign–Urbana area. Thin lines and smaller patches extend outward, while most of the agricultural interior remains pale. This is a better image than the general land-cover map when the question is specifically about where hard surfaces are concentrated rather than where any developed class occurs.
A countywide mean can hide that contrast. The 4.33% average combines a compact urban core with extensive rural land close to zero impervious cover. When explaining development intensity, the location and continuity of dark cells are more useful than the average by itself.
Impervious cover can be a starting point for runoff or drainage discussions, but it is not a flood-risk map. Rainfall, soil, elevation, stormwater systems, streams, wetlands, and local drainage conditions also matter. Site-level flood or engineering decisions require current hydrologic and regulatory information.
Cropland remains dominant after developed and miscellaneous surfaces fade
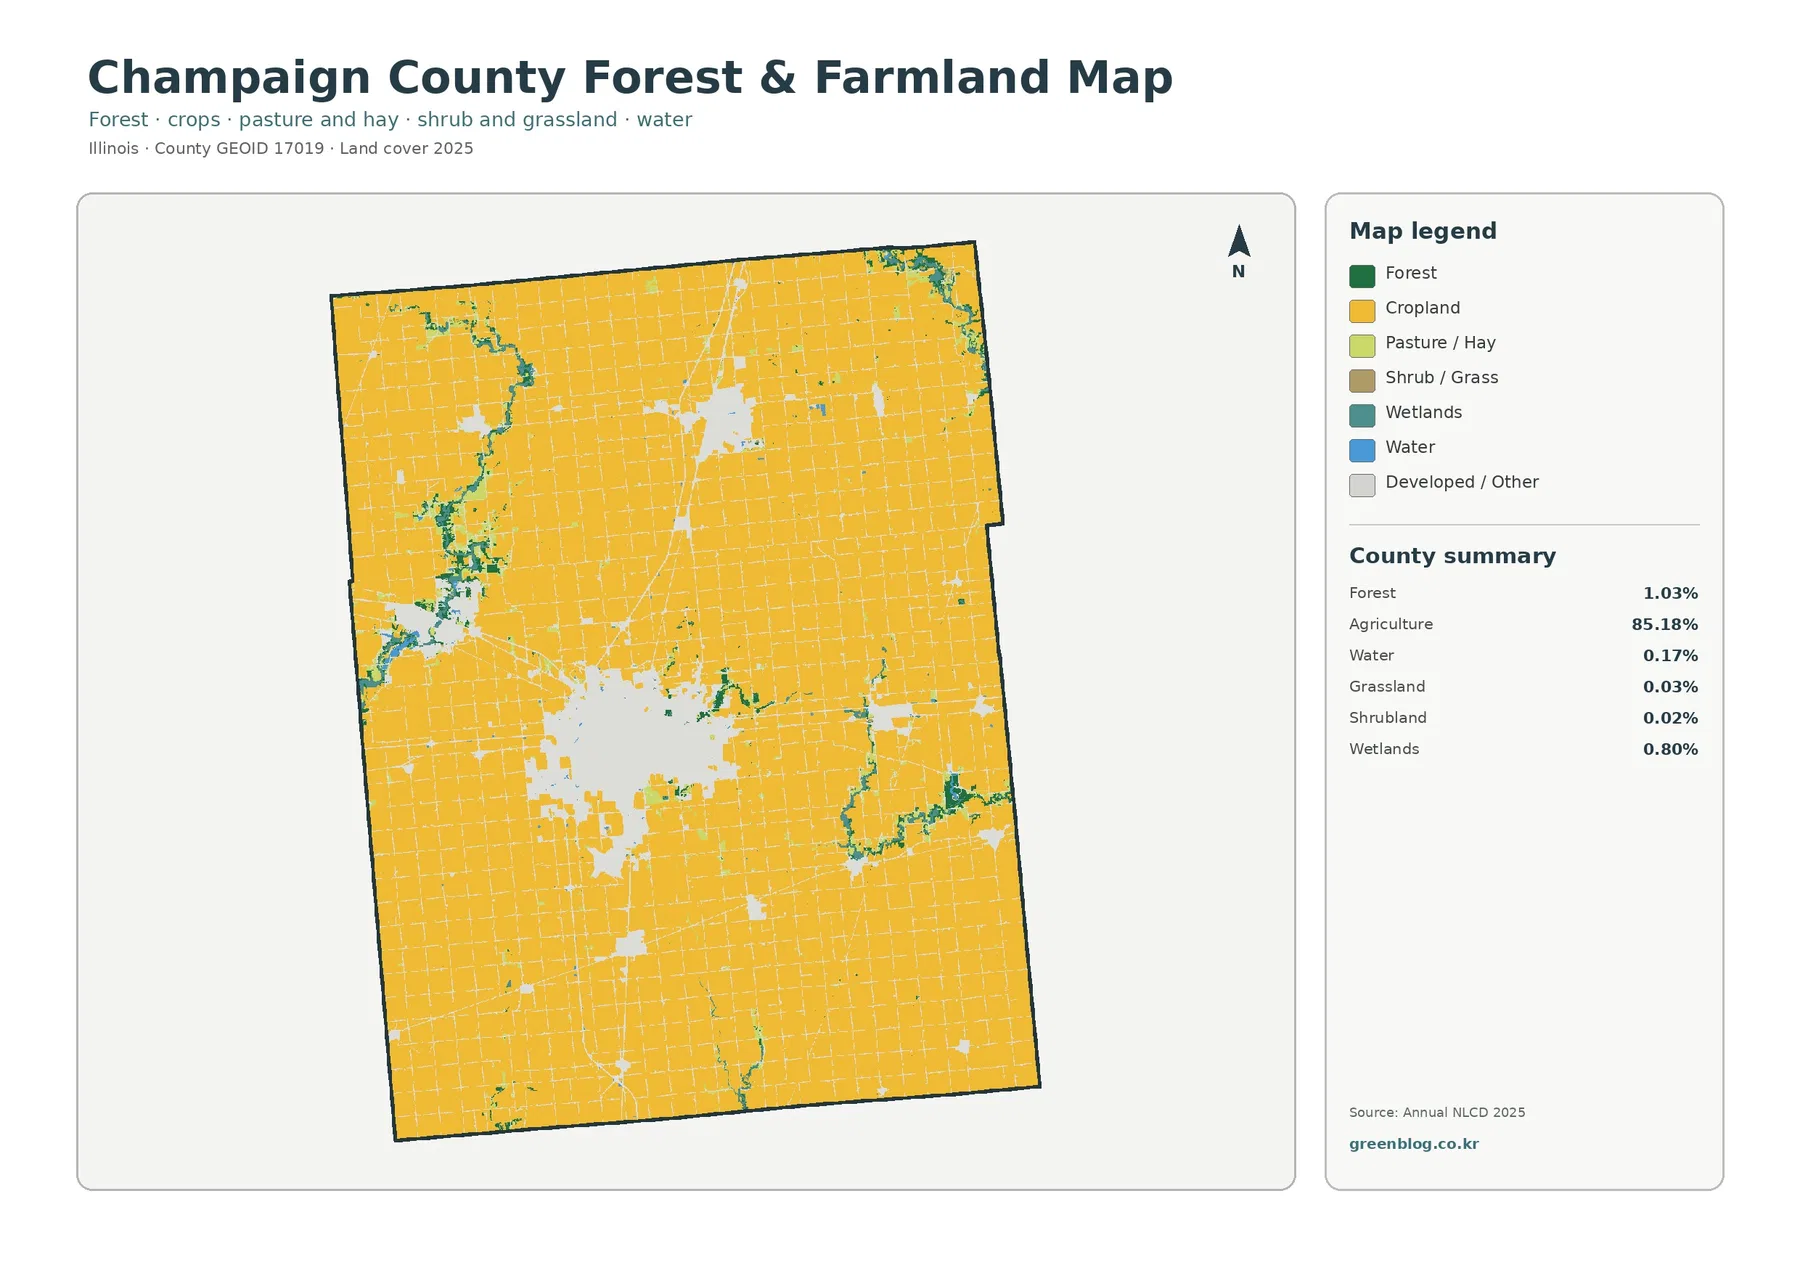
The forest-and-farmland view removes much of the visual weight of developed land, so the 85.18% agricultural share becomes even more obvious. Cropland forms the broad background across the county. Forest at 1.03% and wetlands at 0.80% are small in total area, but they become easier to notice because they occur as narrow bands and small clusters within the farm grid.
Green and teal cover is most visible in several western, southeastern, and northeastern stretches. Many pieces are elongated rather than block-shaped, which is consistent with natural cover following drainage features in a heavily farmed landscape. The preview does not label streams, however, so an individual strip should not be assigned to the Sangamon River, Salt Fork, Middle Fork, or another channel without a hydrography layer.
The Champaign County Forest Preserve District provides useful local context because its master plan describes preserves along the Sangamon River, Salt Fork River, and Middle Fork River. That information shows why stream corridors are important natural features in the county, but preserve boundaries and Annual NLCD cells are not interchangeable. One is a managed-land boundary; the other is a 30-meter surface classification.
The USDA 2022 Census of Agriculture offers a separate measure of the county’s agricultural setting. It reports 545,674 acres of land in farms and 526,778 acres of cropland. Those figures should not be converted into the 85.18% Annual NLCD value because the datasets have different definitions and methods, but both sources independently show how strongly agriculture shapes Champaign County.
Only 5.34% of cells differ between the 1985 and 2025 endpoint classes
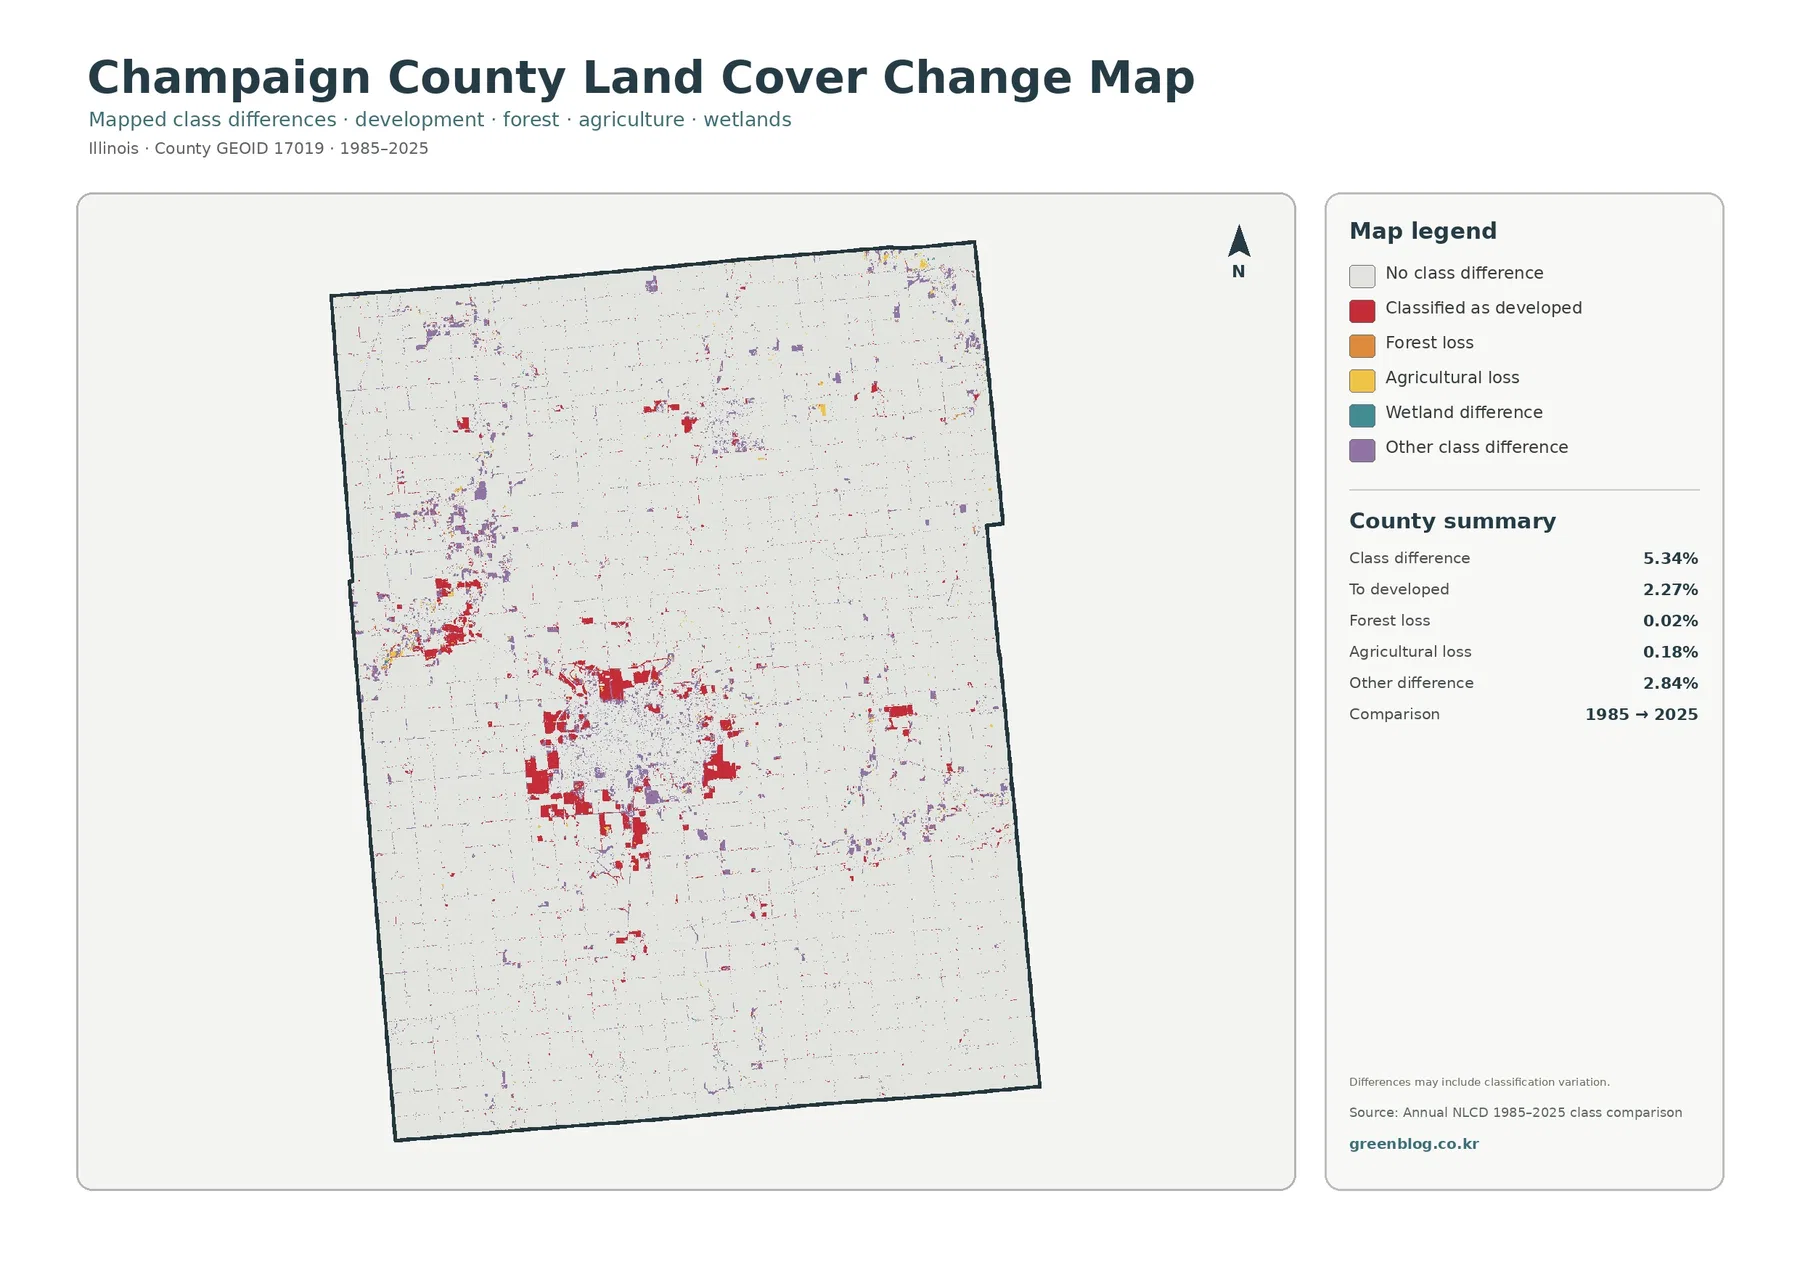
The change summary reports 5.34% total class difference. It lists 2.27% classified as developed at the 2025 endpoint, 0.02% forest loss, 0.18% agricultural loss, and 2.84% other difference. Wetland difference appears in the legend without a separate percentage, so a residual calculation or visual estimate should not be presented as an official value.
Red cells are most noticeable around the Champaign–Urbana concentration and appear in smaller clusters and lines elsewhere. Purple “other difference” cells are more scattered across the county. Reading the current map first helps prevent a common mistake: the change colors mark endpoint differences, not the present land-cover classes themselves.
A cell classified as developed in this comparison was assigned another class in 1985 and a developed class in 2025. The map does not supply the exact construction year, project name, or cause. Intermediate imagery, permits, road records, and local planning documents are needed to determine when and why a specific location changed.
The same caution applies to forest loss and agricultural loss. Those labels describe a class at the 1985 endpoint that was different by 2025; they are not automatic proof of logging, permanent farm conversion, ecological damage, or a particular land-use decision. Mixed pixels, seasonal conditions, and classification changes can contribute to some differences.
Frequently Asked Questions
Is Champaign County really more than 85% agricultural on this map?
Yes. The supplied 2025 Annual NLCD county summary lists agriculture at 85.18%. The USDA Census of Agriculture uses different definitions and acreage accounting, so its cropland figures should not be treated as the same statistic, but it independently confirms the county’s strong agricultural setting.
Why is developed cover 12.75% when mean impervious cover is only 4.33%?
Developed classes can include lawns, trees, bare soil, and other permeable surfaces around buildings and roads. The impervious layer isolates roofs, pavement, parking areas, and similar hard materials, so the countywide mean is lower than the broader developed-cover share.
Does the 5.34% 1985–2025 class difference equal the amount of land physically changed?
No. It is the share of cells assigned different endpoint classes, and it can include real surface change as well as classification variation. Exact timing and cause require intermediate imagery, local records, permits, and other site-specific evidence.
Choosing the right image for a county profile or comparison
Use the 2025 land-cover overview when the main question is simply what covers Champaign County. It places the 85.18% agricultural background, the 12.75% developed share, the central urban concentration, and the smaller natural-cover bands in a single frame. It is the clearest starting image for a county introduction.
Choose the forest-and-farmland map when streamside natural cover or the relationship between fields and vegetation matters more than city detail. Use the impervious map when the subject is roofs, pavement, and development intensity. Add the 1985–2025 comparison only after the current pattern is clear, so readers do not mistake endpoint change categories for current cover.
For presentations, one large primary map plus one comparison map is often easier to read than four small panels. The overview paired with the impervious image works well for farm-versus-city contrast. The overview paired with the vegetation map is better for showing how narrow forest and wetland features sit within the agricultural grid.
Scale, date, and print limits matter when using the JPG files
Annual NLCD is commonly represented with 30-meter square raster cells. Each cell receives a predominant class even when crops, a tree row, a ditch, pavement, grass, and a building share the same area. Straight edges can resemble parcel lines, but they are not survey boundaries. Small ponds, narrow channels, farm roads, and thin vegetation strips may be absorbed into a neighboring class.
Zooming makes the cells larger; it does not create detail that was absent from the source. Mixed cells near field edges, settlements, or streams may also receive different classes in different years. Parcel-scale work therefore needs higher-resolution imagery, current cadastral data, and sometimes field inspection.
The current maps use the supplied 2025 observation year. Later construction, demolition, harvest, vegetation recovery, or temporary wet conditions may not appear. The 1985–2025 layer compares two endpoints rather than providing a continuous forty-year history, so an area could have changed in an intermediate year without that sequence being visible here.
Each downloadable JPG measures 2480 × 1754 pixels. The original files are more convenient than the page previews for enlargement and printing, but the asset manifest does not mark them as meeting an A3 high-resolution reference. Test large-format output before relying on small legend details. These maps are reference graphics, not survey, parcel, wetland-jurisdiction, flood-insurance, or engineering products.
What is included in the four-map JPG download
The ZIP contains one JPG each for 2025 land cover, forest and farmland, impervious surface and developed land, and 1985–2025 land-cover change. Start with the overview for the countywide pattern, then choose the specialized image that matches the question. All four files use the same county area, which makes side-by-side comparison straightforward.
Map File Information
The ZIP contains four original JPG maps for comparing Champaign County's 85.18% agricultural cover, Champaign–Urbana development, impervious surfaces, and 1985–2025 class differences.
- Included Files: Map images described in this article
- File Type: ZIP archive
- Intended Use: Printing, education, presentations, and map-based projects
Related Maps
- Adams County Illinois Land Cover Map
- Alexander County Illinois Land Cover Map
- Bond County Illinois Land Cover Map
Sources and Reference Data
- MRLC Annual NLCD Data – official access point for annual land-cover and comparison products
- USGS Annual NLCD Land Cover Classification – definitions and guidance for agriculture, developed land, forest, wetlands, and related classes
- U.S. Census Bureau TIGER/Line Shapefiles – official county-boundary reference for Champaign County
- Champaign County Illinois – Official County Website – county location and transportation context, including the I-57, I-72, and I-74 intersection
- USDA 2022 Census of Agriculture – Champaign County – county profile for land in farms, cropland, and agricultural production
- Champaign County Land Resource Management Plan – official county goals for agriculture, urban development, transportation, and natural resources
- Champaign County Forest Preserve District Master Plan – local context for preserves and natural areas along the Sangamon, Salt Fork, and Middle Fork river systems
Green Map creates custom-edited map images using open geographic data sources such as geoBoundaries, Natural Earth, OpenStreetMap, and government open data. These maps are edited visual materials, not raw data files, and are provided for education, documents, presentations, and graphic reference.