Montana is geographically large, but its residents occupy that space very unevenly. The 2024 ACS 5-year estimate in the supplied data places the state population at 1,116,875. The county-density map lists about 145,550 square miles of land and an average density of only about 8 people per square mile. That statewide average is useful, but it hides the much tighter settlement around Billings, Bozeman, Missoula, Great Falls, Helena, and Kalispell.
The maps are most useful when three different measures remain separate. Total population answers how many people live in a county or census place. Density compares population with land area. Population change measures how much a county grew or declined between the 2010 and 2020 decennial censuses. Yellowstone County leads the 2024 county totals and county-average density, while Gallatin County recorded the strongest 2010–2020 percentage growth. Those are related facts, but they are not interchangeable.
Table of Contents
The tract map reveals small islands of high density inside a very low-density state
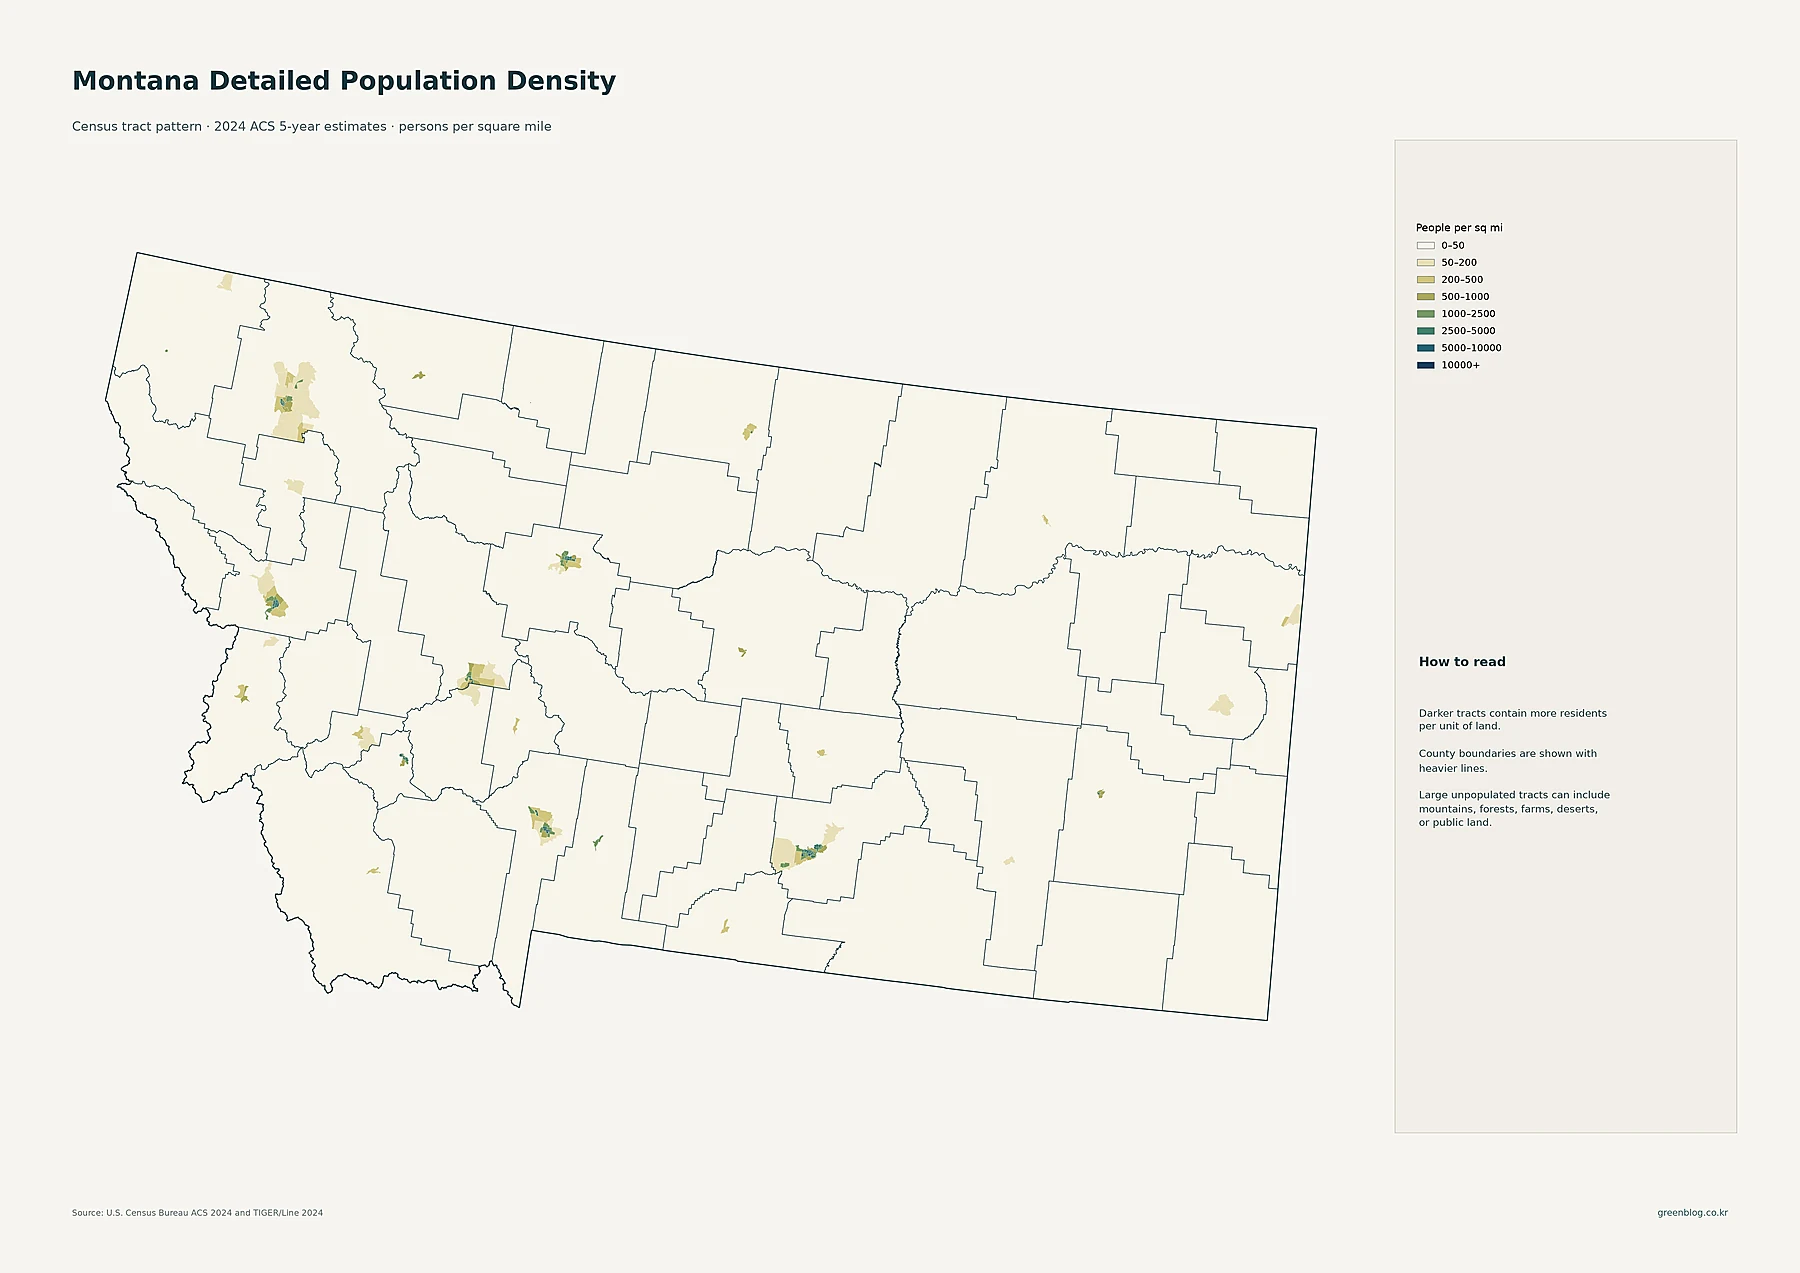
The detailed map does not show a broad continuous belt of dense settlement. Instead, darker tracts appear as compact clusters separated by very large pale areas. Billings forms the clearest concentration in south-central Montana. Bozeman and Belgrade form another in Gallatin County, while Missoula stands out in the west. Great Falls, Helena and the Helena Valley, and the Kalispell–Evergreen–Whitefish area also appear as distinct concentrations. Smaller dense patches correspond to other communities scattered across the state.
The legend divides tract density into 0–50, 50–200, 200–500, 500–1,000, 1,000–2,500, 2,500–5,000, 5,000–10,000, and 10,000+ people per square mile. Most of Montana’s land falls in the lightest class, but urban cores contain much darker tracts. The map’s reading note also matters: a large tract can include mountains, forests, grasslands, or other sparsely occupied land. A large polygon therefore should not be mistaken for a large population center.
Billings is the largest census place, followed by Missoula, Great Falls, and Bozeman
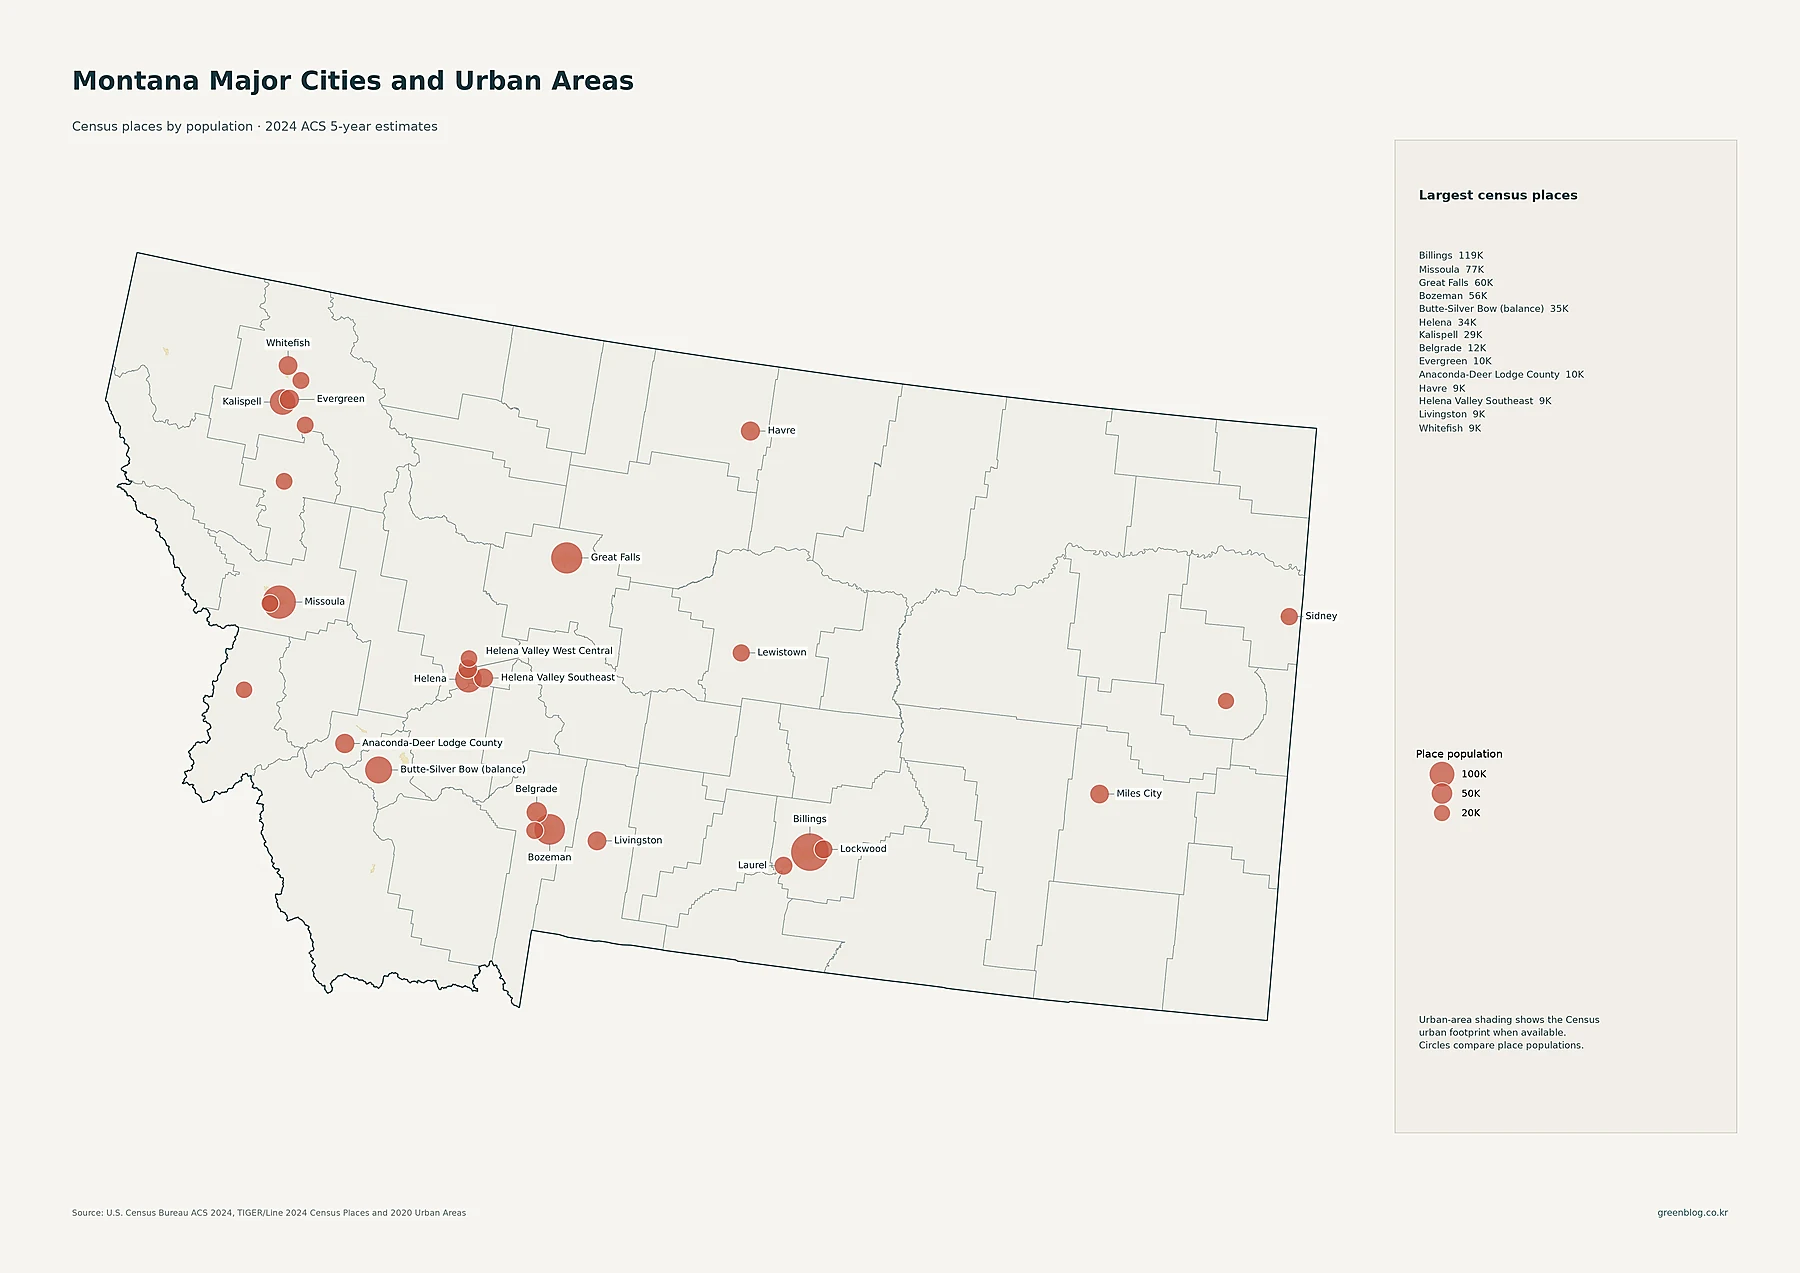
Billings is the state’s largest census place in the supplied 2024 ACS data, with 119,434 residents. Missoula follows at 76,514, Great Falls at 60,329, and Bozeman at 56,114. Butte-Silver Bow (balance) has 35,052 residents, Helena 33,639, and Kalispell 28,504. The next group includes Belgrade at 11,872, Evergreen at 9,611, Anaconda-Deer Lodge County at 9,597, Havre at 9,258, Helena Valley Southeast at 9,108, Livingston at 8,780, and Whitefish at 8,749.
The geography is as informative as the ranking. Montana does not have one metropolitan concentration dominating the entire map. Billings anchors the south-central part of the state, Missoula and the Flathead-area communities anchor western and northwestern clusters, Great Falls and Helena create central concentrations, and Bozeman and Belgrade form a notable southwestern cluster. The circles compare place populations, not density. A larger circle means more residents in that census place, not necessarily more residents per square mile.
Yellowstone County has the largest total, while four counties exceed 100,000 residents
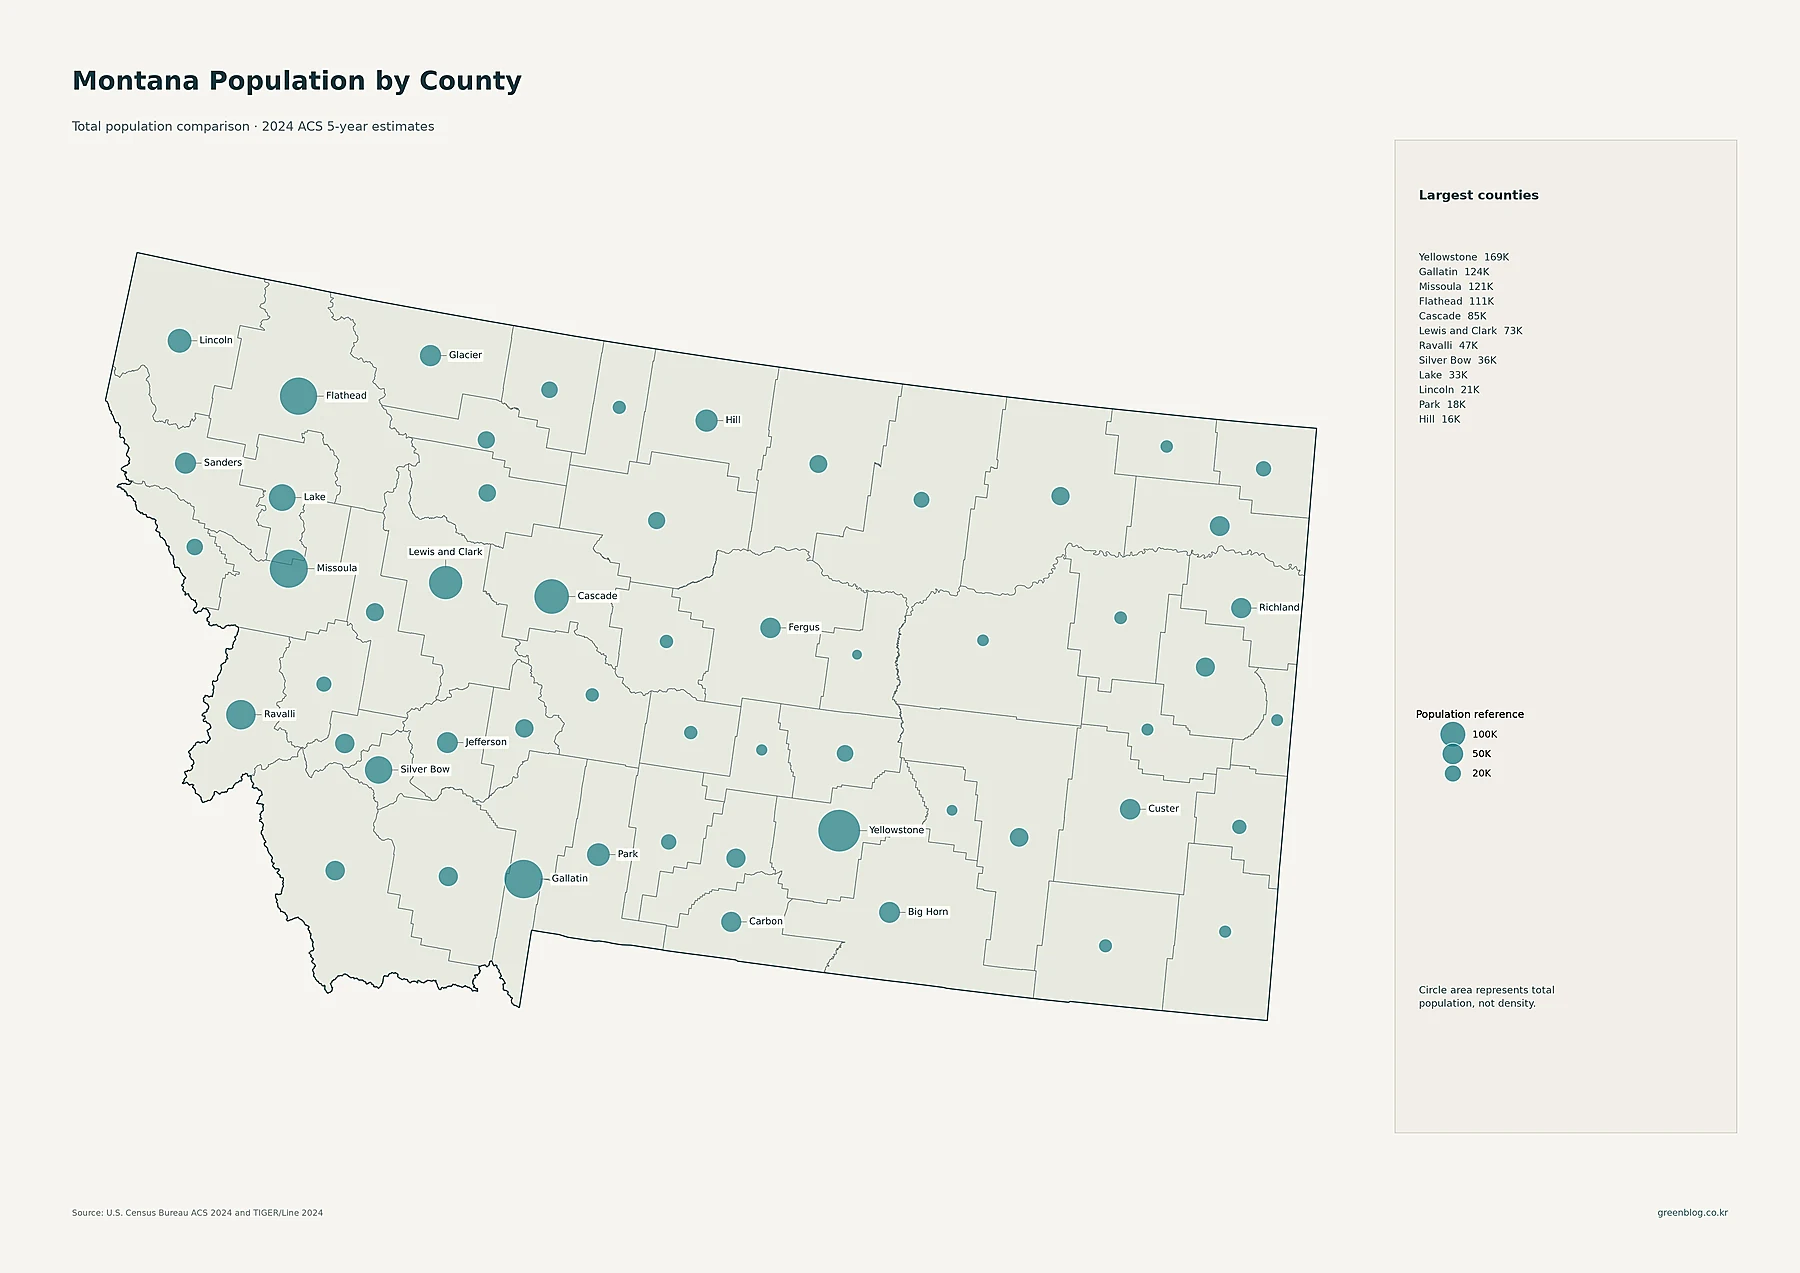
Yellowstone County has 168,957 residents, the largest county total in Montana. Gallatin County has 124,074, Missoula County 120,672, and Flathead County 110,695, making them the other counties above 100,000 in this dataset. Cascade County follows with 84,606 and Lewis and Clark County with 73,464. Ravalli County has 46,727, Silver Bow County 35,785, Lake County 32,561, Lincoln County 21,175, and Park County 17,710.
This map makes the contrast between population size and geographic size especially clear. Many large county polygons in central and eastern Montana carry very small circles because their total populations are low. Conversely, the larger circles align with the state’s main urban centers and valleys. The proportional symbols are therefore best used to answer where the largest numbers of people live. They do not show whether residents are tightly packed within the county or spread over a large area.
County-average density peaks in Yellowstone, but even the leaders remain modest by urban U.S. standards
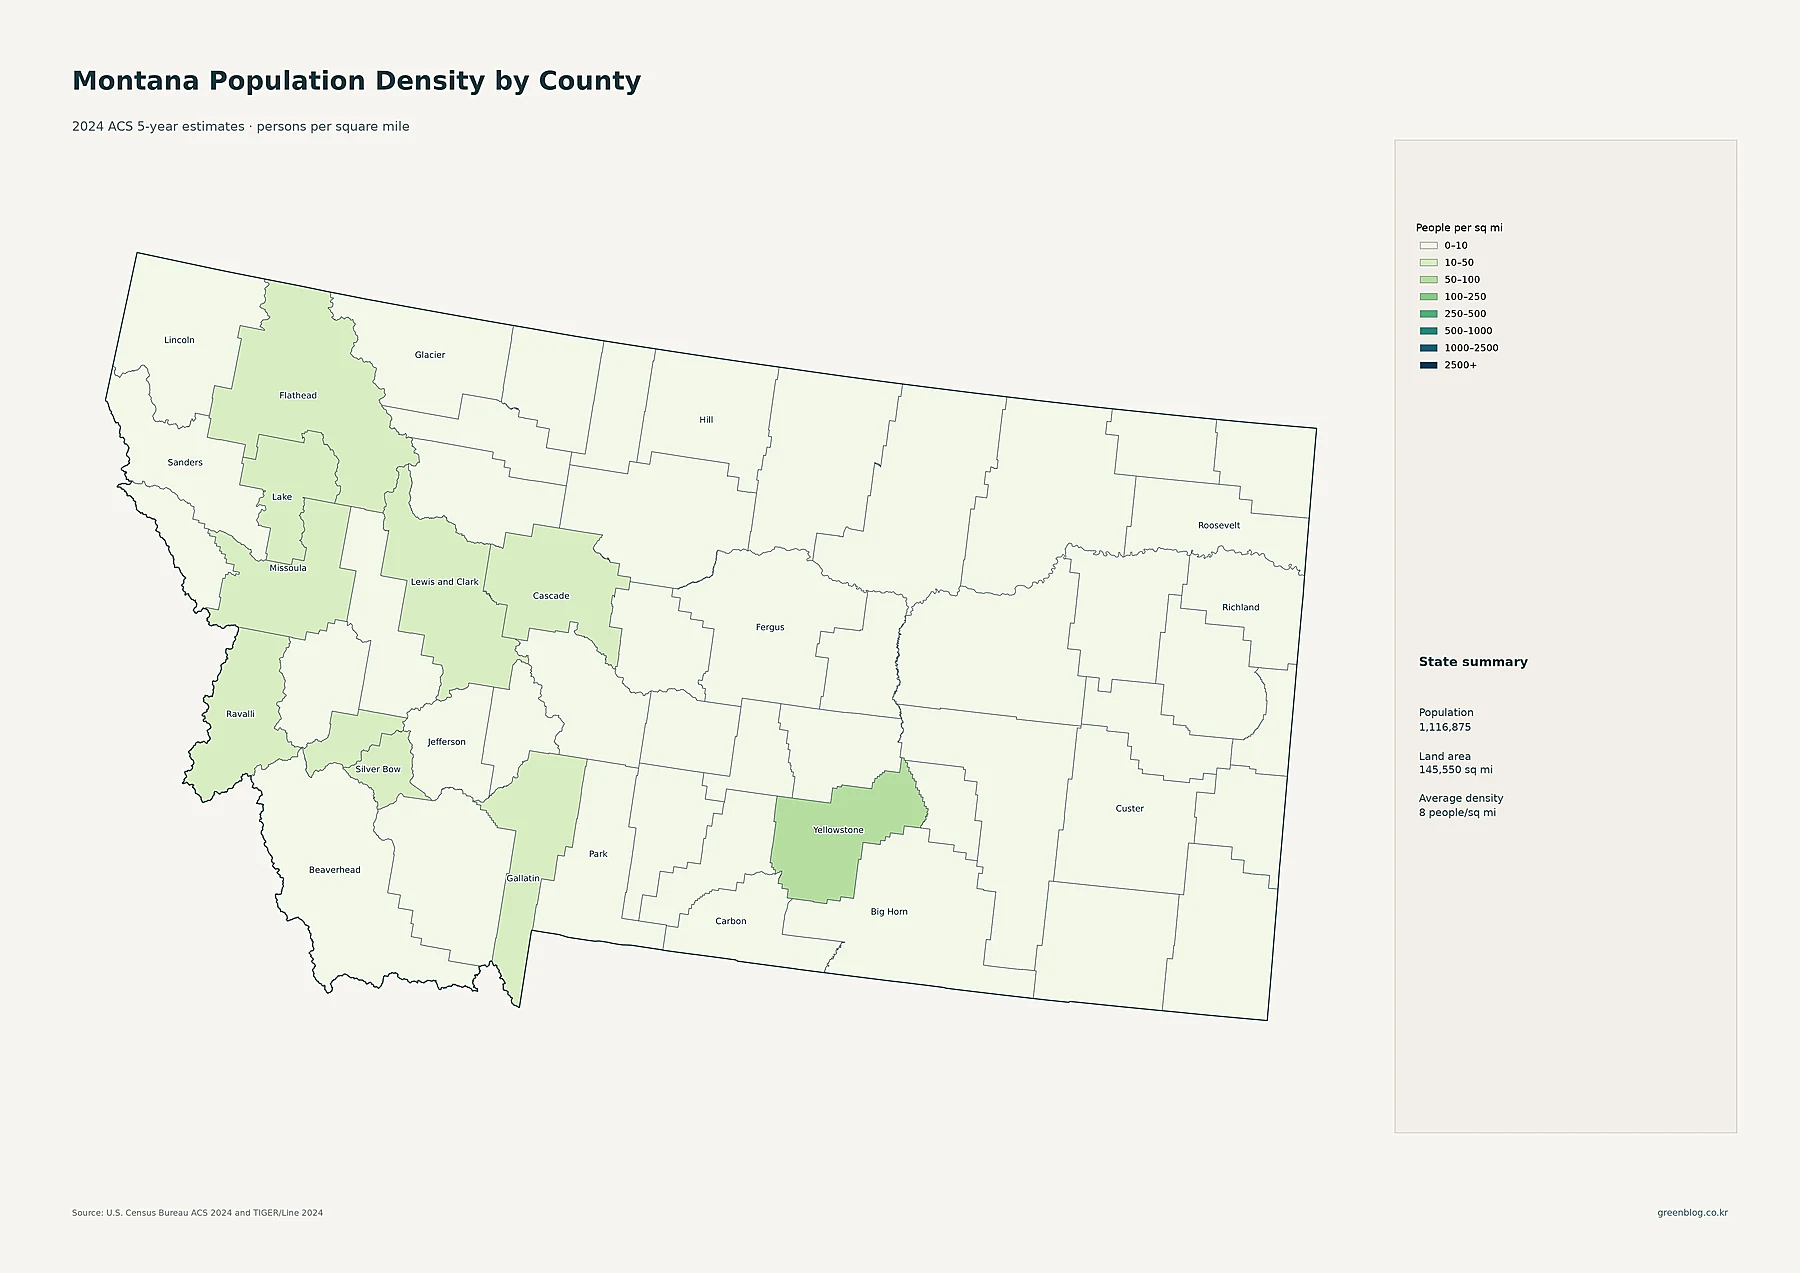
Yellowstone County has the highest county-average density at about 64.2 people per square mile. Silver Bow County is next at about 49.8, followed by Gallatin at 47.6, Missoula at 46.5, and Cascade at 31.4. Lake and Flathead are both near 21.8, Lewis and Clark is about 21.2, and Ravalli is about 19.5. These values are the highest within Montana, but none reaches the 100-per-square-mile class shown in the legend.
Much of the state is below 10 people per square mile. Garfield County is around 0.23 people per square mile, Carter about 0.39, and Meagher about 0.84 in the supplied county data. This is why the county map appears overwhelmingly pale even though the detailed tract map contains dark urban patches. The two maps operate at different scales: a county average can be very low while a small part of that county contains a compact town or city.
| Measure | Leading area | Value in supplied data |
|---|---|---|
| State population | Montana | 1,116,875 |
| Largest county population | Yellowstone County | 168,957 |
| Highest county density | Yellowstone County | about 64.2/sq mi |
| Fastest 2010–2020 growth | Gallatin County | +32.9% |
| Largest 2010–2020 decline | Liberty County | -16.2% |
Gallatin grew 32.9% from 2010 to 2020, while Liberty declined 16.2%
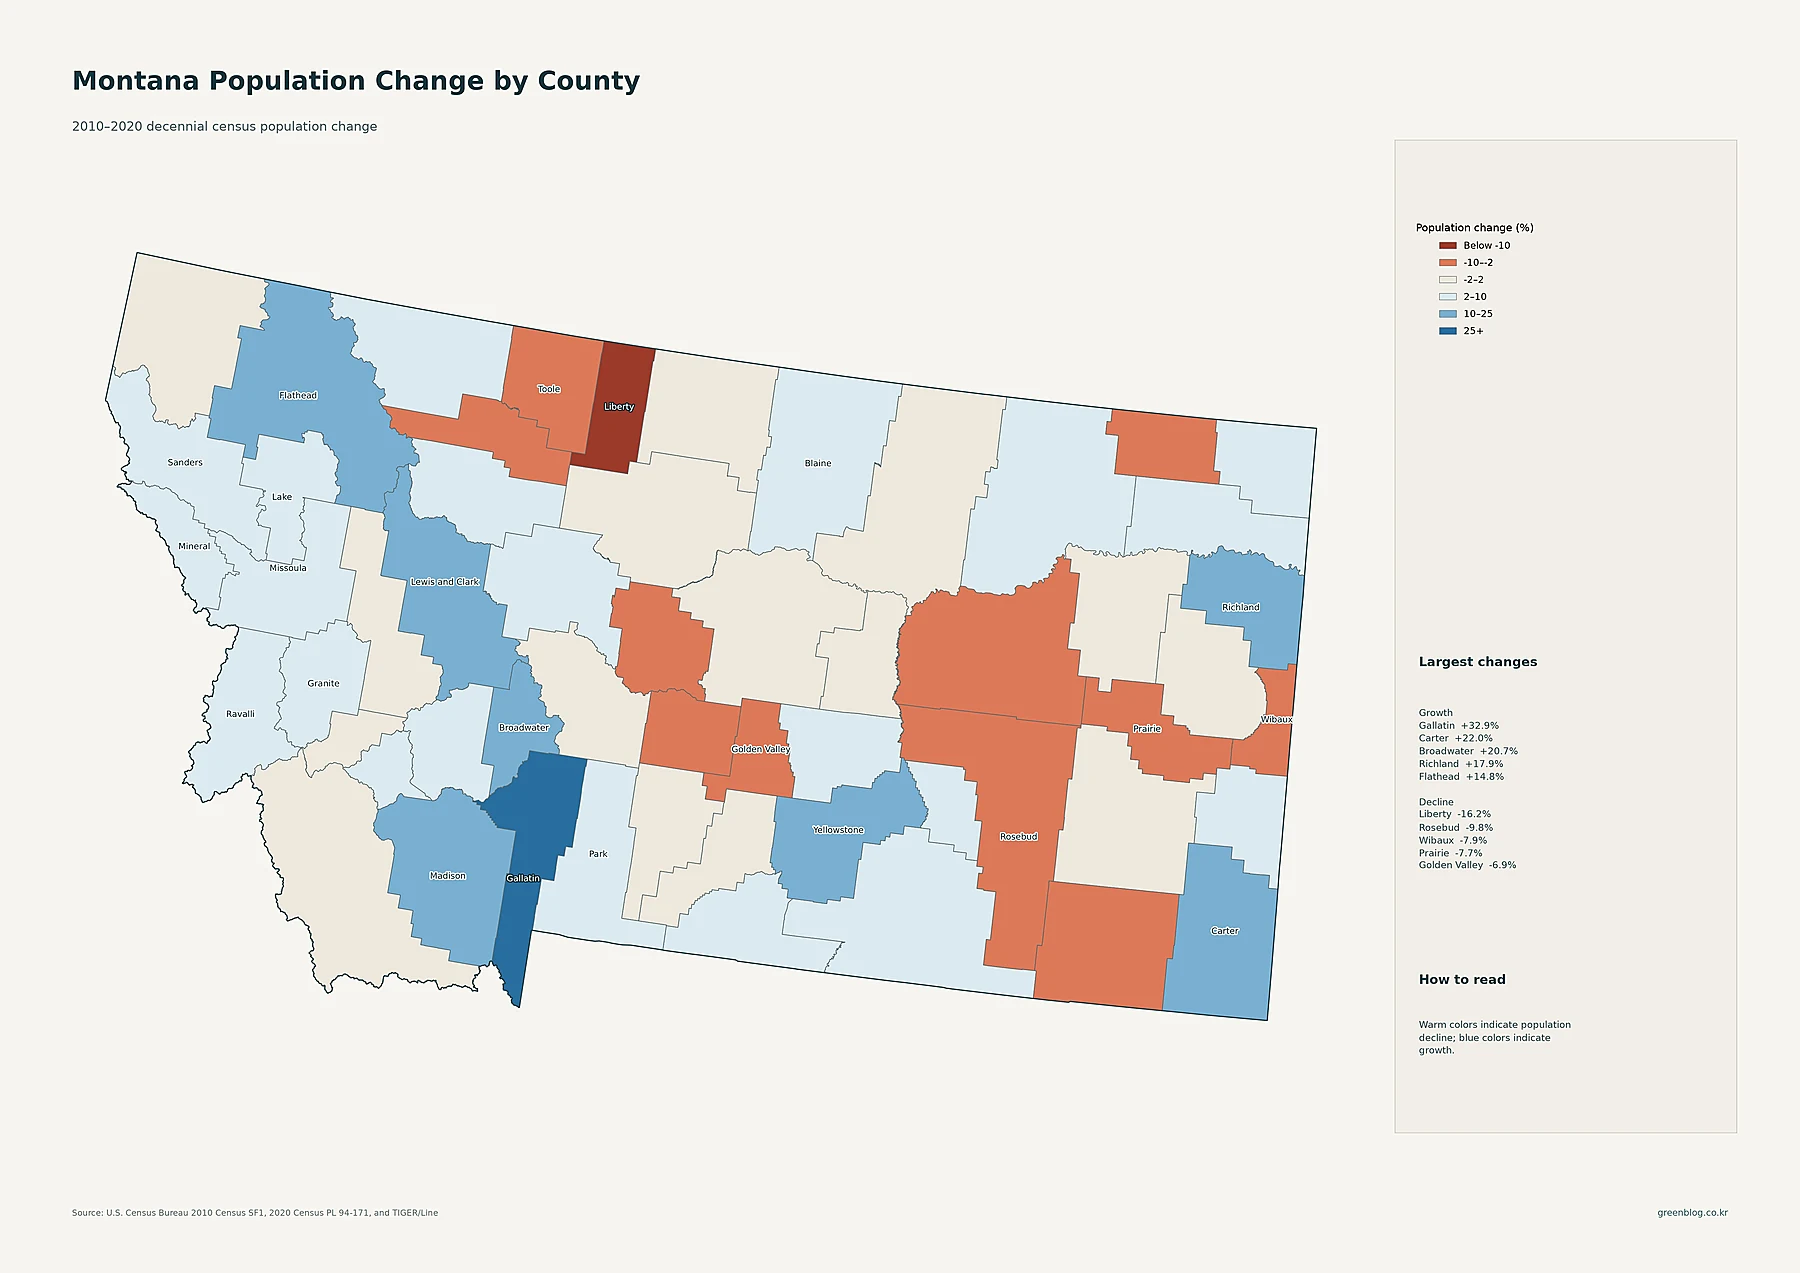
Gallatin County recorded the strongest percentage growth, rising from 89,513 residents in 2010 to 118,960 in 2020, a gain of about 32.9%. It is the clearest county in the 25%+ growth class. Carter County grew about 22.0%, Broadwater 20.7%, Richland 17.9%, and Flathead 14.8%. Lewis and Clark increased about 12.0%, while Yellowstone grew about 11.3%. The pattern shows growth in several separate parts of Montana rather than in one continuous corridor.
Liberty County had the largest percentage decline, from 2,339 residents in 2010 to 1,959 in 2020, or about -16.2%. Rosebud declined about -9.8%, Wibaux -7.9%, Prairie -7.7%, Golden Valley -6.9%, and Toole -6.6%. The map should be read as a rate-of-change map, not a map of current size. A small county can post a large percentage move with a relatively small change in the number of residents, so the change map is most informative when read beside the 2024 total-population map.
The clearest picture of Montana is a network of city clusters separated by vast sparse areas
Taken together, the maps show a settlement pattern that a statewide average cannot capture. Billings is the largest census place and Yellowstone County has both the largest county population and the highest county-average density. Yet the detailed density map also highlights separate clusters around Bozeman, Missoula, Great Falls, Helena, and Kalispell. Between those clusters are enormous areas with very low county and tract densities.
The growth map adds another layer. Gallatin County, home to the Bozeman-area cluster, grew much faster from 2010 to 2020 than Yellowstone County even though Yellowstone remains larger in 2024. Flathead and Broadwater also posted notable gains, while several small counties declined. Separating current population, density, and decade-long change avoids the common mistake of treating “largest,” “densest,” and “fastest-growing” as the same thing.
Download the Montana population map collection
The ZIP includes detailed census-tract density, major cities and urban areas, county population totals, 2010–2020 county population change, and county population density.
FAQ
Which Montana county has the largest population?
Yellowstone County is the largest in the supplied 2024 ACS 5-year estimates, with 168,957 residents. Gallatin has 124,074, Missoula 120,672, and Flathead 110,695.
Is Yellowstone County also the densest county in Montana?
Yes. Its county-average density is about 64.2 people per square mile, the highest in the supplied county data. The tract map still shows much higher densities inside small urban areas because tract-level density is more detailed than a countywide average.
Which Montana county grew fastest between 2010 and 2020?
Gallatin County grew about 32.9%, from 89,513 residents in 2010 to 118,960 in 2020. That percentage comes from the two decennial censuses, not from the 2024 ACS estimate.
Related Maps
Sources
- U.S. Census Bureau — American Community Survey (ACS): 2024 5-year population and density estimates
- U.S. Census Bureau — TIGER/Line Shapefiles: 2024 state, county, census tract, place geography and mapped boundaries
- U.S. Census Bureau — Decennial Census: 2010 and 2020 county population comparison
Green Map creates custom-edited map images using open geographic data sources such as geoBoundaries, Natural Earth, OpenStreetMap, and government open data. These maps are edited visual materials, not raw data files, and are provided for education, documents, presentations, and graphic reference.