Missouri does not have one dominant population core in the middle of the state. Instead, the detailed map shows two major concentrations near opposite borders: the Kansas City region in the west and the St. Louis region in the east. The supplied 2024 ACS 5-year data put Missouri’s population at 6,191,814. The county-density map lists about 68,746 square miles of land and a statewide average near 90 people per square mile. That average is useful as a reference, but it masks a much sharper contrast between the two metropolitan anchors and the broad low-density territory between and around them.
Missouri also requires a small administrative distinction when reading county statistics. The state has 114 counties, while the independent City of St. Louis is treated as a county equivalent in Census geography. As a result, St. Louis County and St. Louis city appear separately in the supplied county-level data. St. Louis County has the largest current population, but St. Louis city has the highest average density. Neither leads the 2010–2020 growth ranking; that distinction belongs to Platte County on the Kansas City side of the state.
Table of Contents
The tract map reveals two broad urban concentrations on opposite sides of Missouri
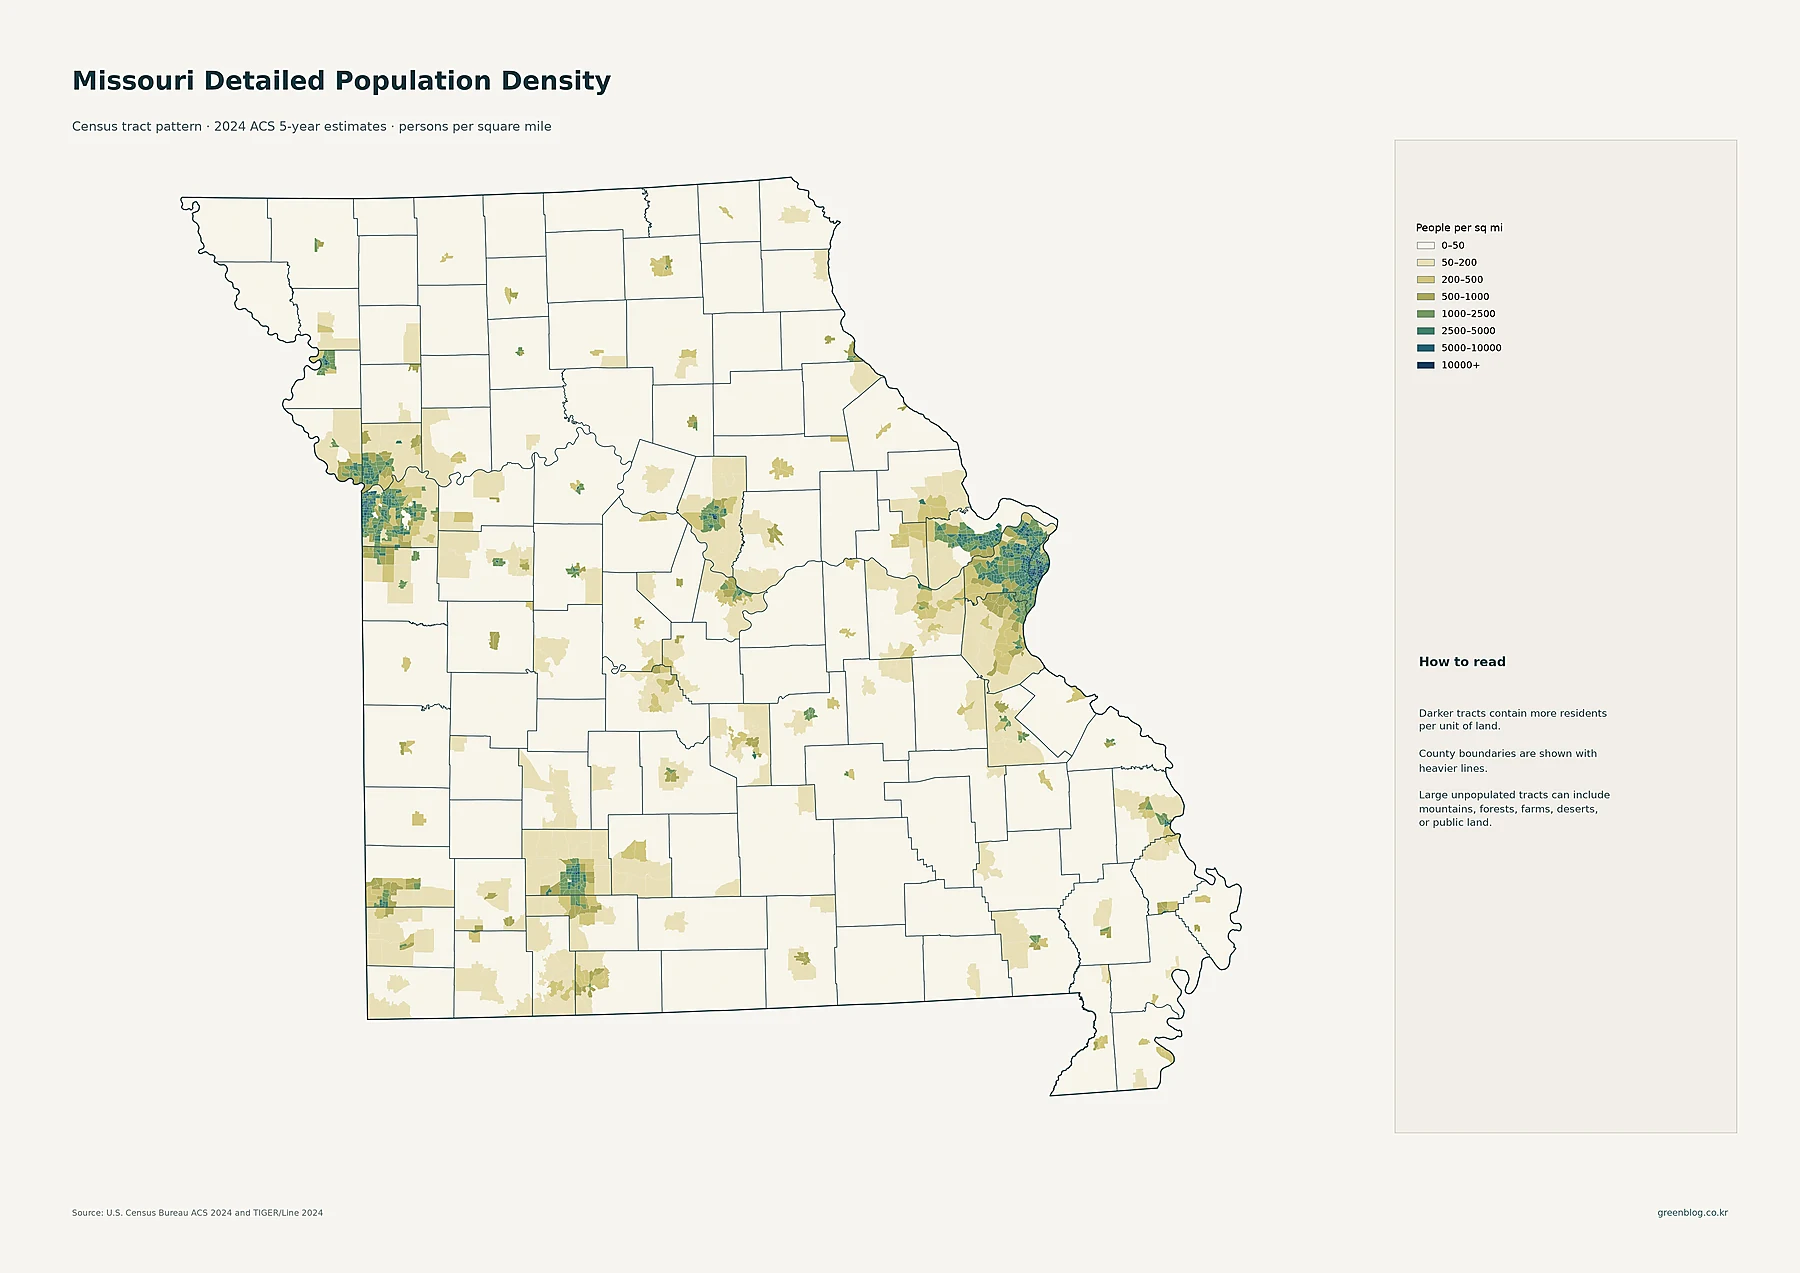
The strongest continuous tract patterns sit at Missouri’s western and eastern edges. Around Kansas City, high-density tracts extend through Jackson County and into Clay and Platte counties, with additional urbanized areas around Independence, Lee’s Summit, and Blue Springs. On the eastern side, St. Louis city forms the darkest core and denser tracts spread through St. Louis County toward St. Charles County. The tract view is valuable because it does not assign one average value to an entire county; it shows where settlement is actually concentrated inside county boundaries.
Several smaller regional centers stand out beyond those two metros. Springfield creates a clear concentration in southwest Missouri, Columbia forms another in the center, and St. Joseph appears along the northwest border. Joplin is visible in the far southwest, Jefferson City appears near the center of the state, and Cape Girardeau provides a smaller southeastern focus. Large parts of northern, south-central, and southeastern Missouri remain in lighter tract classes, so the state reads as a network of localized population clusters rather than a uniformly settled landscape.
Kansas City is the largest census place, while the St. Louis side contains a dense cluster of large suburbs
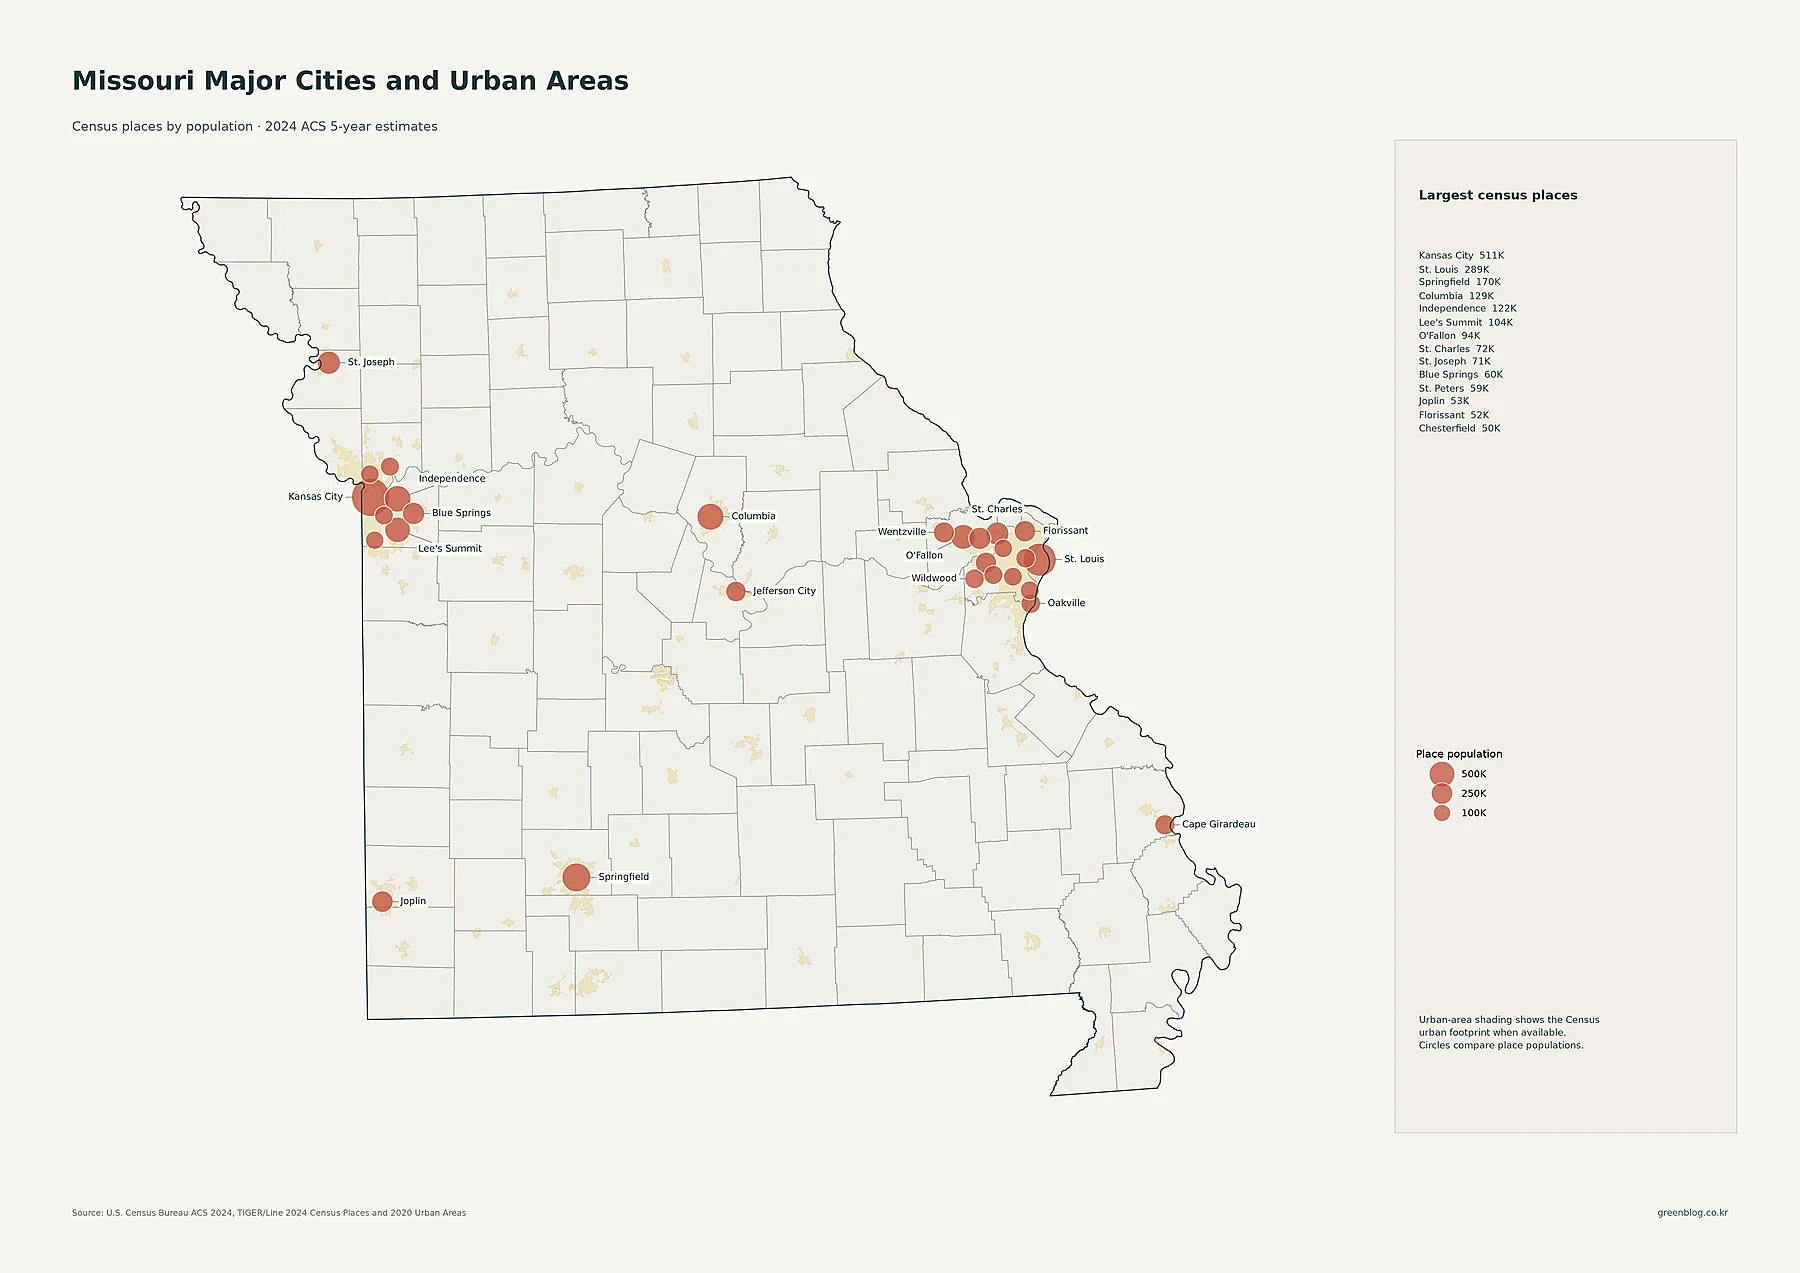
Kansas City is the largest census place in the supplied data with 510,612 residents. St. Louis has 288,512, Springfield 169,954, Columbia 128,548, Independence 121,740, and Lee’s Summit 103,656. O’Fallon has 93,801 residents, followed by St. Charles at 71,508 and St. Joseph at 71,236. Blue Springs has 59,965, St. Peters 59,092, Joplin 52,593, Florissant 51,773, Chesterfield 49,574, and Wentzville 47,061.
The pattern of circles matters as much as their individual sizes. Kansas City is accompanied by Independence, Lee’s Summit, and Blue Springs in a compact western cluster. The St. Louis side has an even denser set of nearby municipalities, including O’Fallon, St. Charles, St. Peters, Florissant, Chesterfield, and Wentzville. Springfield and Columbia appear more isolated from similarly large places and therefore function visually as distinct regional centers. Circle size represents total place population, so this map should not be read as a direct density ranking.
St. Louis County leads total population, but Jackson and St. Charles also form very large county-level totals
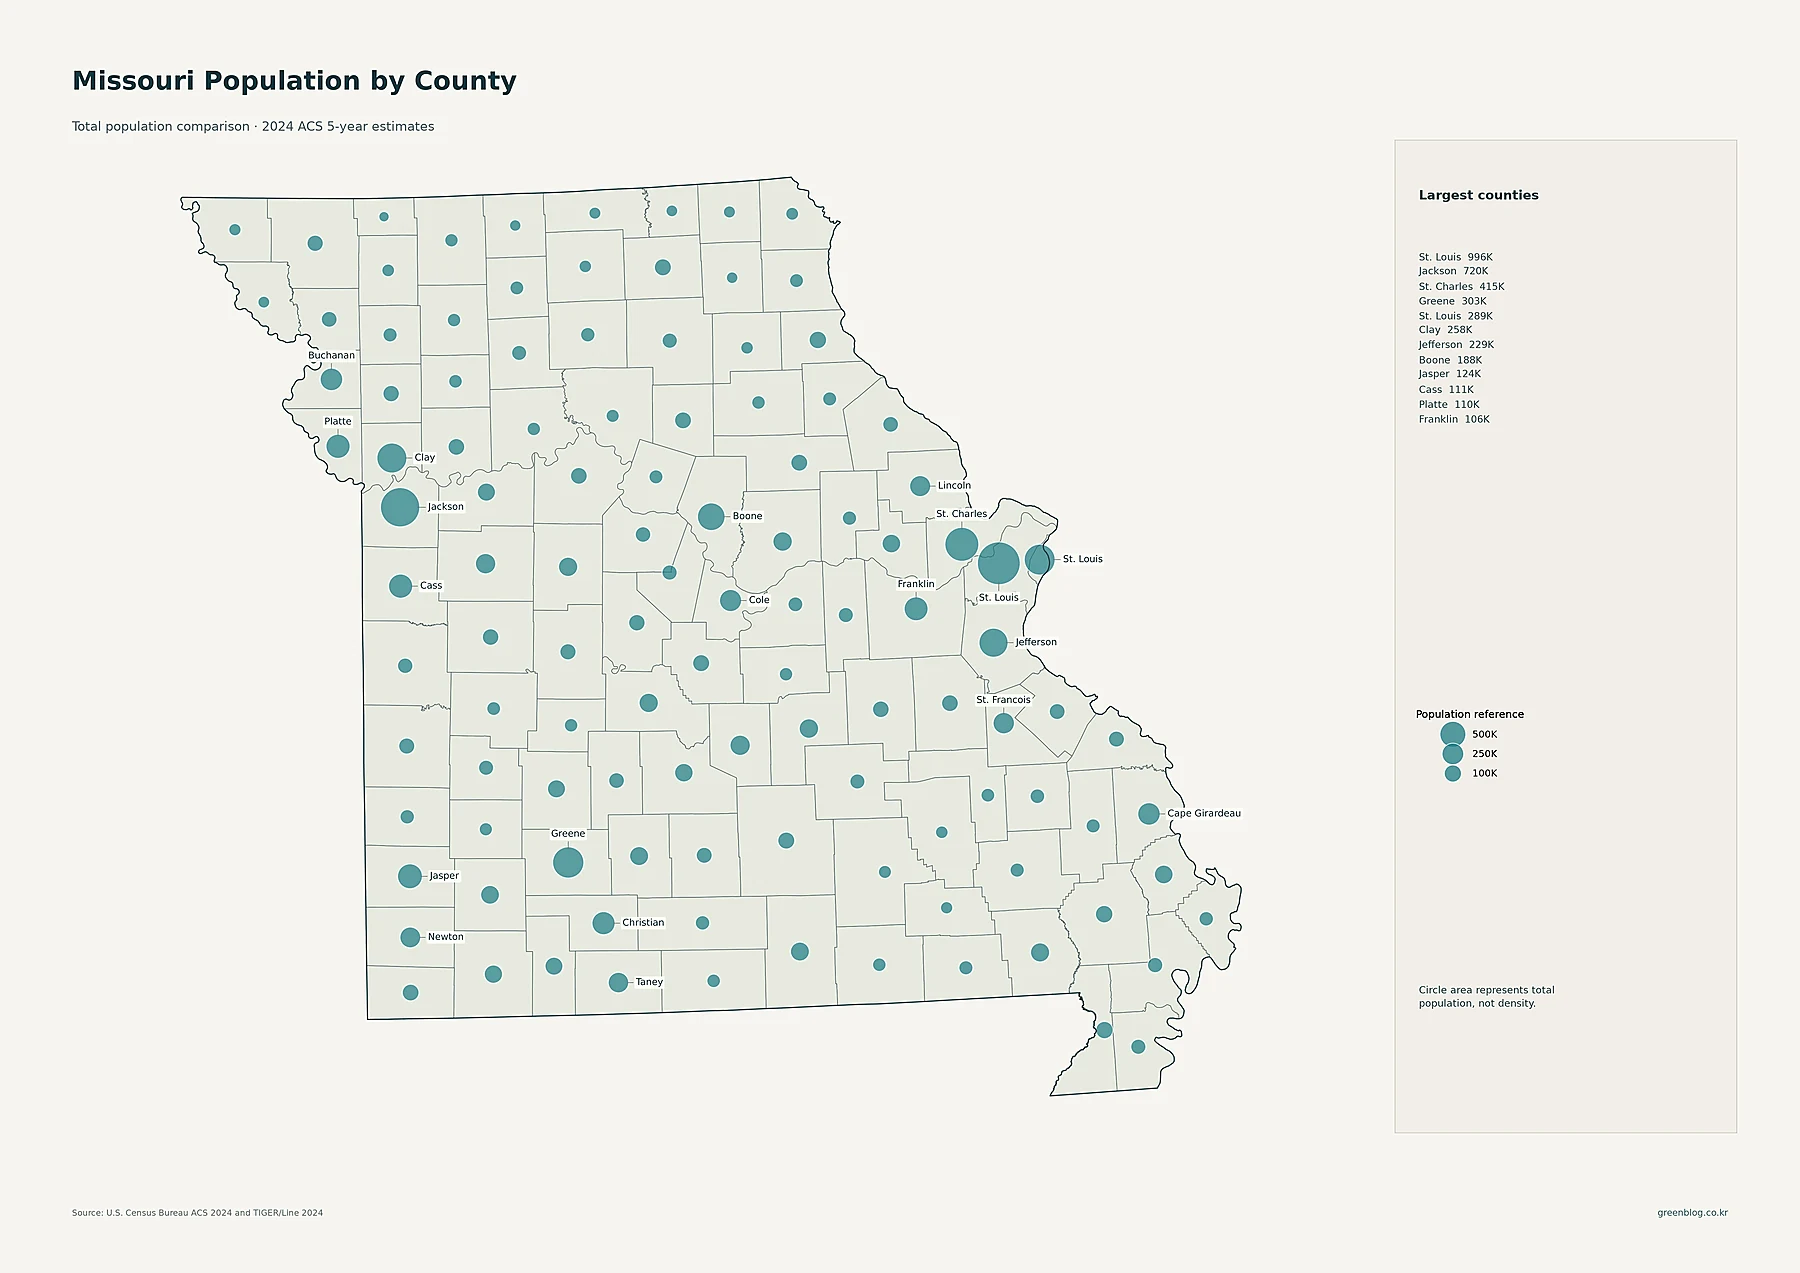
St. Louis County has 995,569 residents, the largest county-level total in Missouri. Jackson County follows with 719,976, St. Charles County with 414,535, Greene County with 303,375, St. Louis city with 288,512, and Clay County with 258,122. Jefferson County has 229,458 and Boone County 188,043. Jasper County reaches 124,357, while Cass County has 110,773. The largest circles therefore cluster around both major metropolitan regions, with additional sizable circles around Springfield and Columbia.
The separate St. Louis entries are a useful reminder that population totals and density can tell different stories even within the same metro. St. Louis County has well over three times the population of St. Louis city, yet the city covers far less land. The county map is designed to answer “how many people live in each county-level area?” It cannot by itself tell whether those residents are spread across a large territory or packed into a small one. The shaded density map provides that second piece.
St. Louis city is Missouri’s density outlier, with St. Louis County and Jackson forming the next tier
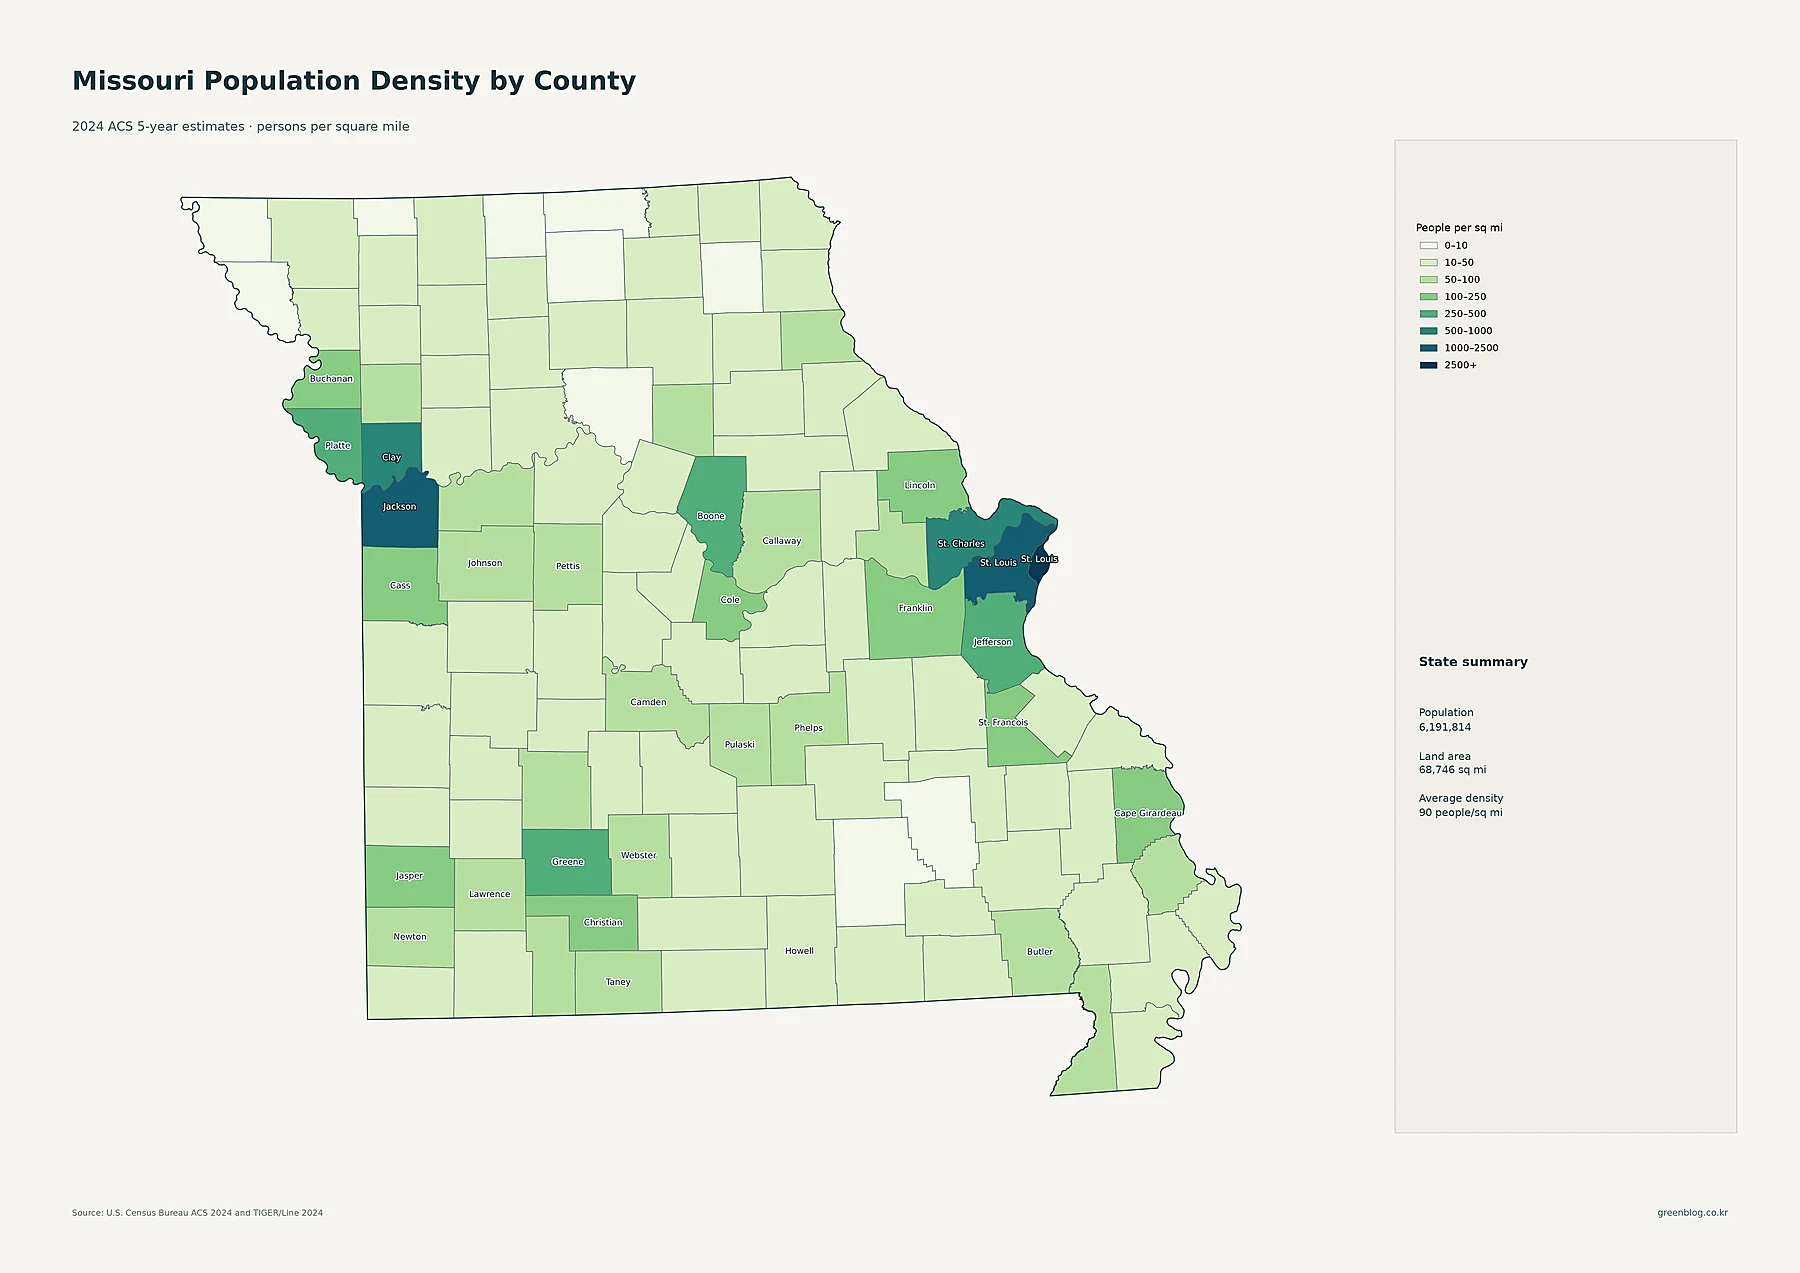
St. Louis city averages about 4,675 people per square mile, placing it alone in the map’s 2,500+ class. St. Louis County averages about 1,960 and Jackson County about 1,191. St. Charles County is around 740, Clay about 649, Greene about 449, Jefferson about 350, Boone about 274, and Platte about 263. These figures reinforce the metropolitan pattern seen in the tract map, while also showing why St. Louis city needs to be distinguished from the much larger surrounding county.
At the other end of the scale, many rural Missouri counties fall below 50 people per square mile, with some close to single-digit density. Lighter classes cover broad sections of the north, south-central Missouri, and parts of the Ozarks and southeast. A statewide average of 90 people per square mile therefore describes neither the St. Louis urban core nor the sparsest counties particularly well. County averages are best used for broad comparison, while tract-level density is better for understanding the shape of settlement inside each county.
| Measure | Standout area | Value in the supplied data |
|---|---|---|
| State population | Missouri | 6,191,814 |
| Largest county-level population | St. Louis County | 995,569 |
| Highest county-level density | St. Louis city | about 4,675/sq mi |
| Fastest 2010–2020 growth | Platte County | +19.5% |
| Largest 2010–2020 decline | Ripley County | -24.3% |
Platte led 2010–2020 growth, while several southeastern counties recorded sharp declines
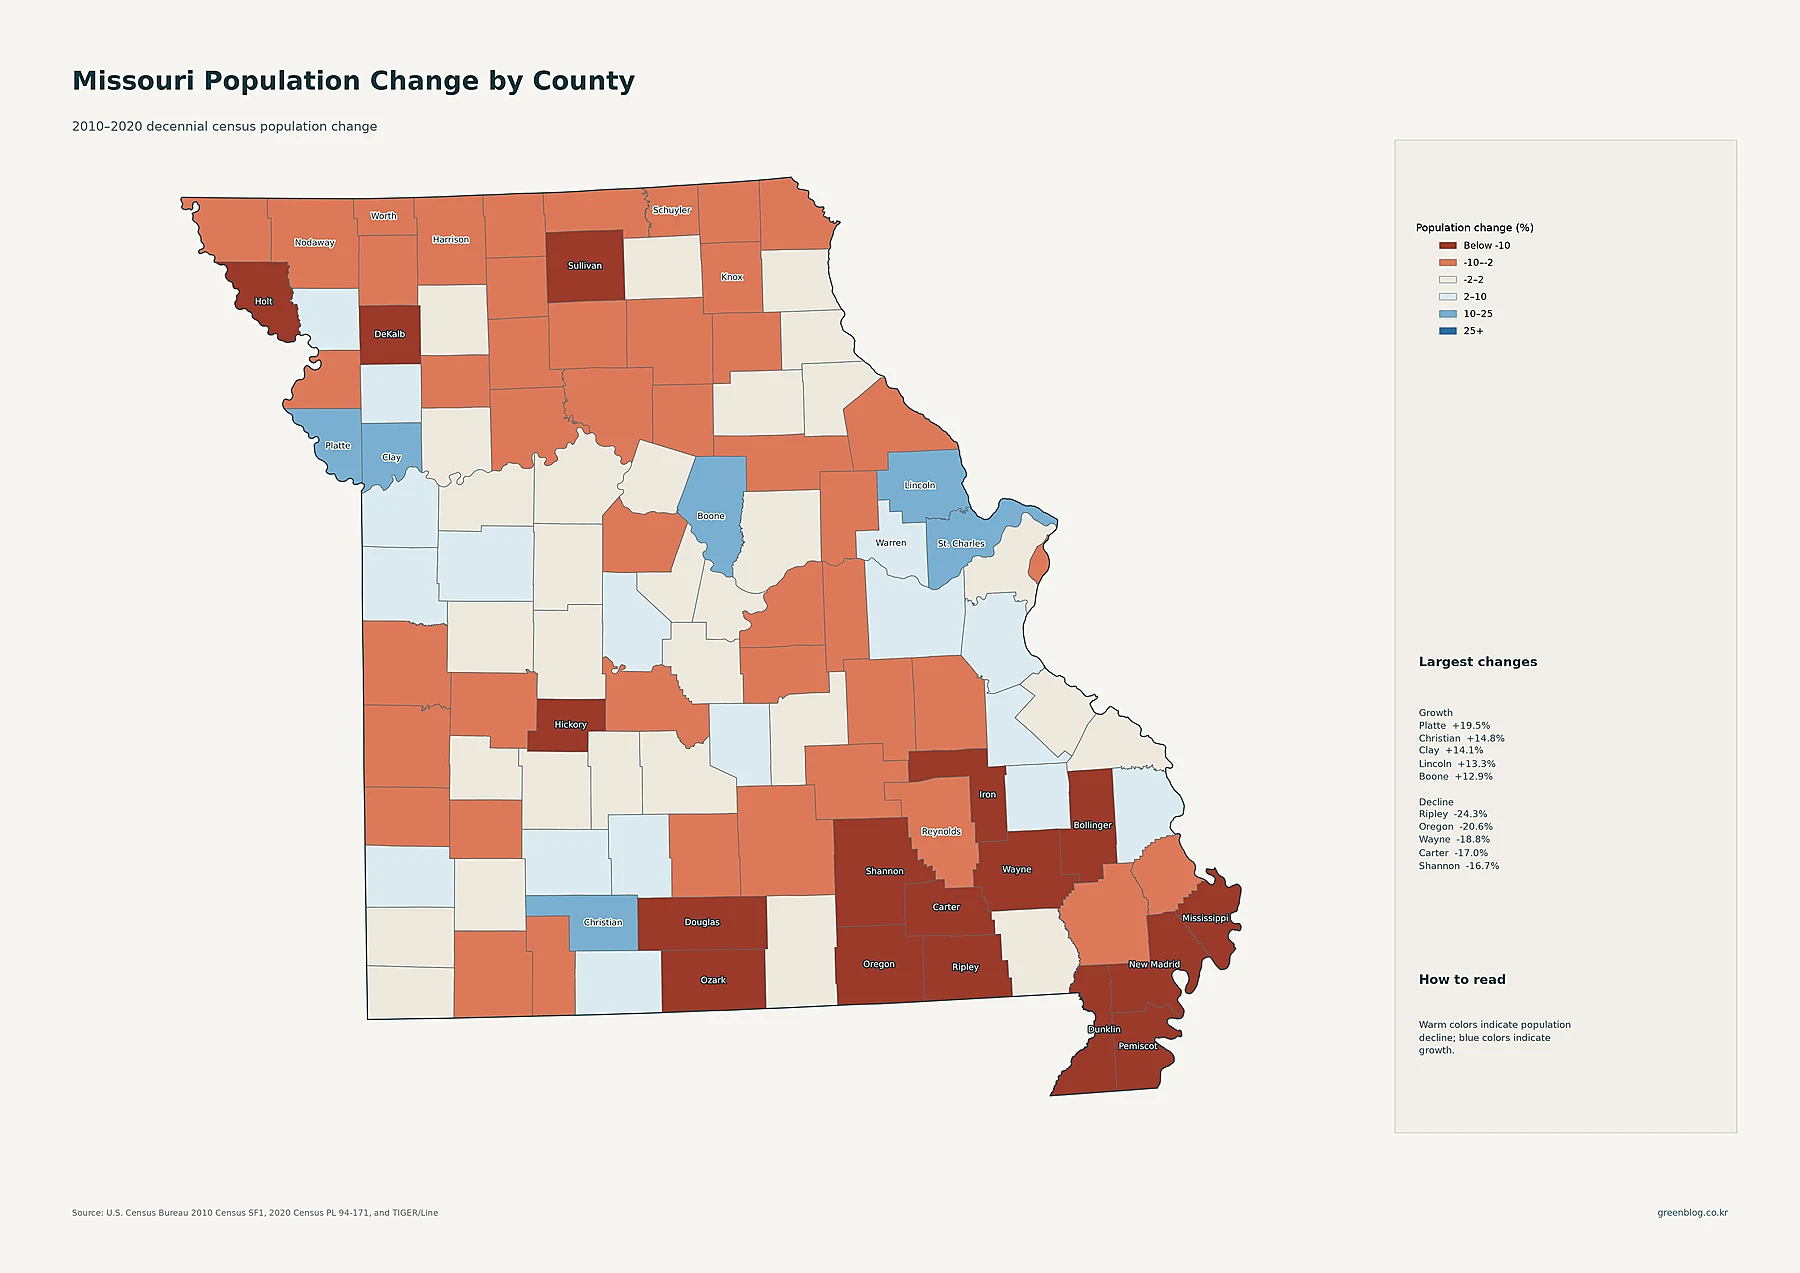
Platte County grew from 89,322 residents in 2010 to 106,718 in 2020, an increase of about 19.5%, the highest percentage in the supplied county data. Christian County grew 14.8%, Clay 14.1%, Lincoln 13.3%, Boone 12.9%, and St. Charles 12.4%. The blue areas are not concentrated in one single corridor: they appear north of Kansas City, around Columbia, along the expanding St. Louis side, and south of Springfield. The map is measuring change over the decade, not the size of the 2024 population.
Ripley County shows the largest decline, falling from 14,100 residents in 2010 to 10,679 in 2020, or about -24.3%. Oregon County declined 20.6%, Wayne 18.8%, Carter 17.0%, Shannon 16.7%, and Douglas 15.4%. Several of the darkest warm-colored counties are grouped in southern and southeastern Missouri, while additional declining counties are scattered across the north. These percentages establish the direction and magnitude of change, but they do not identify causes; explaining migration, births and deaths, employment, or housing trends would require separate evidence.
Missouri’s population pattern makes more sense when size, density, and change are kept separate
Taken together, the maps show a state organized around two large metropolitan anchors rather than one central core. Kansas City and its suburban municipalities dominate the western side, while St. Louis city and a broad ring of large suburbs dominate the east. Springfield and Columbia provide substantial inland centers, with St. Joseph, Joplin, Jefferson City, and Cape Girardeau forming smaller regional concentrations. Between these nodes, many counties remain lightly settled relative to the metropolitan edges.
The rankings make the distinction especially clear. St. Louis County is the largest county-level area by current population, St. Louis city is the densest, and Platte County posted the fastest 2010–2020 growth. Kansas City is the largest census place, but Jackson County still has fewer residents than St. Louis County. None of those statements conflicts with the others because each map measures a different property. Reading the five views in sequence provides a much better picture of Missouri than relying on a single statewide density average.
Download the Missouri population map collection
The ZIP collection includes detailed census-tract density, major cities and urban areas, county-level population totals, 2010–2020 population change, and county-level population density.
FAQ
Which Missouri county has the largest population?
St. Louis County is largest in the supplied 2024 ACS data with 995,569 residents. Jackson County follows with 719,976 and St. Charles County with 414,535. St. Louis city is counted separately as a county equivalent.
Is St. Louis County also the densest county-level area in Missouri?
No. St. Louis city has the highest average density at about 4,675 people per square mile, compared with about 1,960 in St. Louis County. Total population and density answer different questions.
Which Missouri county grew fastest from 2010 to 2020?
Platte County had the largest percentage increase at about 19.5%. Christian County was next at 14.8%, followed by Clay County at 14.1%. These rates compare the 2010 and 2020 decennial censuses.
Related Maps
Sources
- U.S. Census Bureau — American Community Survey (ACS): 2024 5-year population and density estimates
- U.S. Census Bureau — TIGER/Line Shapefiles: 2024 state, county, census tract, place geography and mapped boundaries
- U.S. Census Bureau — Decennial Census: 2010 and 2020 county population comparison
Green Map creates custom-edited map images using open geographic data sources such as geoBoundaries, Natural Earth, OpenStreetMap, and government open data. These maps are edited visual materials, not raw data files, and are provided for education, documents, presentations, and graphic reference.