The Huntington County Indiana Land Cover Map set shows where agriculture, developed land, forest, wetlands, and water appear across the county in 2025. Agriculture dominates at 72.82%, yet the large built area around Huntington and the water-and-forest corridor east of the city create strong local contrasts inside that farm landscape.
Four views are included on this page: general land cover, forest and farmland, impervious surface and developed land, and mapped class differences from 1985 to 2025. After reviewing the WebP maps online, readers can download one ZIP containing all four original JPG maps for printing, lessons, presentations, or county comparisons.
Table of Contents
A mostly agricultural county with a clear urban center and prominent water corridors
The 2025 county summary identifies agriculture as the dominant cover at 72.82%. Forest accounts for 12.59%, developed land 11.49%, water 1.36%, and wetlands 1.06%. The forest-and-farmland view also reports shrubland at 0.36% and grassland at 0.08%. Those percentages describe the county as a whole, but the map makes clear that the categories are not spread evenly from one edge to the other.
Huntington forms the largest developed area near the center of the county. Red developed cover is concentrated there, with thinner road-related traces and smaller built patches continuing into surrounding rural areas. Outside the city, yellow agricultural cover quickly becomes dominant again. This makes Huntington an easy reference point when moving between the four maps because the same central location changes appearance depending on which land-cover question is being emphasized.
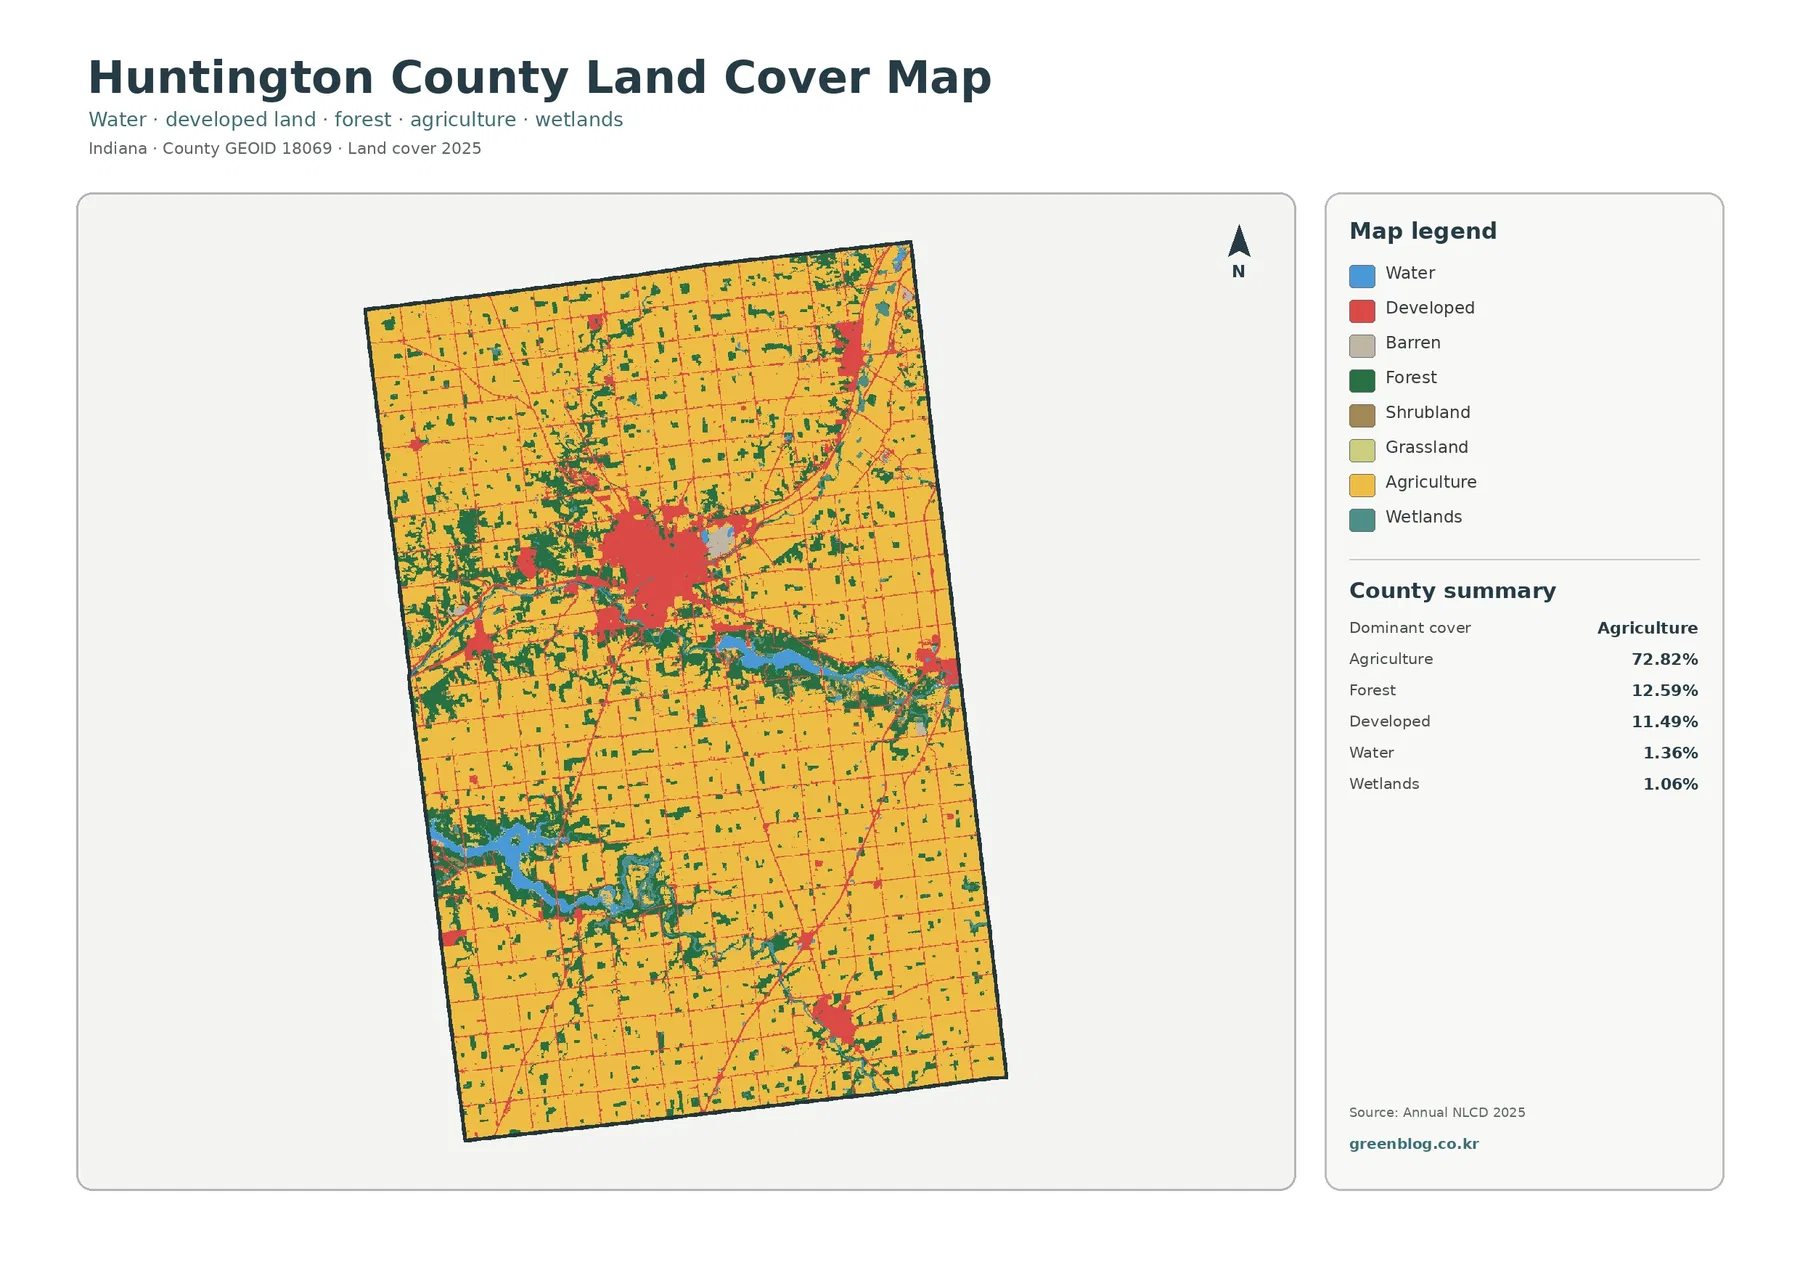
Broad fields occupy much of the north and south, while green forest patches are more frequent along drainage corridors and around larger water bodies. Several blue areas interrupt the farm matrix, especially near the Wabash River system and farther west and southwest. Because this map groups several land-cover classes together, it is the best starting point for understanding the county before examining forest, pavement, or change in more detail.
Land cover should not be confused with zoning or property ownership. Annual NLCD classifies what the ground surface is covered by at the scale of raster cells. A cell classified as agriculture does not define a farm parcel, and developed land can include lawns, trees, and other permeable surfaces. Legal land use, parcel boundaries, and building permissions require current county planning and property records rather than this map.
Huntington stands out even more when pavement and rooftops are isolated
Impervious surface means hard cover such as pavement, parking areas, and rooftops that does not readily absorb rainfall. Huntington County has a 2025 mean impervious value of 3.87%, while 1.98% of the county is mapped above 50% impervious. Developed land covers 11.49%, so the two figures should not be treated as interchangeable. Developed classes can contain a mixture of hard surfaces and vegetated ground.
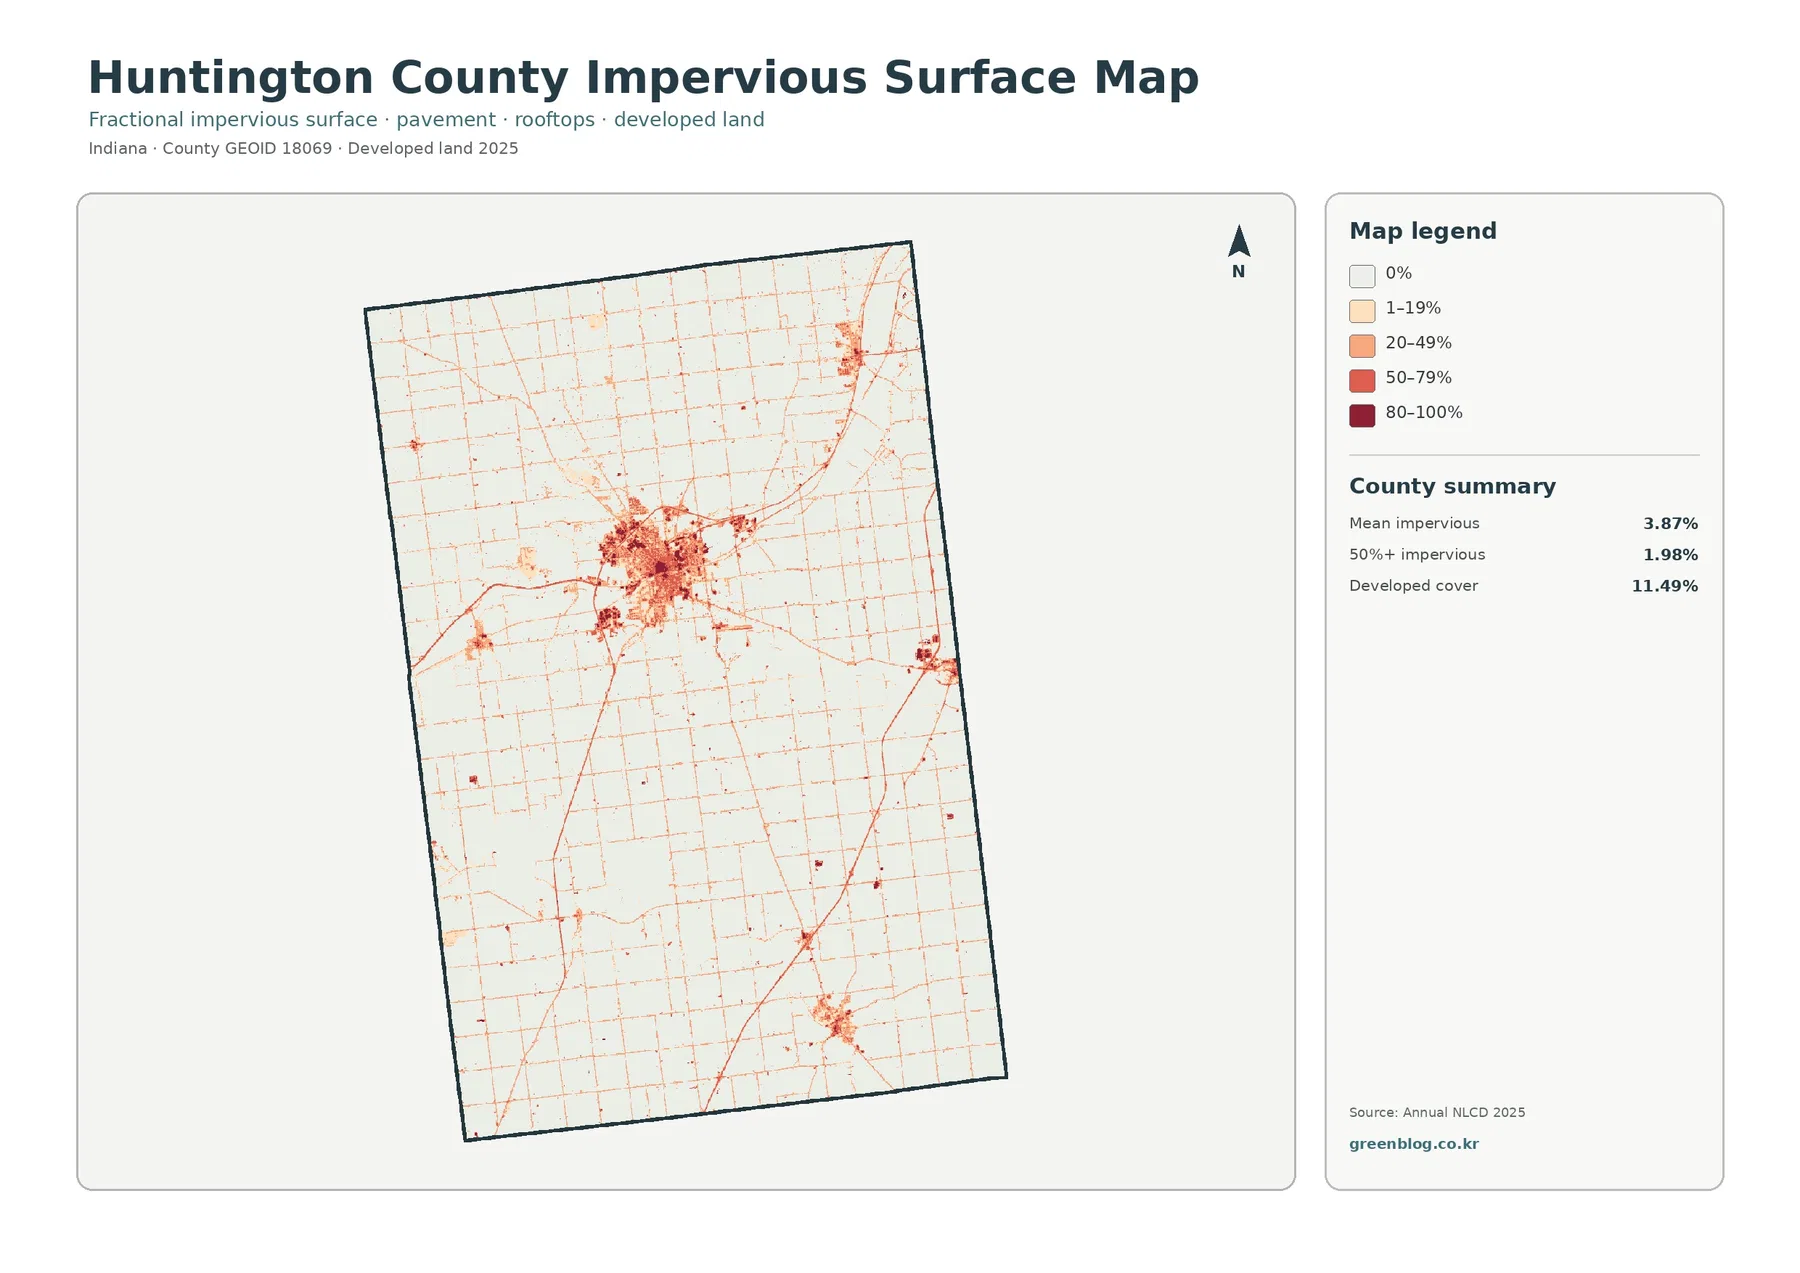
The center of Huntington contains the darkest and most continuous impervious values. Moving outward, those values break into thinner lines along roads and smaller pockets around other communities. Most of the agricultural interior remains very light. Compared with the general land-cover map, this version separates the idea of a developed setting from the amount of hard surface inside that setting.
This map can be useful for comparing settlement form, but it does not by itself identify flood risk. Runoff depends on terrain, soil, drainage systems, stream levels, and rainfall in addition to pavement. A darker impervious value is evidence of more hard surface, not proof that a location will flood. Water-management questions should be checked against hydrologic, drainage, and floodplain sources.
For a presentation, placing the general map beside the impervious map makes the 11.49% developed share and the 3.87% mean impervious value easier to explain. One map shows the broader developed land-cover classes; the other emphasizes hard surface intensity. Huntington is prominent on both, while rural roads become more visible in the impervious view than they are in the general cover classification.
J.E. Roush Lake and the Wabash River add a long water-and-forest feature east of Huntington
One of the most recognizable natural features is the elongated water corridor east of Huntington. Indiana DNR describes J.E. Roush Lake Fish & Wildlife Area as a long, narrow property extending roughly 15 miles along the Wabash River. The property includes about 900 acres of lake, 7,347 acres of land, and 350 acres of impoundments, which helps explain why water, forest, and wetland cover are visually important even though they occupy much less area than agriculture countywide.
J.E. Roush Lake is also called Huntington Lake. DNR notes that it was built in 1967 and operates with other Upper Wabash Valley lakes for flood-control purposes. The land-cover maps do not show dam operations or flood depths, but they do provide a useful visual context for seeing where the water body and neighboring vegetated cover sit relative to Huntington and the surrounding farm landscape.
Other blue and green areas occur in the western and southwestern part of the county map. Indiana DNR also manages Salamonie Lake property from an address near Andrews and describes that broader property as including a large lake, ponds, marshes, wetlands, fields, and woodland. The map itself does not label every water polygon, so individual blue shapes should be matched to an official property or hydrography map before assigning a specific lake name.
Water is only 1.36% of the 2025 county summary and wetlands are 1.06%, yet both categories can be visually prominent where they are concentrated. A small percentage spread along a long river or reservoir can have a stronger geographic presence than the number alone suggests. This is one reason the map should be read for both area share and location.
Removing most developed colors makes the 72.82% farm cover easier to compare with forest
The forest-and-farmland map simplifies the county by emphasizing agriculture, forest, wetlands, water, shrub and grass classes. Agriculture remains the broad background at 72.82%, while forest at 12.59% appears as scattered patches and longer areas near streams and water bodies. The developed center of Huntington is left much lighter, making the edge between the city and surrounding farmland easier to see.
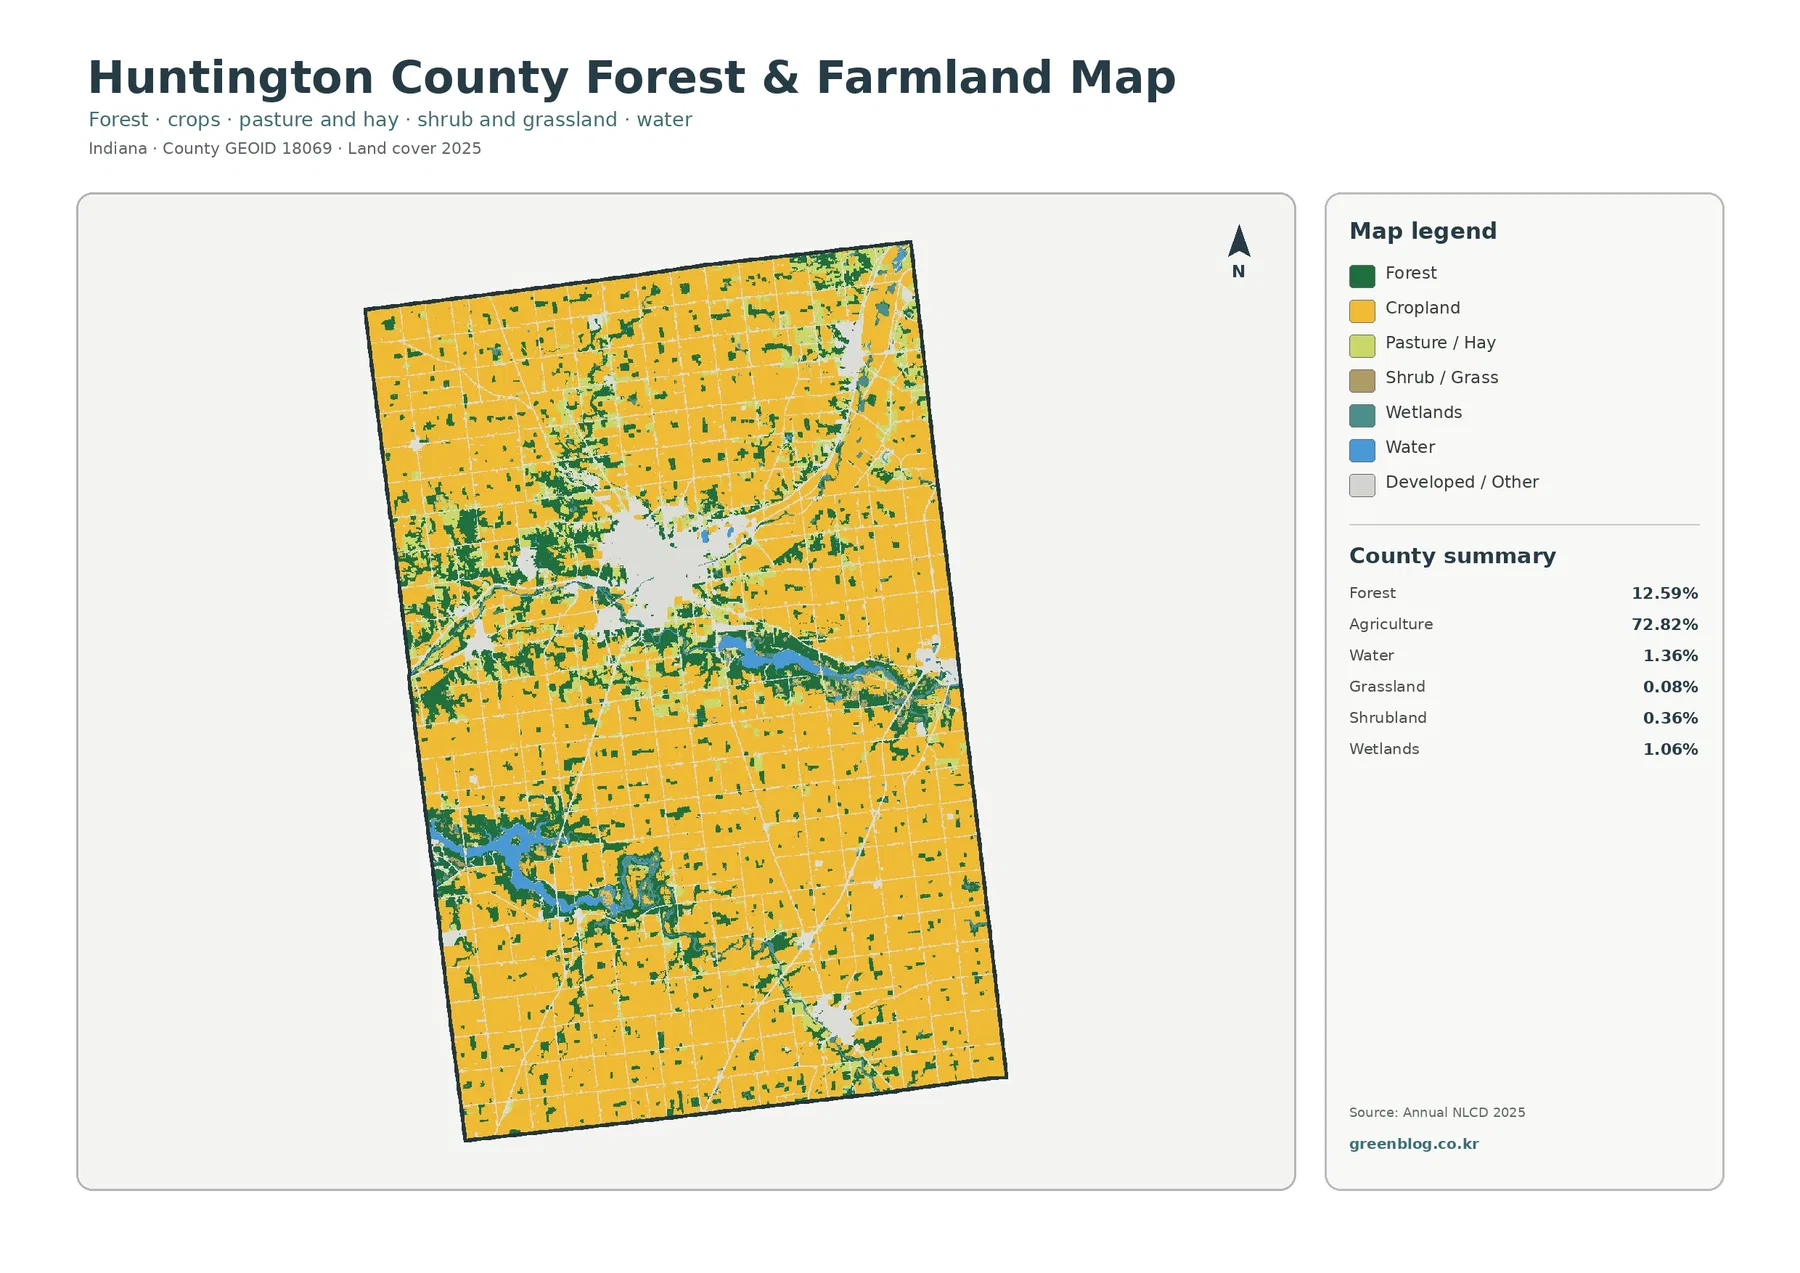
Large uninterrupted agricultural areas dominate many outer parts of the county. Forest is less uniform. Some wooded cover forms small isolated blocks inside the farm grid, while other areas follow water and drainage features for longer distances. This distinction is useful in environmental education because it shows that the same total forest percentage can occur in very different shapes and positions.
Purdue Extension Huntington County maintains an Agriculture & Natural Resources program that covers farming, forestry, water quality, wildlife, and related topics. The map can provide geographic context for those subjects, but it does not identify crop types, farm ownership, timber management status, or production levels. Those questions require agricultural statistics, management records, or field information beyond the land-cover classification.
The 12.59% forest share should be interpreted in the same limited way. Green cells identify tree-dominated surface cover, not public forest boundaries or conservation status. A private woodlot, streamside trees, and managed public woodland can all appear under a forest class. The map is appropriate for county-scale comparison, not for deciding who owns a wooded area or whether it is protected.
The 9.54% mapped class difference from 1985 to 2025 is not a single development rate
The change map compares classifications from 1985 and 2025. The county summary reports a total class difference of 9.54%. Within that total, 1.93% is classified as changed to developed, 0.58% as forest loss, 0.98% as agricultural loss, and 5.98% as other class difference. Wetland difference is also represented in the legend. These categories make it important not to describe the full 9.54% as development.
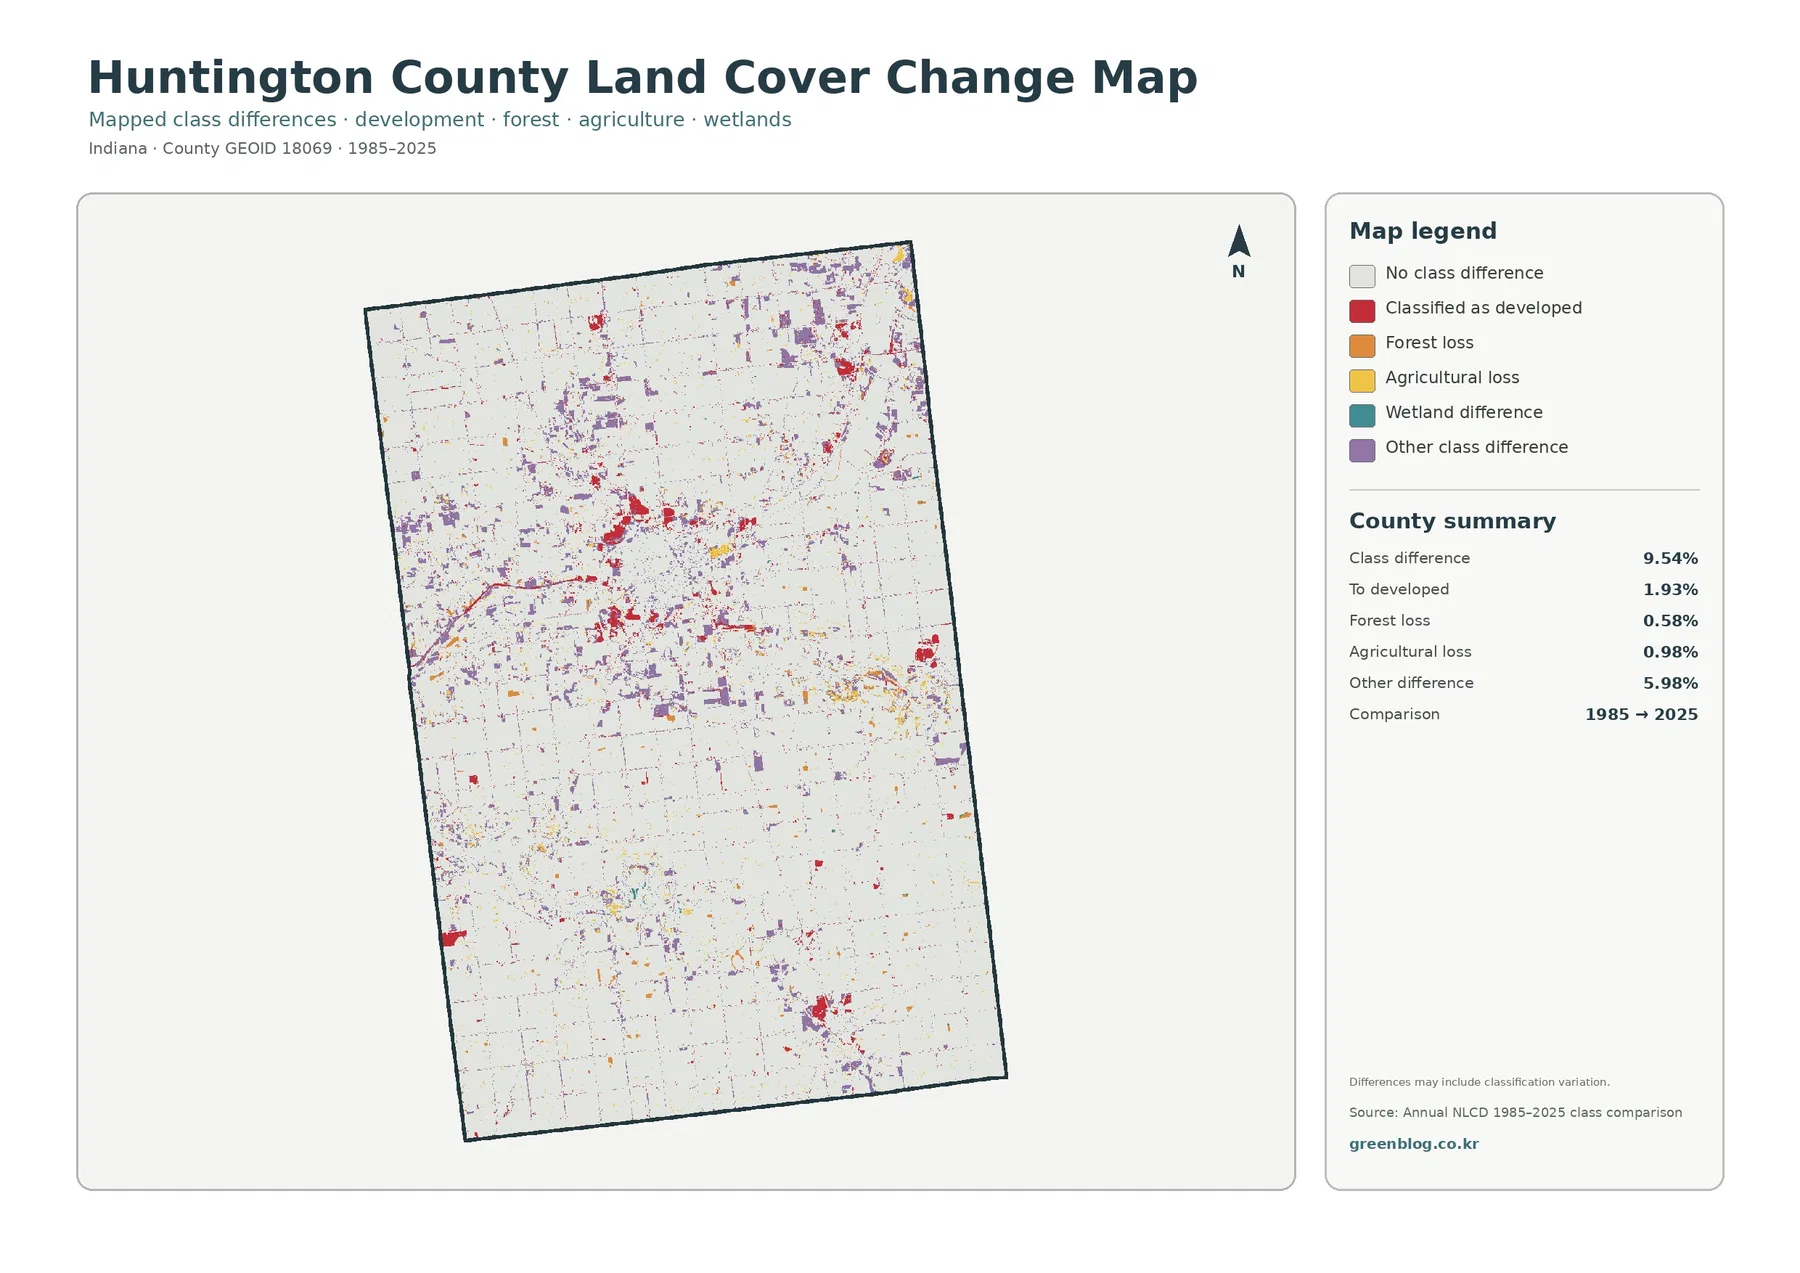
Red areas representing change to developed appear around Huntington and in several smaller built locations, while purple other-class differences are more widely scattered through the agricultural landscape. Orange forest-loss and yellow agricultural-loss areas are more limited. The map therefore shows a mix of change categories rather than one uniform trend extending across the entire county.
This is a comparison between two classified endpoints, not a year-by-year history. It cannot identify the exact year that a field changed, nor can it explain why a classification differed. Raster data divide the landscape into cells, and narrow roads, shorelines, small forest patches, or mixed surfaces can be sensitive to classification details. Some mapped difference may reflect those limitations as well as real land-cover change.
The safest use of the change map is to locate places where the two dates differ and then investigate those locations with other evidence. Aerial imagery, planning documents, permit records, and water-management sources can help answer when or why a change occurred. The land-cover comparison alone should not be used to assign a cause to a red, orange, yellow, or purple area.
A practical reading sequence for the four Huntington County maps
Begin with the general land-cover map and locate Huntington, the long water feature east of the city, and the broad agricultural areas around them. Those landmarks make it easier to orient the other three views. The goal of the first pass is not to study every legend category, but to establish the main county-scale contrasts.
Next, use the impervious map if the question is about built surfaces and roads. Switch to the forest-and-farmland map when the focus is agriculture, wooded cover, wetlands, or water. Because those two maps simplify different parts of the legend, each makes a different county feature easier to see than the general map alone.
Finish with the 1985–2025 comparison. Current developed land should not be assumed to equal mapped change to developed. A place that was already developed in 1985 can remain developed in 2025 without appearing as a red change area. Keeping current condition separate from two-date change prevents one of the most common misreadings of a change map.
For print or presentation use, preserve the original aspect ratio so the legend remains readable. Showing all four maps at the same size makes it easier to compare Huntington, the Wabash water corridor, and rural farmland from one view to the next. In a classroom, the sequence can move from general land cover to forest and agriculture, then impervious surface, and finally change over time.
What these county-scale maps can and cannot tell you
Annual NLCD is raster data, meaning the surface is divided into grid cells and each cell receives a representative class or value. Small ponds, narrow tree lines, roadside vegetation, and places where buildings and lawns mix may be generalized. A mixed pixel contains more than one kind of surface within the area represented by a cell, so a map edge should not be treated as a surveyed parcel boundary.
The date of the data matters as well. The current land-cover and impervious maps are based on 2025 information, while the change map compares 1985 with 2025. Construction, demolition, crop changes, or vegetation changes after the observation year will not appear. Current zoning, development review, parcel status, or flood regulation must be checked with the appropriate local or state source.
Within those limits, Huntington County is a useful example of why four related maps are more informative than a single percentage table. Agriculture covers more than seven-tenths of the county, yet Huntington has a distinct built footprint, forest is noticeably associated with water and drainage features, and the change map highlights places where the two dates differ without implying that every difference has the same cause.
Frequently Asked Questions
Why does Huntington look so large if agriculture covers 72.82% of the county?
Across the entire county, agriculture accounts for 72.82%. Farmland is spread broadly across the rural landscape, while developed cover is concentrated around Huntington, so the city forms one visually strong area. Developed land also accounts for 11.49%, which is large enough to stand out clearly even in a county where agriculture is dominant.
What does the water-and-forest feature east of Huntington represent?
East of Huntington, the map shows a long water corridor with adjacent forest cover. Indiana DNR identifies J.E. Roush Lake, also called Huntington Lake, as a long property along the Wabash River. The land-cover map does not replace an official property, floodplain, or hydrography map, so detailed boundaries should be checked with DNR sources.
Does the 9.54% class difference mean 9.54% of Huntington County was developed after 1985?
No. The 9.54% total combines several categories. The summary lists 1.93% changed to developed, 0.58% forest loss, 0.98% agricultural loss, and 5.98% other class difference, with wetland difference also represented in the legend. The full value is therefore not a development rate.
Map File Information
The ZIP contains four original JPG maps for Huntington County: 2025 land cover, forest and farmland, impervious surface and developed land, and the 1985–2025 land-cover class comparison.
- Printable Size: 2480 × 1754 px each
- File Type: ZIP containing four JPG maps
- Intended Use: printing, reports, lessons, presentations, and county land-cover comparison
Related Maps
- Adams County Indiana Land Cover Map
- Allen County Indiana Land Cover Map
- Bartholomew County Indiana Land Cover Map
Sources and References
- MRLC Annual NLCD Data – official source for Annual NLCD land-cover products
- USGS Annual NLCD Land Cover Classification – classification definitions and dataset context
- U.S. Census Bureau TIGER/Line Shapefiles – official geographic boundary data used for county reference
- Indiana DNR – J.E. Roush Lake Fish & Wildlife Area – information on Huntington Lake, the Wabash River corridor, and managed land and water
- Indiana DNR – Salamonie Lake – information on the lake, ponds, marshes, wetlands, and managed lands near Andrews
- Purdue Extension Huntington County – Agriculture & Natural Resources – county-specific agriculture, forestry, water, and natural-resource information
Green Map creates custom-edited map images using open geographic data sources such as geoBoundaries, Natural Earth, OpenStreetMap, and government open data. These maps are edited visual materials, not raw data files, and are provided for education, documents, presentations, and graphic reference.