An Indiana State Map has a naturally tall layout: Lake Michigan touches the northwest corner, the state extends south through a dense grid of counties, and the Ohio River bends around much of the lower boundary. The three supplied maps use that vertical shape to keep all 92 county areas visible. One version adds pastel color, another retains names in black and white, and the third removes the labels for custom work.
The labeled images show county boundaries rather than roads, cities, terrain, or statistical data. That focused design makes them suitable for county identification, classroom reference, regional comparison, presentation graphics, and document illustrations. The blank outline supports labeling exercises and user-added information without implying that the JPG is a vector or source-editing format.
Indiana borders Michigan, Ohio, Kentucky, and Illinois, while its northwest edge reaches Lake Michigan. The western and southern sides are more irregular where rivers help define the state line, but much of the northern and eastern outline is comparatively straight. Reading those changes on an Indiana State Map provides a useful framework for locating the counties before working with more detailed transportation or demographic resources.
Table of Contents
What the Three County Views Include
Each image uses the same 92-county geometry and a 1200 × 1603 portrait canvas. The color and black-and-white maps contain county names; the outline keeps the boundaries but leaves the interiors blank. Their shared proportions allow a teacher or designer to switch versions without changing the placement of the county shapes.
The maps are prepared for A3 use and distributed as JPG files inside one ZIP archive. On the published page, the previews appear as WEBP images for efficient viewing, but the download information identifies JPG as the working file type. The collection does not include roads, city points, elevation shading, or an editable vector file, so readers who need those layers should combine the outline with a separate verified source.
How to Read an Indiana State Map
County size and boundary shape vary noticeably from north to south. Lake, Porter, and LaPorte counties form the northwestern approach to Lake Michigan. Along the opposite side, Steuben, DeKalb, Allen, Adams, Jay, Randolph, Wayne, Union, and Ohio counties create the eastern edge. These perimeter names offer convenient starting points when learners need to work inward.
Marion County sits near the center and provides a strong visual anchor for the Indianapolis area. Hamilton, Hancock, Shelby, Johnson, Morgan, Hendricks, and Boone surround it, producing a compact ring of boundaries that needs careful label placement. The portrait page gives this central cluster enough room while preserving readable names in narrower counties such as Blackford, Fayette, Ohio, and Union.
The southern outline changes as the Ohio River curves past counties including Posey, Vanderburgh, Warrick, Spencer, Perry, Harrison, Floyd, Clark, Jefferson, Switzerland, and Ohio. Indiana’s western edge also becomes irregular along parts of the Wabash River. Those river-shaped borders distinguish the lower and western counties from the more rectangular pattern visible across much of the north.
Color Separation Across 92 Counties
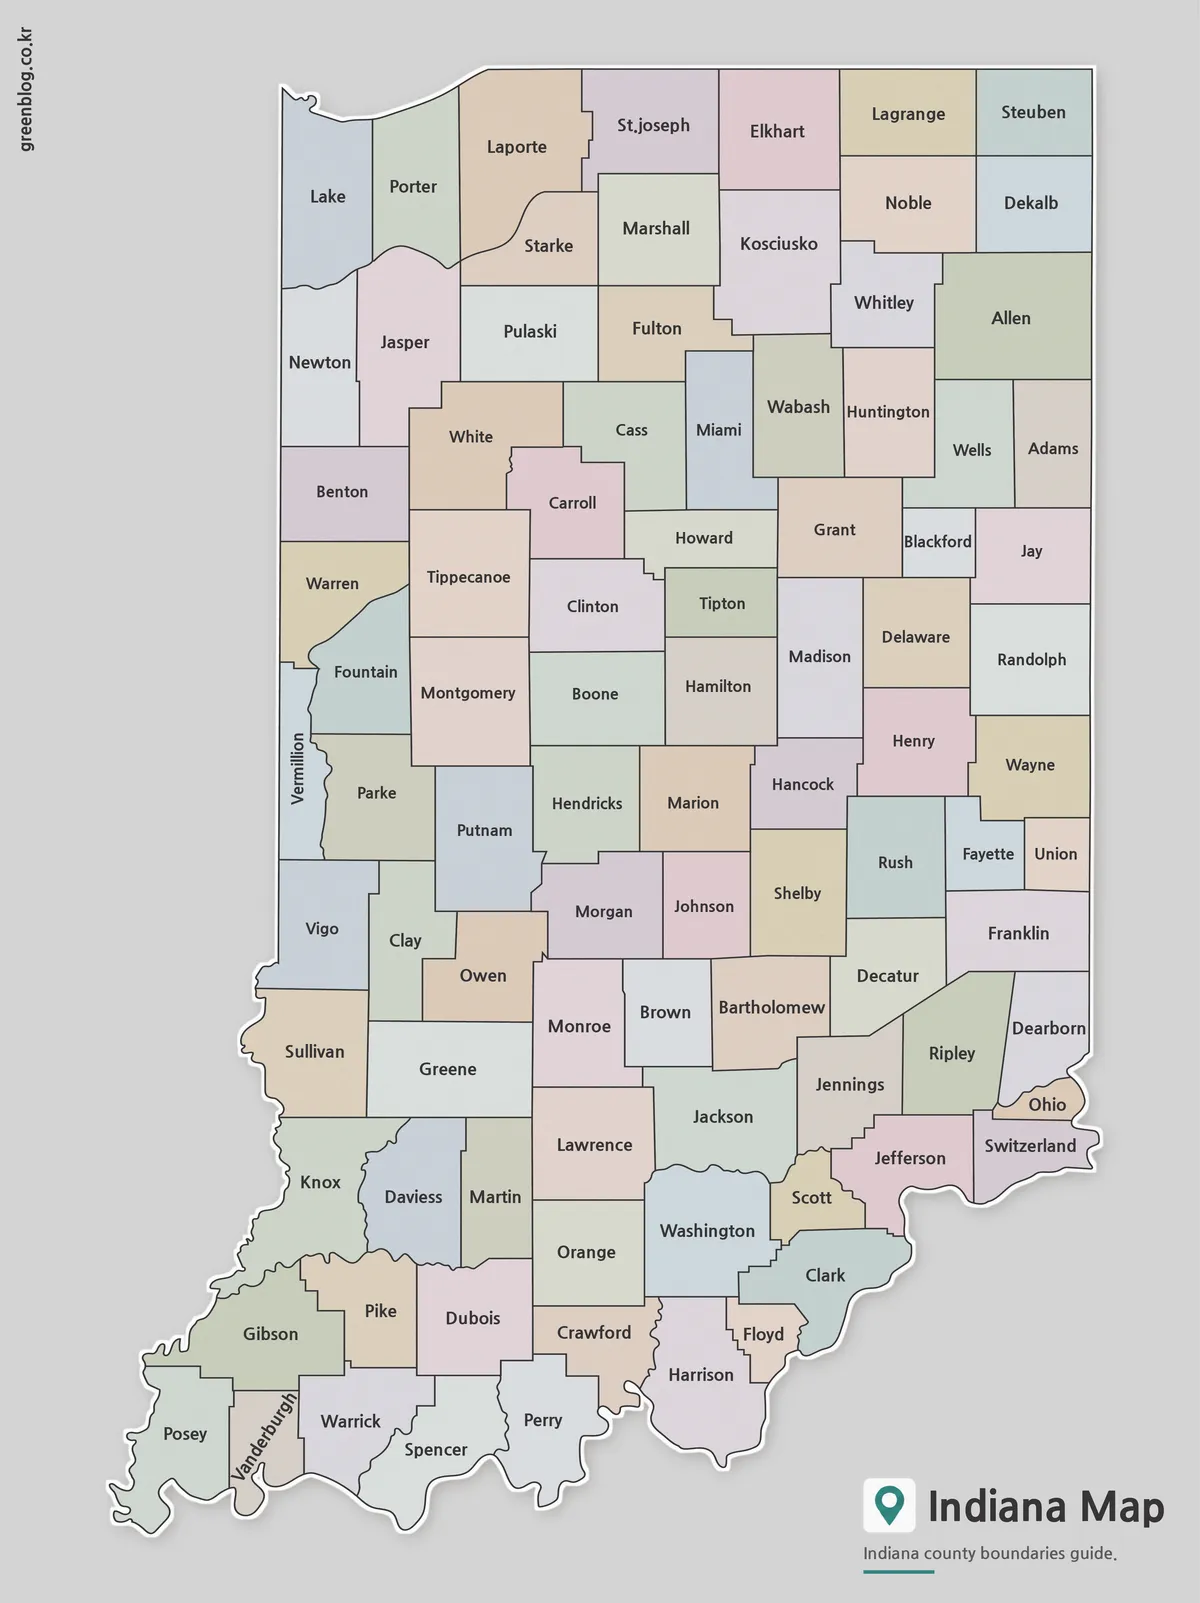
The color Indiana State Map assigns contrasting pastel fills to neighboring counties while keeping the labels dark. The colors are visual separators rather than a legend for population, politics, land use, or economic regions. This distinction matters when the image appears in a presentation: viewers can follow county shapes quickly without mistaking the palette for data.
Color is particularly helpful around the center of the state and across southern Indiana, where several short or irregular boundary segments meet. A presenter can point from Marion County toward surrounding counties or compare the Lake Michigan corner with the Ohio River edge. Because every county remains labeled, this version is the best starting choice when immediate identification matters more than later annotation.
County Names Without Color Fills
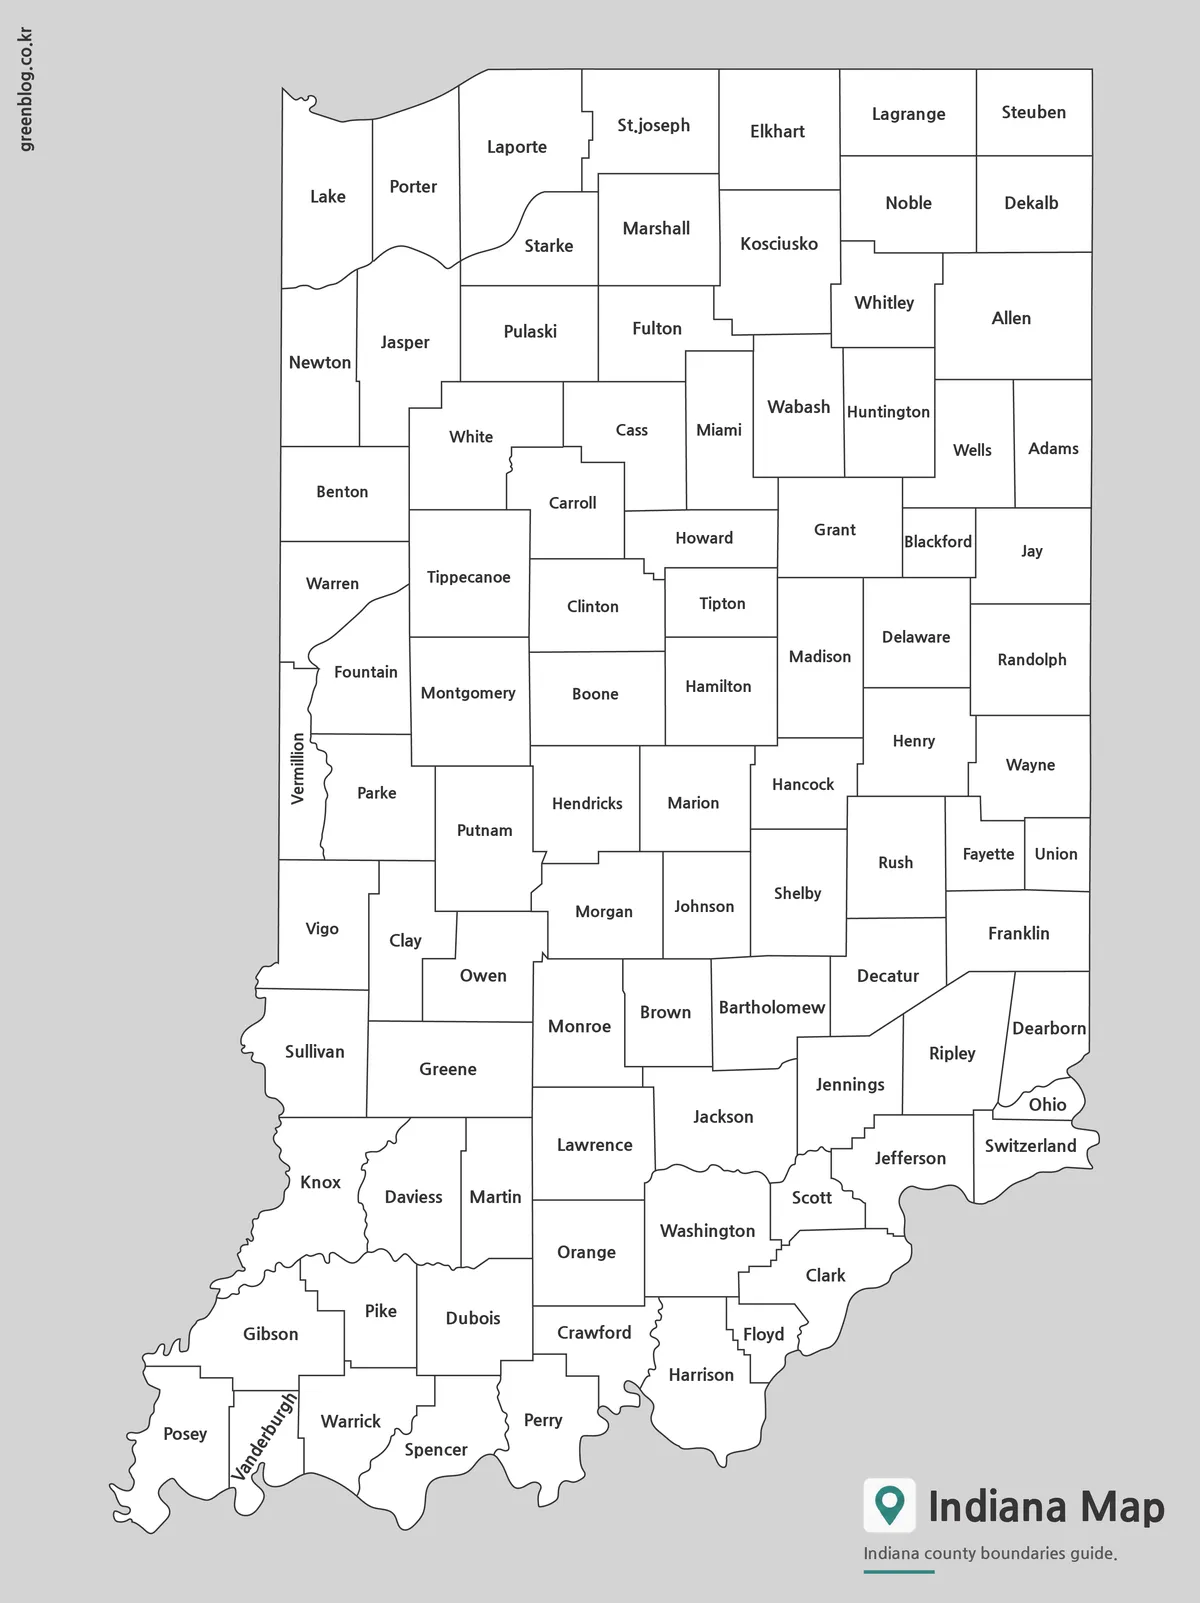
The black-and-white Indiana State Map retains the complete label set while removing the pastel backgrounds. Clear white interiors help the page blend into reports and worksheets, and the dark boundaries remain distinct when reproduced on a monochrome printer. This is the practical labeled option when color is unnecessary or when readers may add a small number of marks by hand.
Teachers can use the map as an answer reference for a separate blank exercise, while researchers can place it beside a table organized by county. The narrow labels along the borders and in compact central counties are already positioned in the image, avoiding the need to typeset 92 names from scratch. Any added symbols should be kept simple so they do not compete with those labels.
A Blank Framework for County Tasks
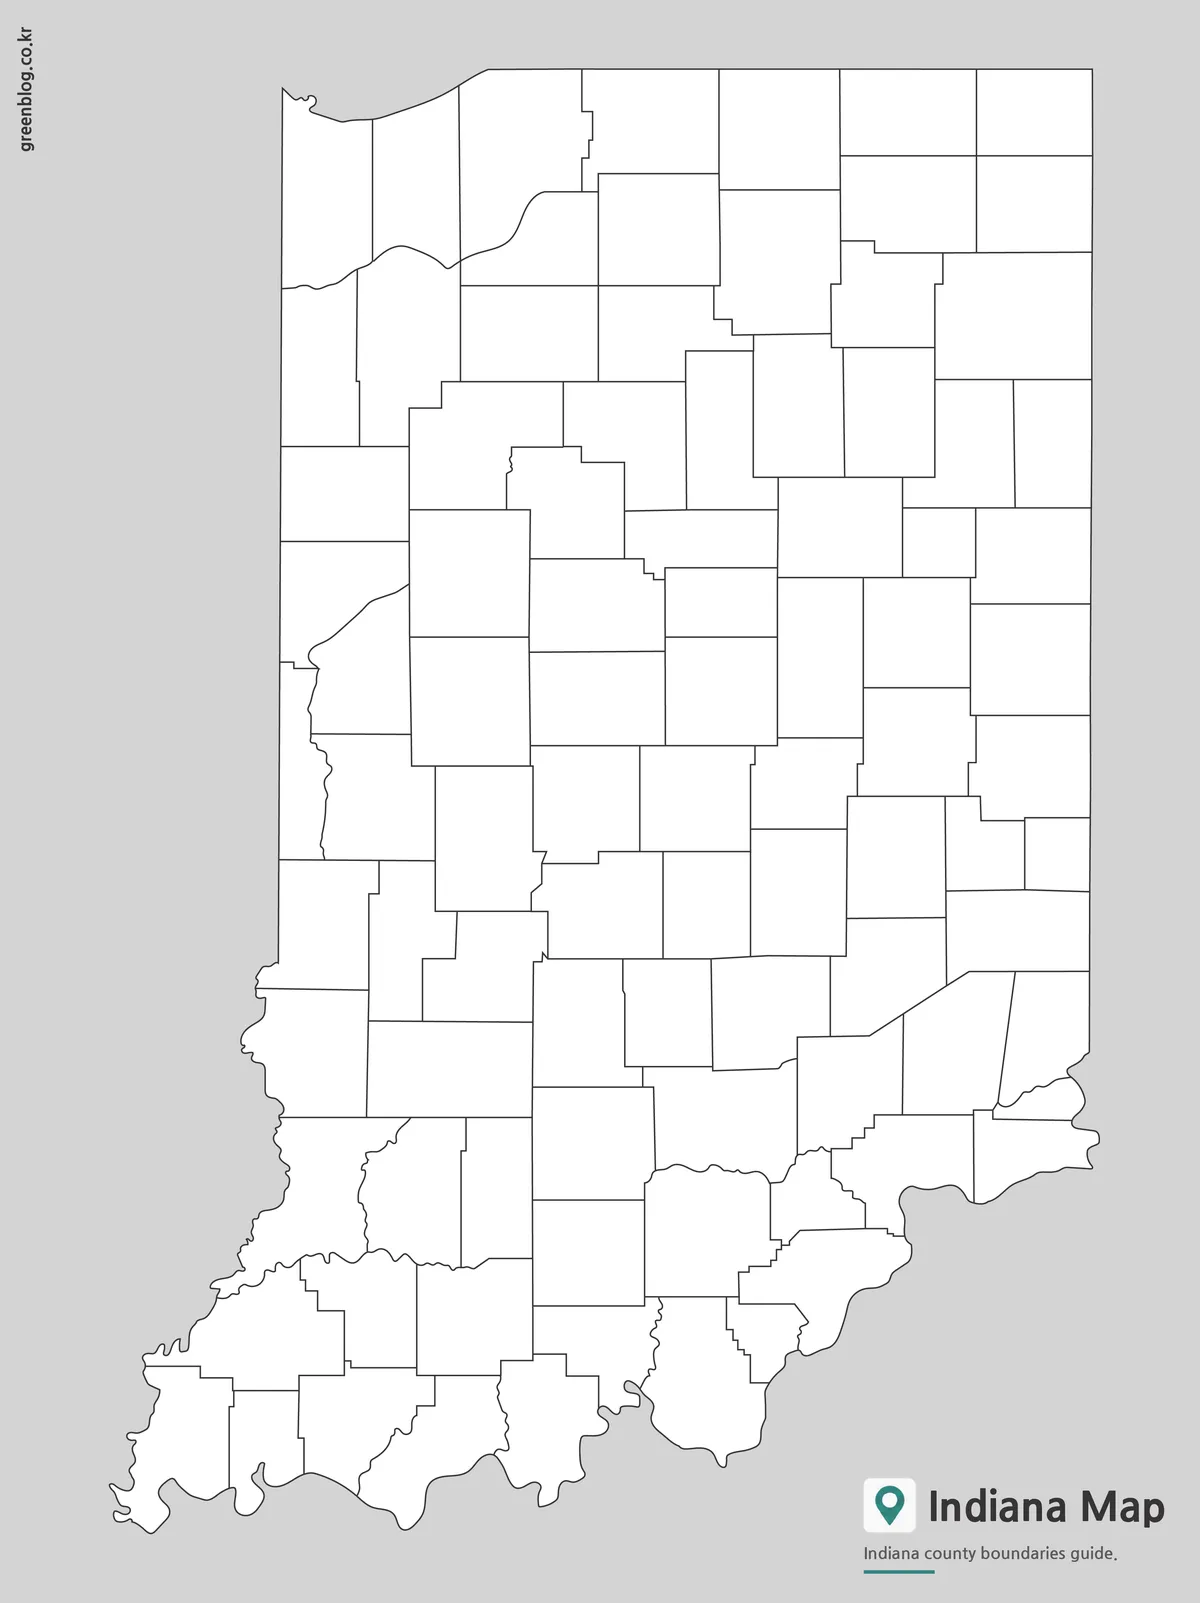
The outline Indiana State Map removes every county name and fill but preserves the state silhouette and internal divisions. Students can label selected counties, build a north-to-south identification exercise, or color groups created for a lesson. Designers can add markers, service areas, routes, or category fills while retaining a clean geographic base.
A useful activity is to identify Marion County first, then trace outward to the state borders. Another is to color the counties touching Lake Michigan, the Wabash River side, or the Ohio River edge and compare their shapes. Since the downloaded file is raster-based, annotations are best added on a separate layer in an image editor or placed over the map inside a document or slide program.
Choosing the Right Indiana State Map
Choose the color view for projected slides and quick county comparison, the monochrome labeled view for printed reference, and the blank outline when the reader must supply names or data. All three can be resized together because the county framework and portrait proportions match. Keeping an untouched copy is advisable before adding highlights or notes.
For A3 printing, preserve the original aspect ratio and check the preview before committing a large batch. “Fit to page” helps protect the outer state border from printer margins, while actual-size output is preferable when consistent scale matters across several sheets. A test page also confirms that small labels such as Ohio, Union, and Blackford remain clear with the selected printer settings.
Frequently Asked Questions
Can I print the Indiana State Map in A3 size?
Yes. All files were prepared for high-resolution A3 printing.
Does the map include county boundaries?
Yes. Every version includes Indiana county boundary lines.
Which version is best for editing?
The outline map is the best option for custom editing, coloring, annotations, and infographic creation.
Is the black and white version suitable for classroom use?
Yes. It was designed specifically for worksheets, handouts, and educational printing.
Map File Information
Download the three Indiana county-map versions together for printing, reference, or annotation.
- Included Versions: Color labeled, black-and-white labeled, and blank outline maps
- Printable Size: A3
- File Type: JPG / ZIP
- Intended Use: Lessons, handouts, presentations, and custom county projects
Related Maps
Additional Resources
- U.S. Census Bureau Indiana Geographic Guide — Review official explanations of Indiana counties, county subdivisions, places, and consolidated government geography.
Green Map creates custom-edited map images using open geographic data sources such as geoBoundaries, Natural Earth, OpenStreetMap, and government open data. These maps are edited visual materials, not raw data files, and are provided for education, documents, presentations, and graphic reference.