A Lanier County Map is especially useful when you need more than a simple county outline. Lanier County has an irregular shape, Lakeland sits near the middle of the county, and a dense network of creeks, ponds, lake water, and low ground spreads around that center. The four maps on this page separate those layers so the county is easier to understand without crowding every road, waterway, and elevation change into one image.
The WEBP maps in the article are lightweight previews. A downloadable ZIP below contains four high-resolution A3 JPG files covering the county reference map, the city view, the water network, and elevation. That makes it possible to choose a clean map for a classroom page, a presentation, local research, or printing instead of relying on one all-purpose image.
The strongest geographic pattern in the supplied maps is the contrast between a compact center around Lakeland and a county boundary that stretches into separate northern and southern sections. Banks Lake is a prominent landmark west of the center, but the water map shows that it is only one piece of a much broader drainage network. The elevation map adds another layer: its legend gives an actual county range of about 34 to 77 meters, with a mean of 58 meters, and the lower terrain forms a long corridor through the middle and southeast.
Table of Contents
A county organized around Lakeland
Lanier County is in southern Georgia and was established in 1920. Lakeland is the county seat, and on the supplied maps it is the most useful reference point for understanding the rest of the county. The boundary is not a simple rectangle. A broad central body extends into a northern projection, while the southern side narrows and continues much farther down. That shape matters because a place can be fairly close to Lakeland on the map yet still sit in a very different part of the county boundary.
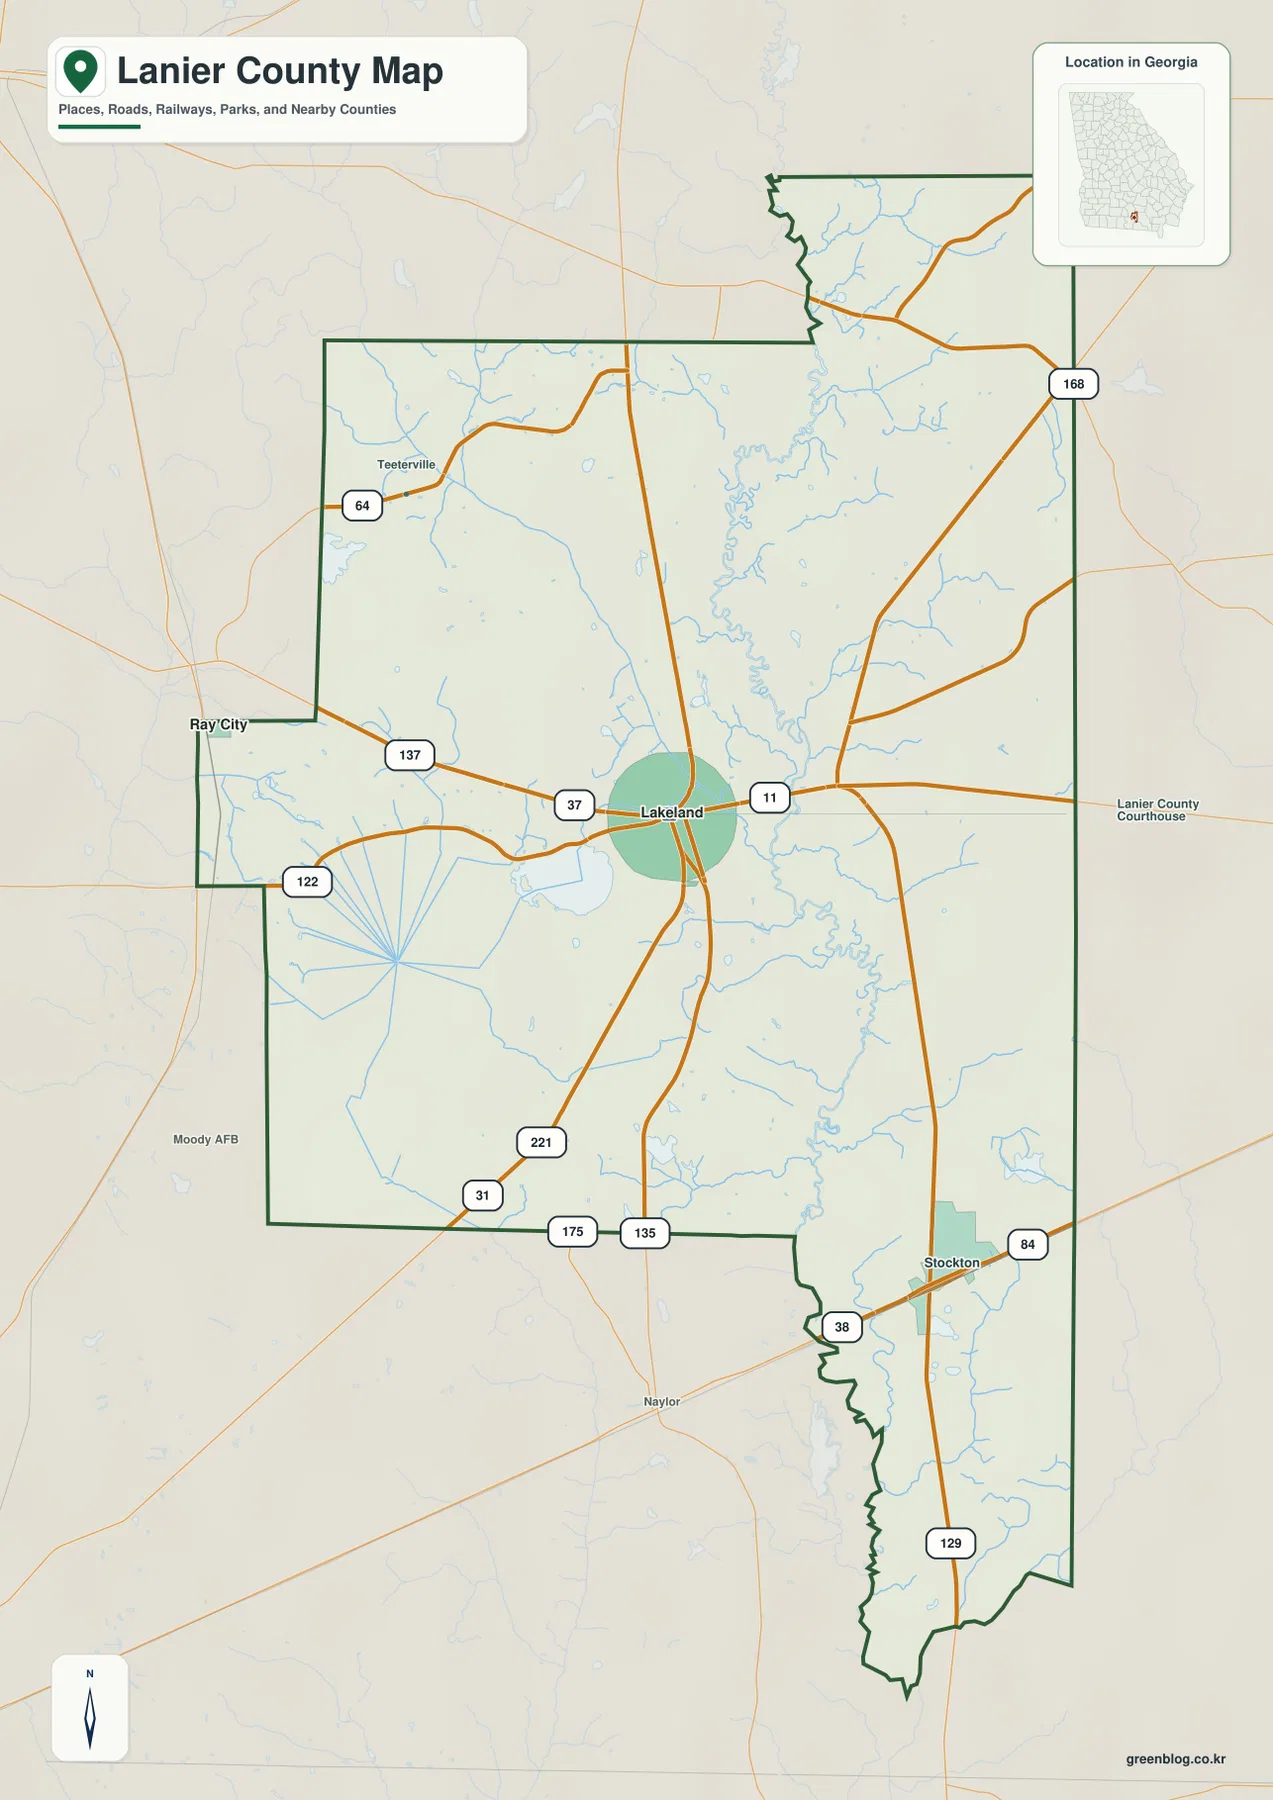
The county reference map gives the best overall orientation. Lakeland sits near several numbered routes, while labels such as 37, 11, 221, 129, 84, 122, 64, and 168 help show how travel lines approach different parts of the county. Teeterville appears toward the northwest portion of the mapped area, Stockton appears in the southeast, and Ray City is shown just outside the western context. These labels are useful for orientation, but the map is not meant to replace a complete street atlas or parcel map.
Water is already visible on the general map, particularly around the center and southeastern side, but the blue lines remain secondary to roads and place names. That is why this version works well as the starting map. It answers basic questions first: where the county boundary runs, where Lakeland sits inside it, which routes cross the county, and where the larger water features begin to appear. Once that frame is familiar, the specialized maps make much more sense.
| State | Georgia |
|---|---|
| County | Lanier County |
| County seat | Lakeland |
| Established | 1920 |
| Maps on this page | County, city, water, and elevation |
| Download package | Four high-resolution A3 JPG files in one ZIP |
Lakeland as the location anchor
The city map intentionally removes much of the labeling that competes for attention on the reference map. Its city index highlights Lakeland, and the marker falls near the middle of the county. This makes the relationship between the county seat and the unusual county outline easier to see. For a reader who only needs to show where the main incorporated center is located, this cleaner view is often more effective than the more detailed county map.
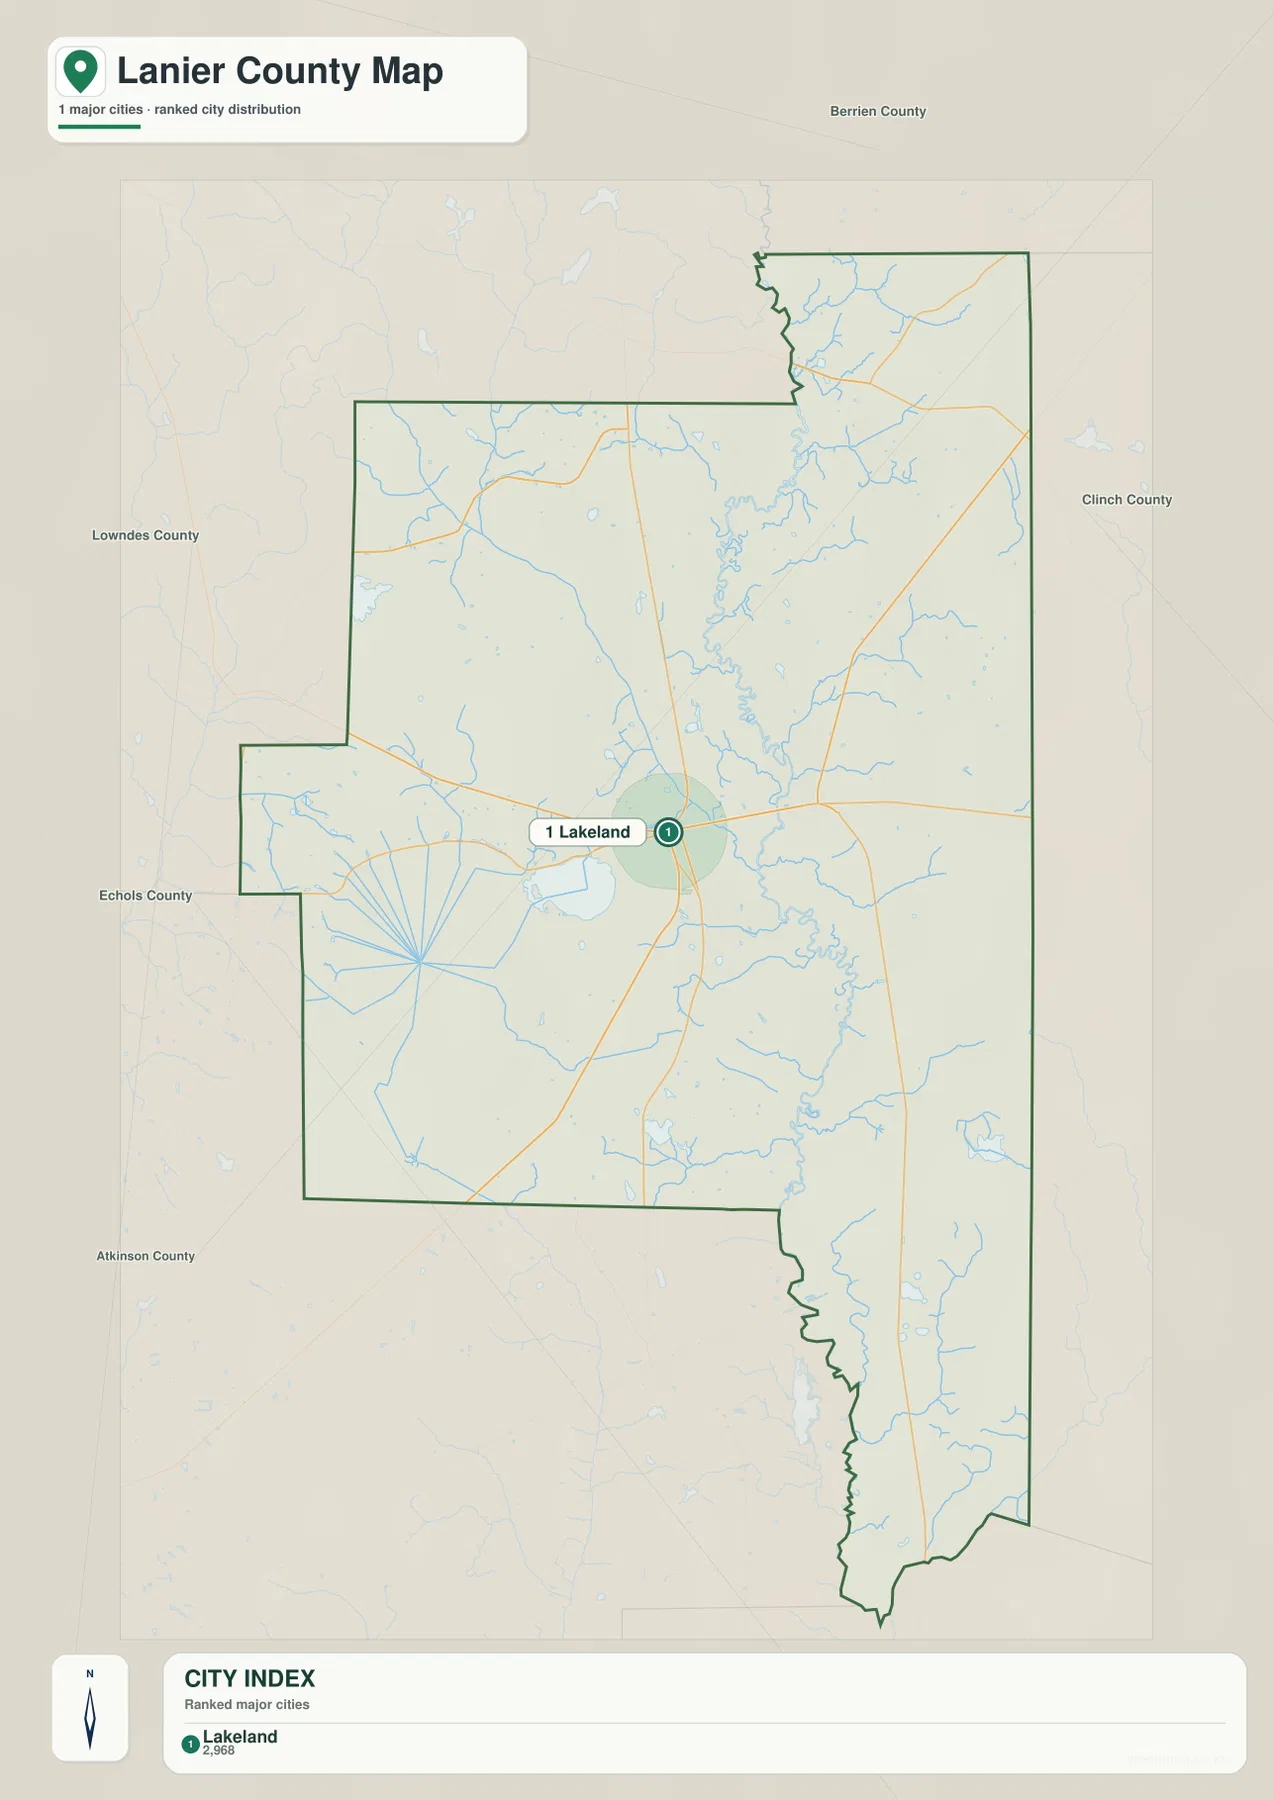
Names around the edge of the map include Berrien County, Clinch County, Lowndes County, Echols County, and Atkinson County. Seeing those labels together provides a quick South Georgia reference without requiring a statewide map. The point is not to turn the city map into a complete list of neighboring jurisdictions; it is to show how Lanier County fits among surrounding areas while keeping Lakeland visually dominant.
That emphasis also helps explain why Lakeland is such a practical reference point on the other maps. The county stretches north and south from the central area, so a reader can use Lakeland to judge whether a road, stream, or landform lies above, below, east, or west of the center. When the water map becomes crowded with named creeks, returning to this simpler city view can restore that sense of direction.
The city map should not be read as evidence that no smaller communities exist. It is a ranked major-city display, not a complete settlement inventory. The county reference map includes smaller place labels such as Teeterville and Stockton, while the city view deliberately keeps the urban layer simple. Choosing between the two depends on whether the task is to show the county seat clearly or to provide broader local-place context.
Banks Lake within a much larger water network
Banks Lake is one of the most recognizable named water features in the package, appearing west of Lakeland near the central part of the county. The dedicated water map makes clear, however, that the lake belongs to a landscape with many more streams and wet areas. Big Creek and the Alapaha River are labeled through the central area, while Lake Irma and Pattens Pond add smaller standing-water references nearby.
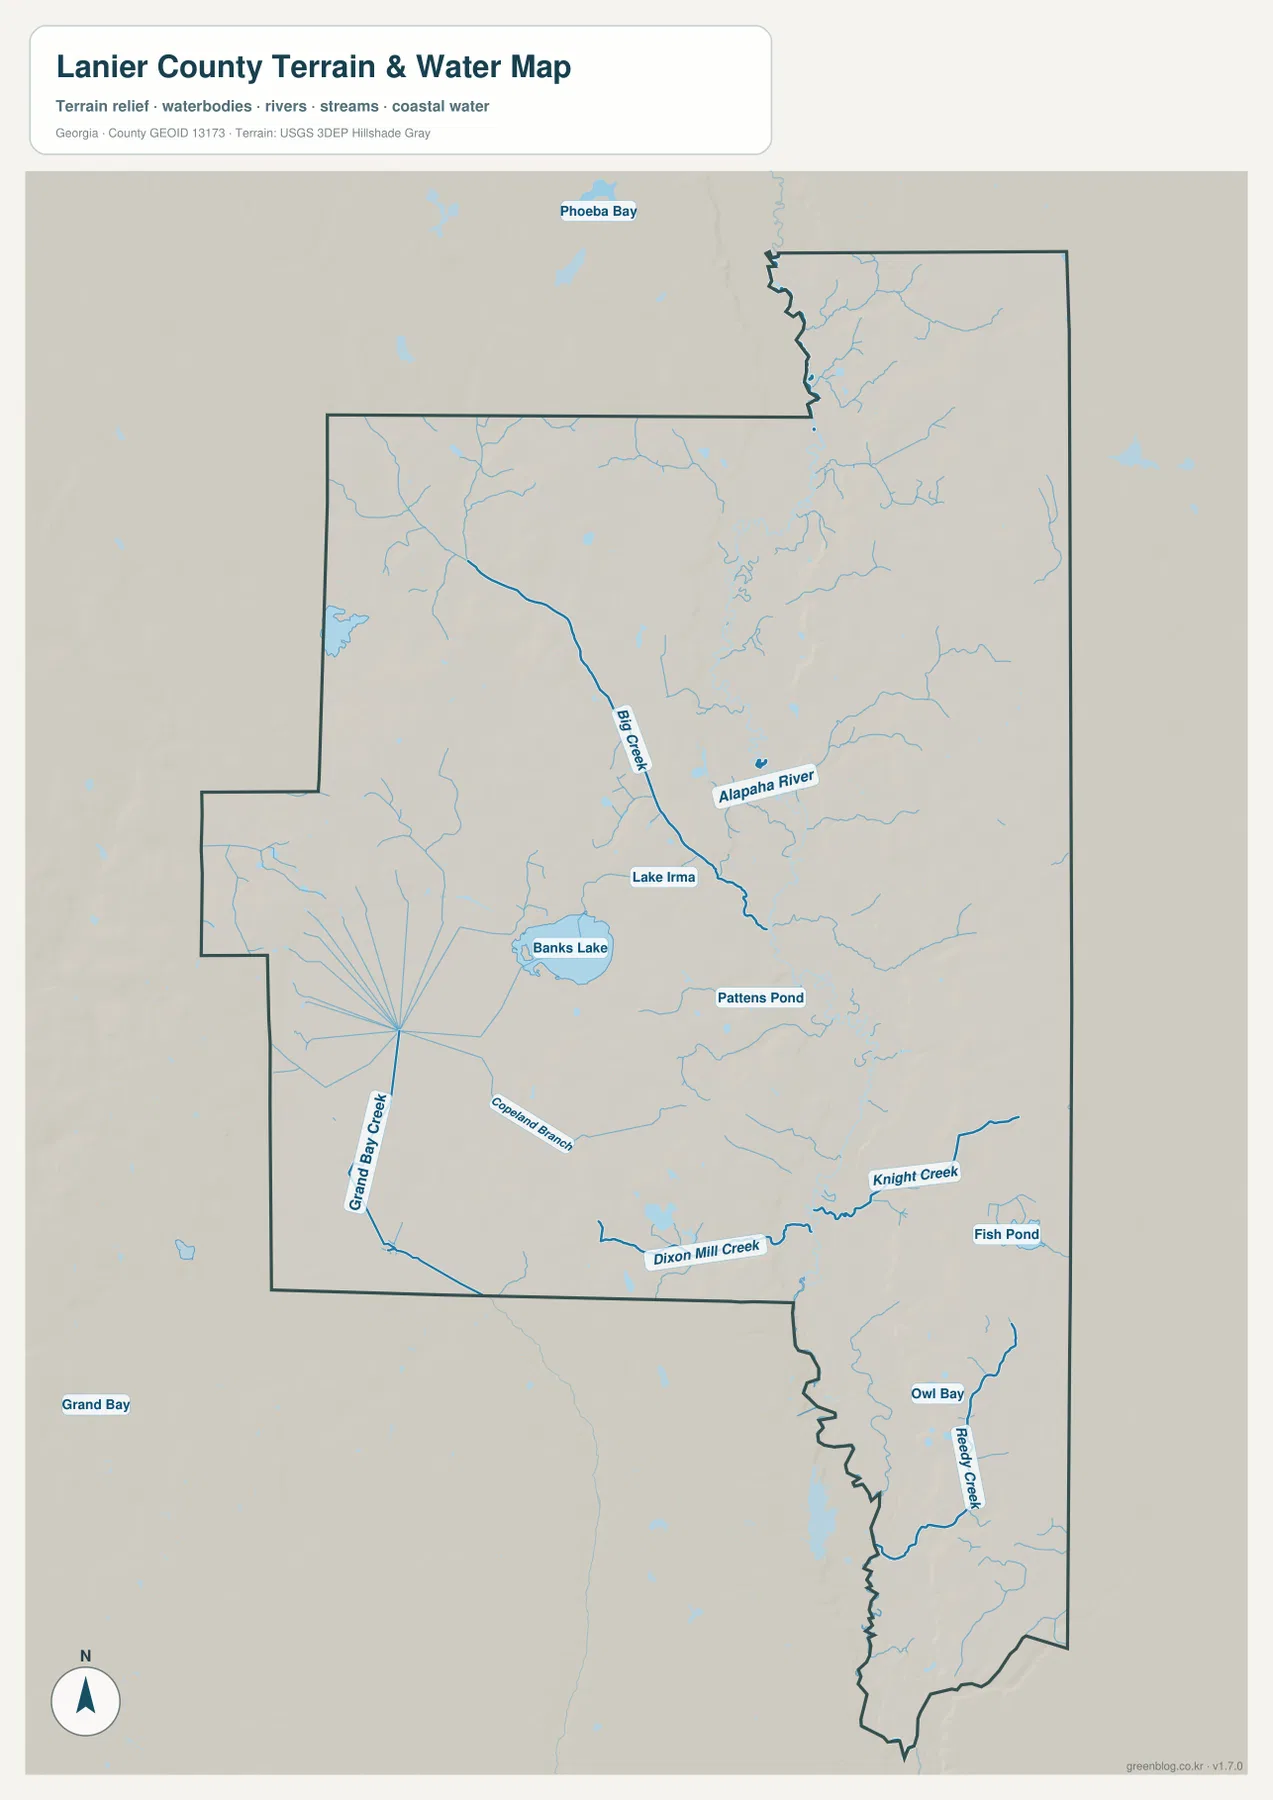
The central and southern parts of the map contain an especially useful set of names for local orientation. Grand Bay Creek and Copeland Branch appear to the southwest of the center. Farther south, Dixon Mill Creek and Knight Creek form longer blue lines, while Fish Pond and Owl Bay provide additional reference points near the southeastern side. Because the general map gives priority to roads and county context, many of these smaller waterways are much easier to follow on the dedicated water layer.
This concentration of named streams also explains why Banks Lake should not be treated as an isolated feature. A project about local water can start at the lake and then follow the surrounding channels outward. A project about the southern part of the county may be better served by Dixon Mill Creek, Knight Creek, or the smaller water features shown near the narrow southern extension. The map lets the subject determine which feature becomes the reference point.
The water map is a location reference, not a flood-risk or regulatory wetlands map. A blue line or water polygon identifies a mapped hydrographic feature; it does not by itself establish a flood zone, a legal wetland boundary, or development restrictions. For those questions, a specialized official source would be required. For ordinary geographic reading, the map is valuable because it shows how thoroughly water features are distributed across the county rather than reducing the story to Banks Lake alone.
Low relief with a clear north-to-south low corridor
Lanier County does not need mountains to have meaningful elevation differences. The elevation legend reports an actual range from roughly 34 to 77 meters and a mean elevation of 58 meters. Within that relatively modest range, the colors separate lower ground from higher patches clearly. Green tones form a broad low corridor through the central and southern portions, while browner higher ground is more evident in several western areas and parts of the northeast.
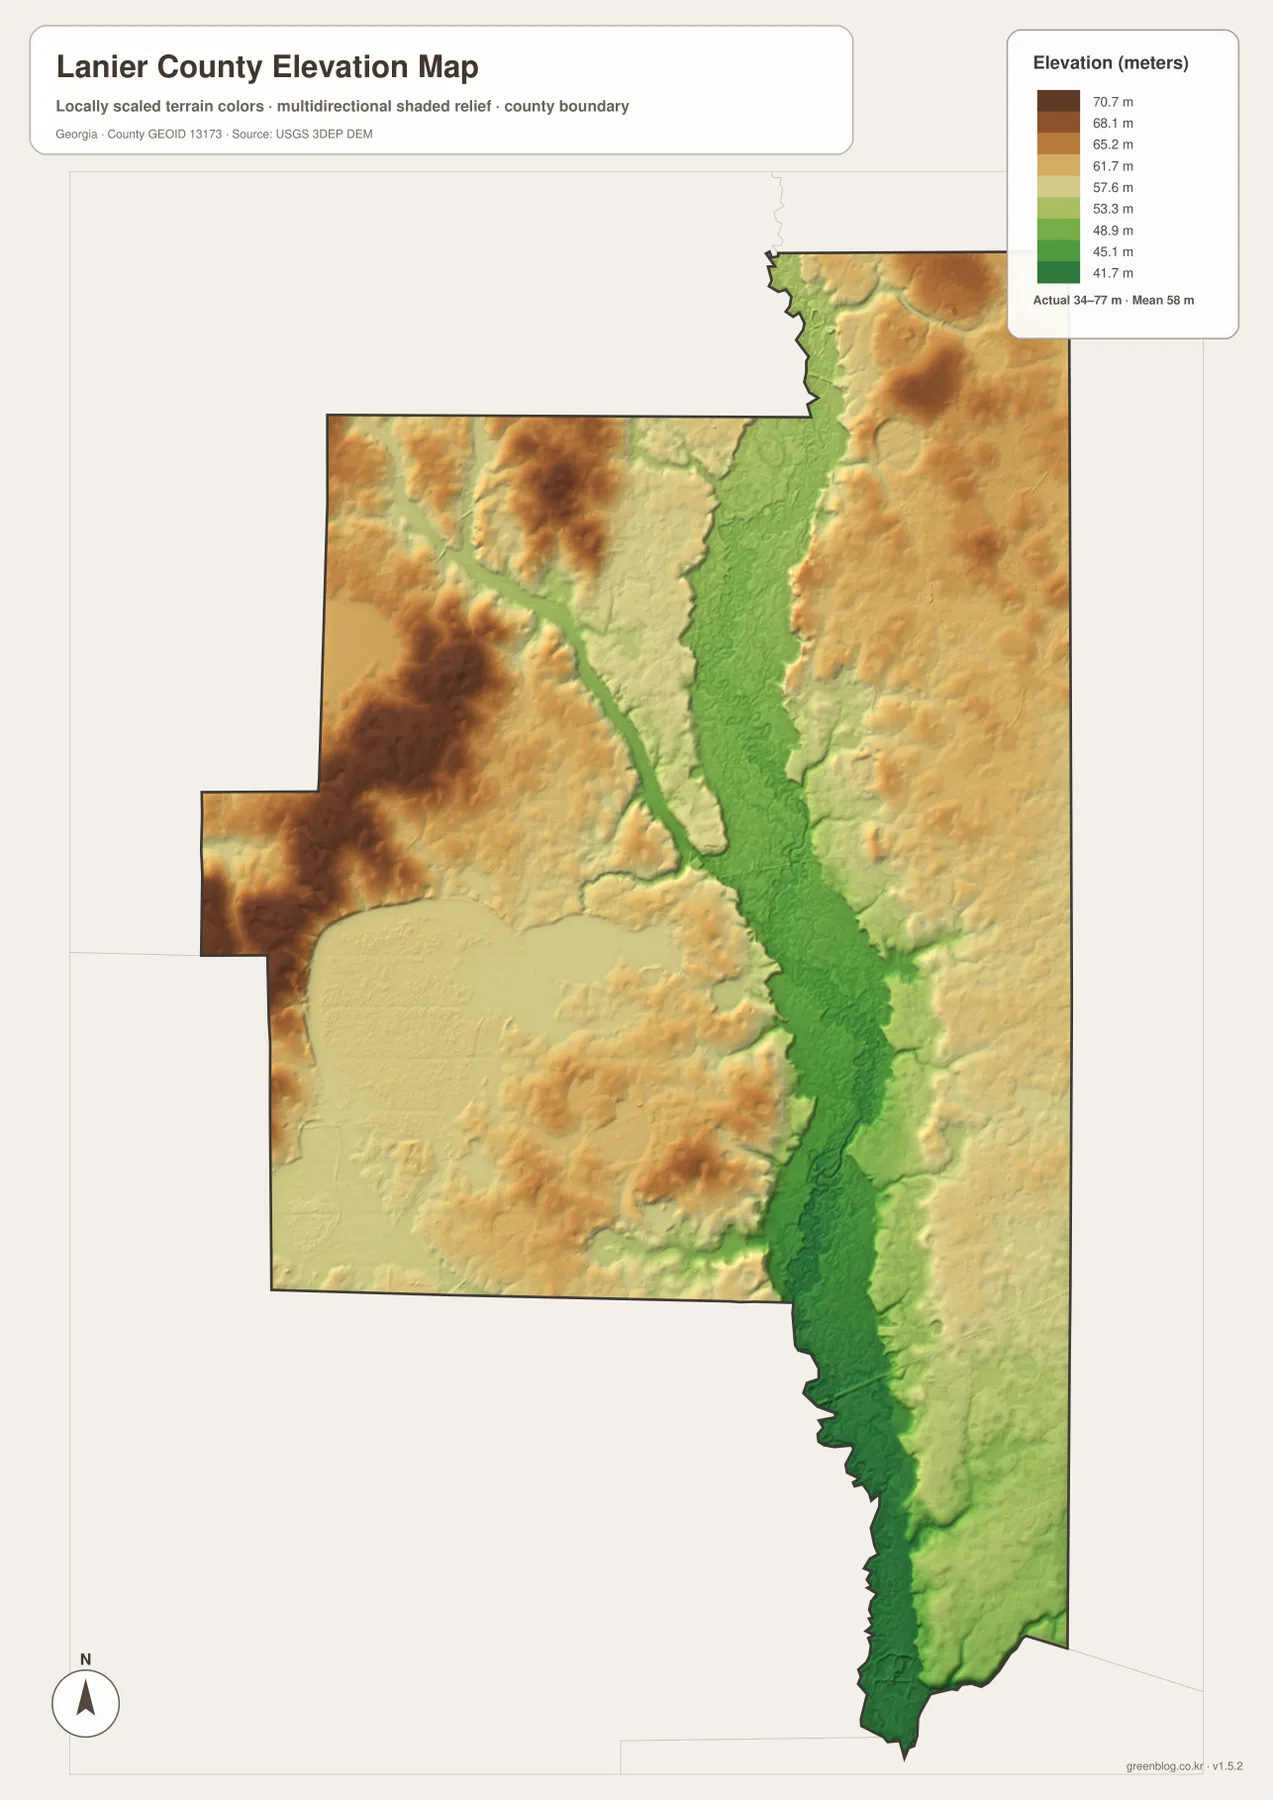
The long low band is easier to interpret after viewing the water map. Several creek and river features occupy or approach the same general lower parts of the county. The two maps are not identical layers, and every stream does not follow one single color band, but together they show why terrain and water are best read as related pieces of the local landscape. The central and southeastern low ground is especially noticeable when compared with higher patches to the west.
The numbers also prevent the map from being overinterpreted. A 34-to-77-meter county range means the total relief is measured in tens of meters, not hundreds. The map therefore shows subtle local terrain rather than dramatic mountain slopes. That is useful for a report or lesson because it allows a precise statement: Lanier County is generally low in elevation, yet the supplied DEM still reveals distinct low corridors and higher patches within the boundary.
This image is designed for county-scale comparison, not engineering or property surveying. It can show where the county is relatively low or high, but it should not be used to determine the exact elevation of a house lot, road grade, drainage ditch, or construction site. For those tasks, a more detailed survey or specialized elevation dataset would be necessary.
What changes when the four maps are compared
The value of the set comes from the way each map removes one kind of clutter and emphasizes another. The county reference map is the best place to begin because it combines boundary, roads, selected places, and water. The city map strips that information down so Lakeland and the surrounding county context stand out. The water map does the opposite: it reduces the road emphasis and gives names to streams, lakes, ponds, and branches. The elevation map removes most labels and turns the county into a terrain surface that can be compared with the waterways.
Banks Lake is a good example. On the water map, it is immediately identifiable as a named lake west of the center. On the county map, it can be related back to Lakeland and the road network. The elevation map then helps place the general lake and stream area within the broader pattern of low and higher ground. No single image needs to carry all three explanations at once, which makes the maps easier to read when printed or placed in a presentation.
The irregular county outline acts as the common reference between the four files. The northern projection, broad center, and long southern extension remain recognizable even when road labels or water names disappear. Once that outline is familiar, a reader can move from a creek on the water map to the same part of the terrain map without losing orientation. This is particularly useful in the narrow southern section, where smaller water features and lower terrain become more prominent than major place names.
The maps also make it easier to avoid generic descriptions of Lanier County. Instead of saying only that it is a rural South Georgia county, the supplied images allow more specific observations: Lakeland is the central anchor, Banks Lake lies close to that center, a dense set of named streams extends through the county, and the DEM shows a low corridor cutting through terrain that otherwise varies only moderately in elevation.
Choosing the map that matches the task
The most detailed-looking image is not always the best choice. A clean county reference works well when a reader needs roads and the boundary together. A classroom handout about the county seat is clearer with the city map because Lakeland is not competing with many stream labels. A water-focused project should go directly to the hydrography view, while an explanation of lowlands and higher ground is much easier with the elevation image.
- Use the county map for the full boundary, Lakeland, selected place labels, roads, and general orientation.
- Use the city map when Lakeland and its position within the county are the main point.
- Use the water map for Banks Lake, Alapaha River, Big Creek, Lake Irma, and the smaller southern waterways.
- Use the elevation map to compare the roughly 34–77 meter range and the lower central-to-southern terrain with relatively higher patches.
For printing, the downloadable A3 JPG files are preferable to the WEBP previews displayed in the article. All four files use the same county boundary, so they can be placed side by side or used on consecutive pages without forcing the reader to relearn the county shape. A report might use the reference map first, then the water or elevation map only where that extra layer is needed. This keeps each page focused and makes labels easier to read.
Frequently Asked Questions
Why is Lakeland the best starting point for reading these maps?
Lakeland is the county seat and is positioned near the central part of the supplied maps. The county boundary stretches into northern and southern sections, so Lakeland provides a consistent center from which to judge the location of roads, Banks Lake, streams, and the long southern extension. The city map emphasizes this relationship most clearly.
Which map is best for Banks Lake and the surrounding waterways?
Use the water map when the main goal is to locate Banks Lake and compare it with nearby hydrographic features. It also labels Alapaha River, Big Creek, Lake Irma, Pattens Pond, and several southern creeks. Pair it with the county reference map when you also need Lakeland and the road network for orientation.
What does the 34–77 meter elevation range mean?
Those values come from the legend on the supplied elevation map and describe the county-scale elevation range shown by the DEM, with a mean of about 58 meters. They are useful for comparing lower and higher parts of Lanier County, but they are not a substitute for a property survey or engineering-grade elevation measurement.
Sources and reference data
The following links provide county background and the official data context used for boundaries, water, and elevation. They are included as clickable references rather than as a generic list of GIS portals.
- U.S. Census Bureau QuickFacts – Lanier County, Georgia
- New Georgia Encyclopedia – Lanier County
- New Georgia Encyclopedia – Banks Lake resource
- U.S. Census Bureau TIGER/Line Shapefiles
- USGS National Hydrography
- USGS 3D Elevation Program
Map File Information
The download is one ZIP containing four high-resolution A3 JPG files: the county reference map, city map, water map, and elevation map. These full-size files are better suited to printing and project work than the lighter WEBP previews used in the article.
- Included Files: county map, city map, water map, and elevation map
Related Maps
Green Map creates custom-edited map images using open geographic data sources such as geoBoundaries, Natural Earth, OpenStreetMap, and government open data. These maps are edited visual materials, not raw data files, and are provided for education, documents, presentations, and graphic reference.