Marion County in north-central Arkansas is dominated by forest, but water has an unusually strong presence in the county pattern because Bull Shoals Lake spreads across the north. The 2025 summary on the supplied map lists forest at 62.39%, agriculture at 21.98%, water at 7.59%, and developed cover at 5.20%. Open agricultural areas are more common in the west and southwest, while broad forest blocks remain especially prominent in the east and south.
Four views are provided here: general land cover, forest and farmland, impervious/developed land, and a 1985–2025 land-cover comparison. The WebP images are intended for reading on the page, and the four original JPG maps are available together in one ZIP. Looking across the set makes it easier to separate a broad Ozark forest-and-water pattern from the smaller places where farming and built surfaces become more visible.
Table of Contents
Bull Shoals Lake Gives Marion County a Strong Water Signature
The northern edge of Marion County is the feature that stands out first. Blue water occupies a large, branching area rather than a narrow river corridor, reflecting the complex shoreline of Bull Shoals Lake. Marion County government describes the county as a mostly rural landscape of mountains and waterways and identifies Bull Shoals Lake, the White River, the Buffalo National River, and Crooked Creek among its important water features. That local description provides useful context for a map where water accounts for 7.59% of the 2025 cover summary.
The water percentage should not be read as if every part of the county has the same relationship to water. Most of the broad blue area is concentrated in the north, while narrower streams appear as much smaller linear features elsewhere. In the southeast, for example, forest remains visually dominant even where narrow channels are present. This difference matters when the map is used for watershed discussion: a large reservoir controls much of the mapped water area, but smaller streams still help explain where forest, open land, and settlement patterns meet.
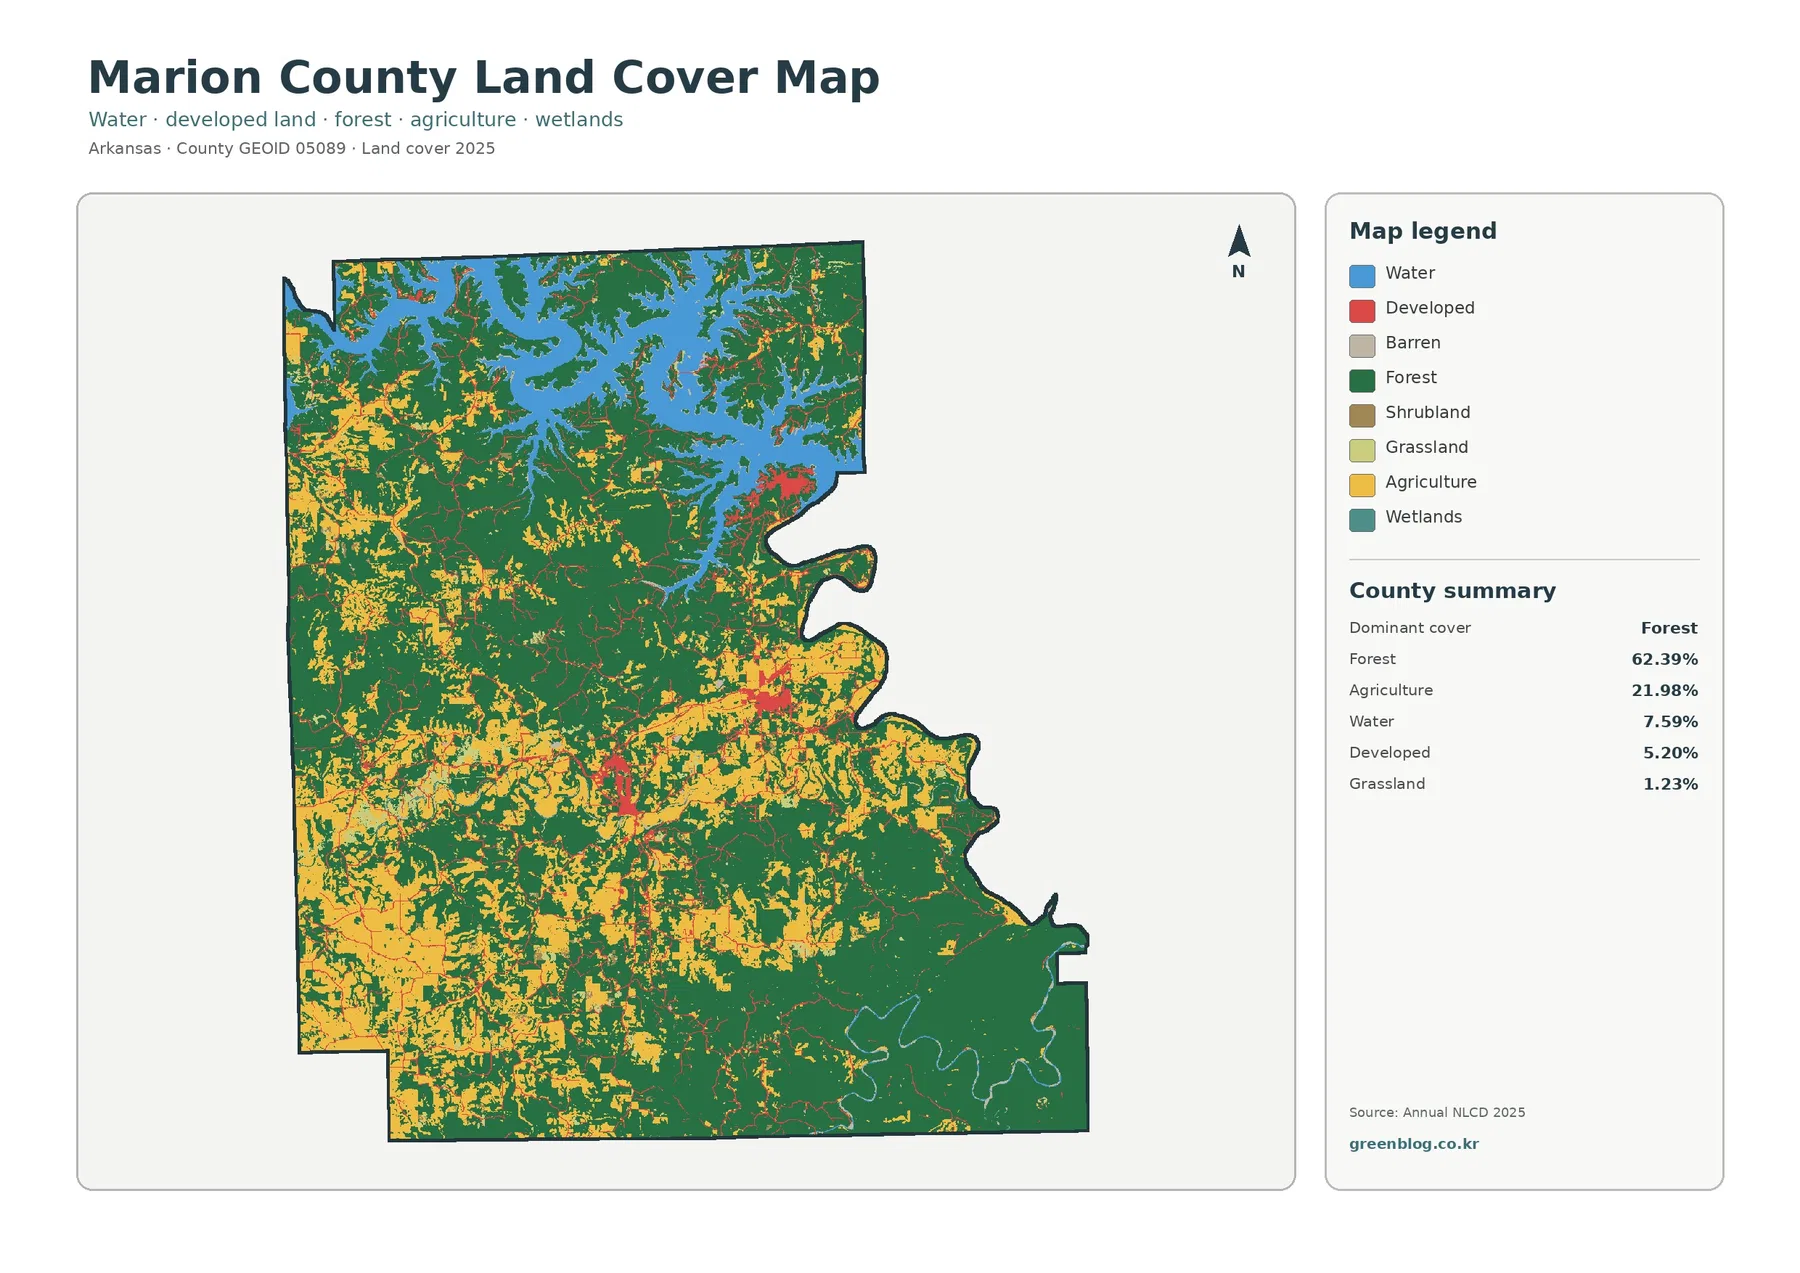
The same map makes the county-wide balance clear. Forest occupies 62.39%, agriculture 21.98%, developed cover 5.20%, and grassland 1.23% in the printed summary. Forest forms the largest continuous background across the east, south, and much of the center. Agricultural colors become more frequent toward the west and southwest, where open patches interrupt the forest more often. Developed colors are present, but they form compact clusters rather than a broad urban field.
Land cover is not the same as zoning or legal land use. A cell classified as forest tells the reader what type of surface was mapped there, not who owns the property or whether development is allowed. Agriculture does not identify a parcel boundary, and developed cover does not define a municipal limit. The map is most useful for comparing surface patterns at county scale, while property, zoning, and permitting questions require separate local records.
Forest Dominates, While Farm and Pasture Openings Are More Frequent in the West
The forest-and-farmland view removes some of the visual competition from the general map and makes the green-versus-open-land contrast easier to follow. Forest remains the dominant class at 62.39%. Agriculture is 21.98%, while the printed summary also lists grassland at 1.23%, shrubland at 0.48%, wetlands at 0.06%, and water at 7.59%. These smaller categories add texture to the edges of fields and forest, but they do not change the main county-wide balance.
Western and southwestern Marion County contain larger concentrations of agricultural and open-cover colors. They are not arranged as one uninterrupted farming plain. Instead, open patches have irregular boundaries and are frequently separated by forest. Moving east and southeast on the map, forest becomes much more continuous. This pattern fits the county government’s description of a rural mountainous setting, although the land-cover image by itself cannot prove that slope, soils, or any single physical factor caused a particular field to be located where it is.
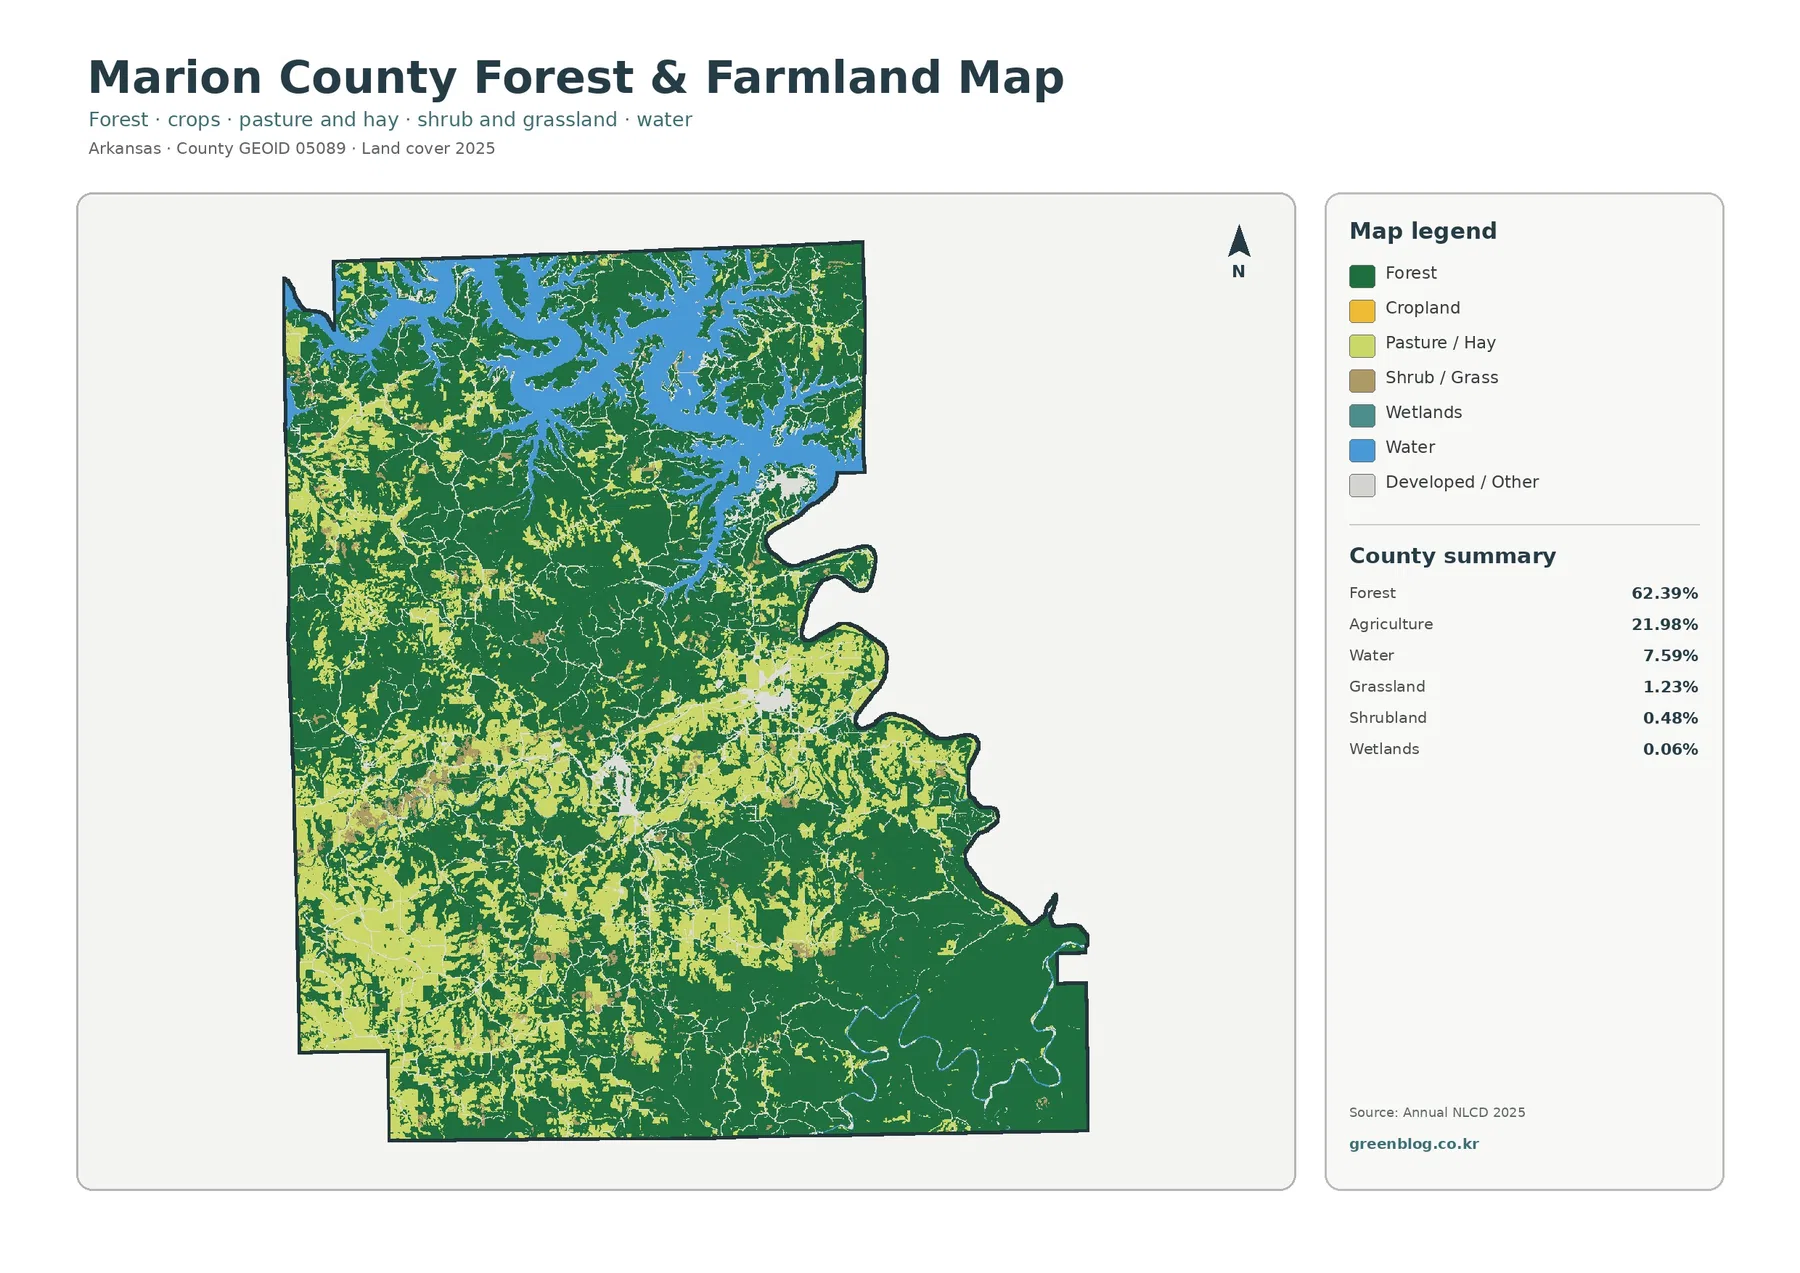
The north presents a different comparison because Bull Shoals Lake interrupts both forest and open land. Forest follows much of the reservoir’s irregular shoreline, while agricultural colors become less dominant in the large water-facing zone than they are in parts of the west. The map therefore supports more than a simple “forest versus farms” description. It separates three visually different settings: water-and-forest in the north, a more open western and southwestern landscape, and broad forest coverage in the east and south.
For classroom or presentation use, this view works well as a first map when the topic is rural land cover rather than settlements. A reader can identify the largest forest blocks and the main open agricultural concentrations without being distracted by smaller developed classes. The general map can then be used to add water and development back into the comparison. That two-step reading method is often clearer than trying to explain every legend color at the same time.
Built Surfaces Are Localized Even Though Developed Cover Reaches 5.20%
The impervious-surface map answers a different question. Instead of assigning each cell to a broad land-cover class, it emphasizes the fraction covered by hard surfaces such as pavement, rooftops, and similar materials that do not readily absorb water. The county summary gives a mean impervious value of 0.81%, with only 0.22% of the mapped area in cells that are at least 50% impervious. Most of Marion County therefore appears very light on this map.
A few orange and red clusters stand out sharply against that light background. The strongest concentrations occur in the central-to-northeastern part of the county and at several other small settlement points. Marion County’s official website identifies Yellville as the county seat and lists communities including Flippin, Bull Shoals, Pyatt, and Summit. Those names are useful reference points when comparing the impervious map with a labeled road or place map, but the supplied image itself does not draw city boundaries, so an individual red cluster should not be treated as an exact municipal outline.
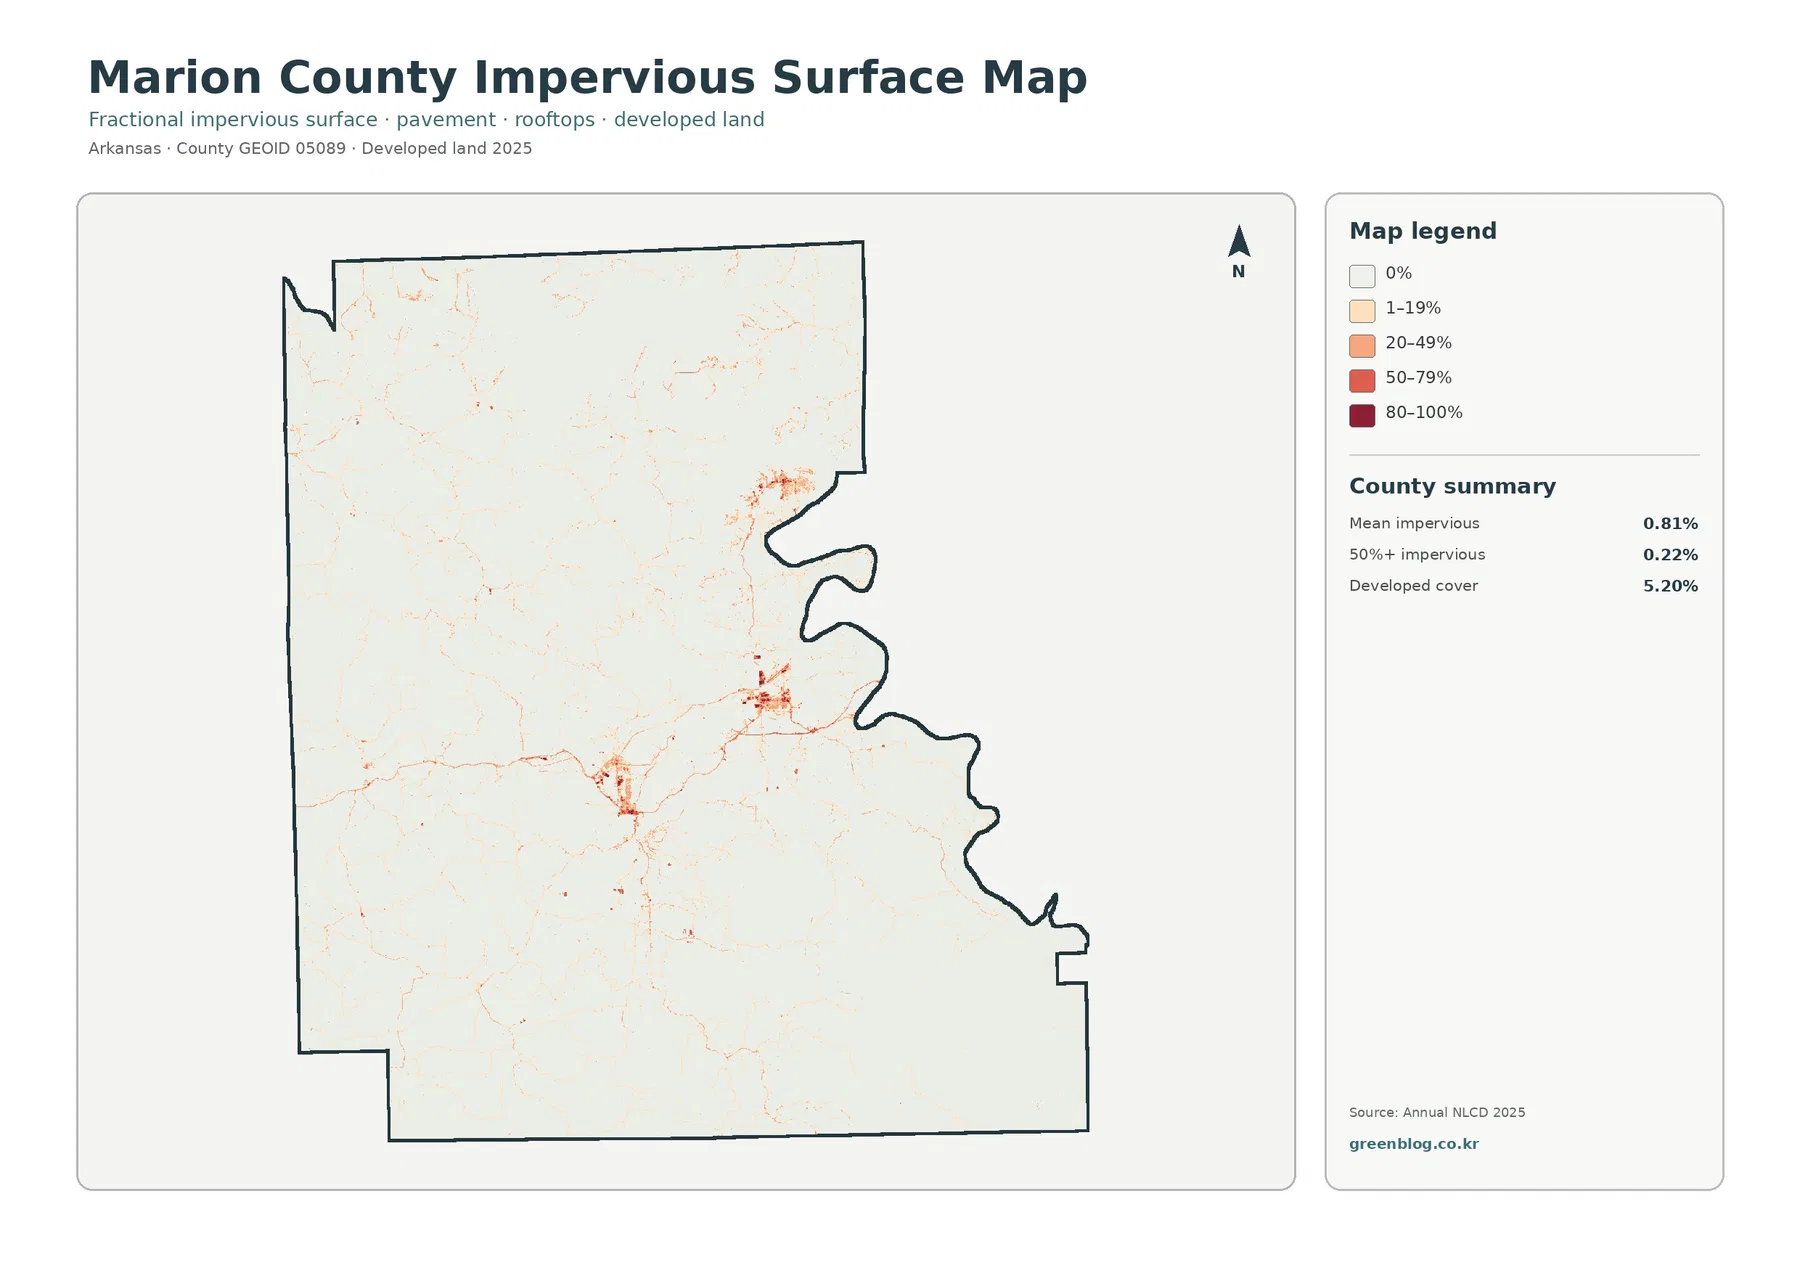
Developed cover is 5.20% on the general land-cover map, which is much larger than the 0.81% mean impervious percentage. The values are not contradictory because they measure different things. A developed land-cover class can include lawns, trees, yards, and other vegetated surfaces within a settled area. The impervious product isolates the hard-surface fraction. A low-density neighborhood can therefore be mapped as developed while still having a relatively low impervious percentage.
Thin reddish lines also connect some of the brighter clusters. They are consistent with paved transportation corridors, but this image is not a road-classification map and does not label route numbers. Its strength is comparison: it shows where hard surfaces concentrate relative to the large forested and agricultural areas. For exact roads, addresses, utility corridors, or municipal limits, a dedicated reference map is still necessary.
The 1985–2025 Comparison Flags 11.64% Class Difference, Not a Single Cause of Change
The change map compares the mapped class in 1985 with the class in 2025. Its summary reports 11.64% class difference across the county. Within that total, 1.28% is labeled as change to developed, 6.13% as forest loss, 0.70% as agricultural loss, and 3.50% as other difference. Large white areas represent cells with no class difference in the comparison, while colored cells identify locations where the mapped category changed.
Orange forest-loss cells are scattered rather than confined to one single zone. They are visible in the west and southwest and also appear in smaller patches through the central and northern parts of the county. The map label “forest loss” should be read as a classification transition, not automatically as a logging record. It tells us that a cell classified as forest at the earlier date was assigned to another class later. Determining whether the reason was timber harvest, agriculture, development, vegetation dynamics, or classification uncertainty requires additional evidence.
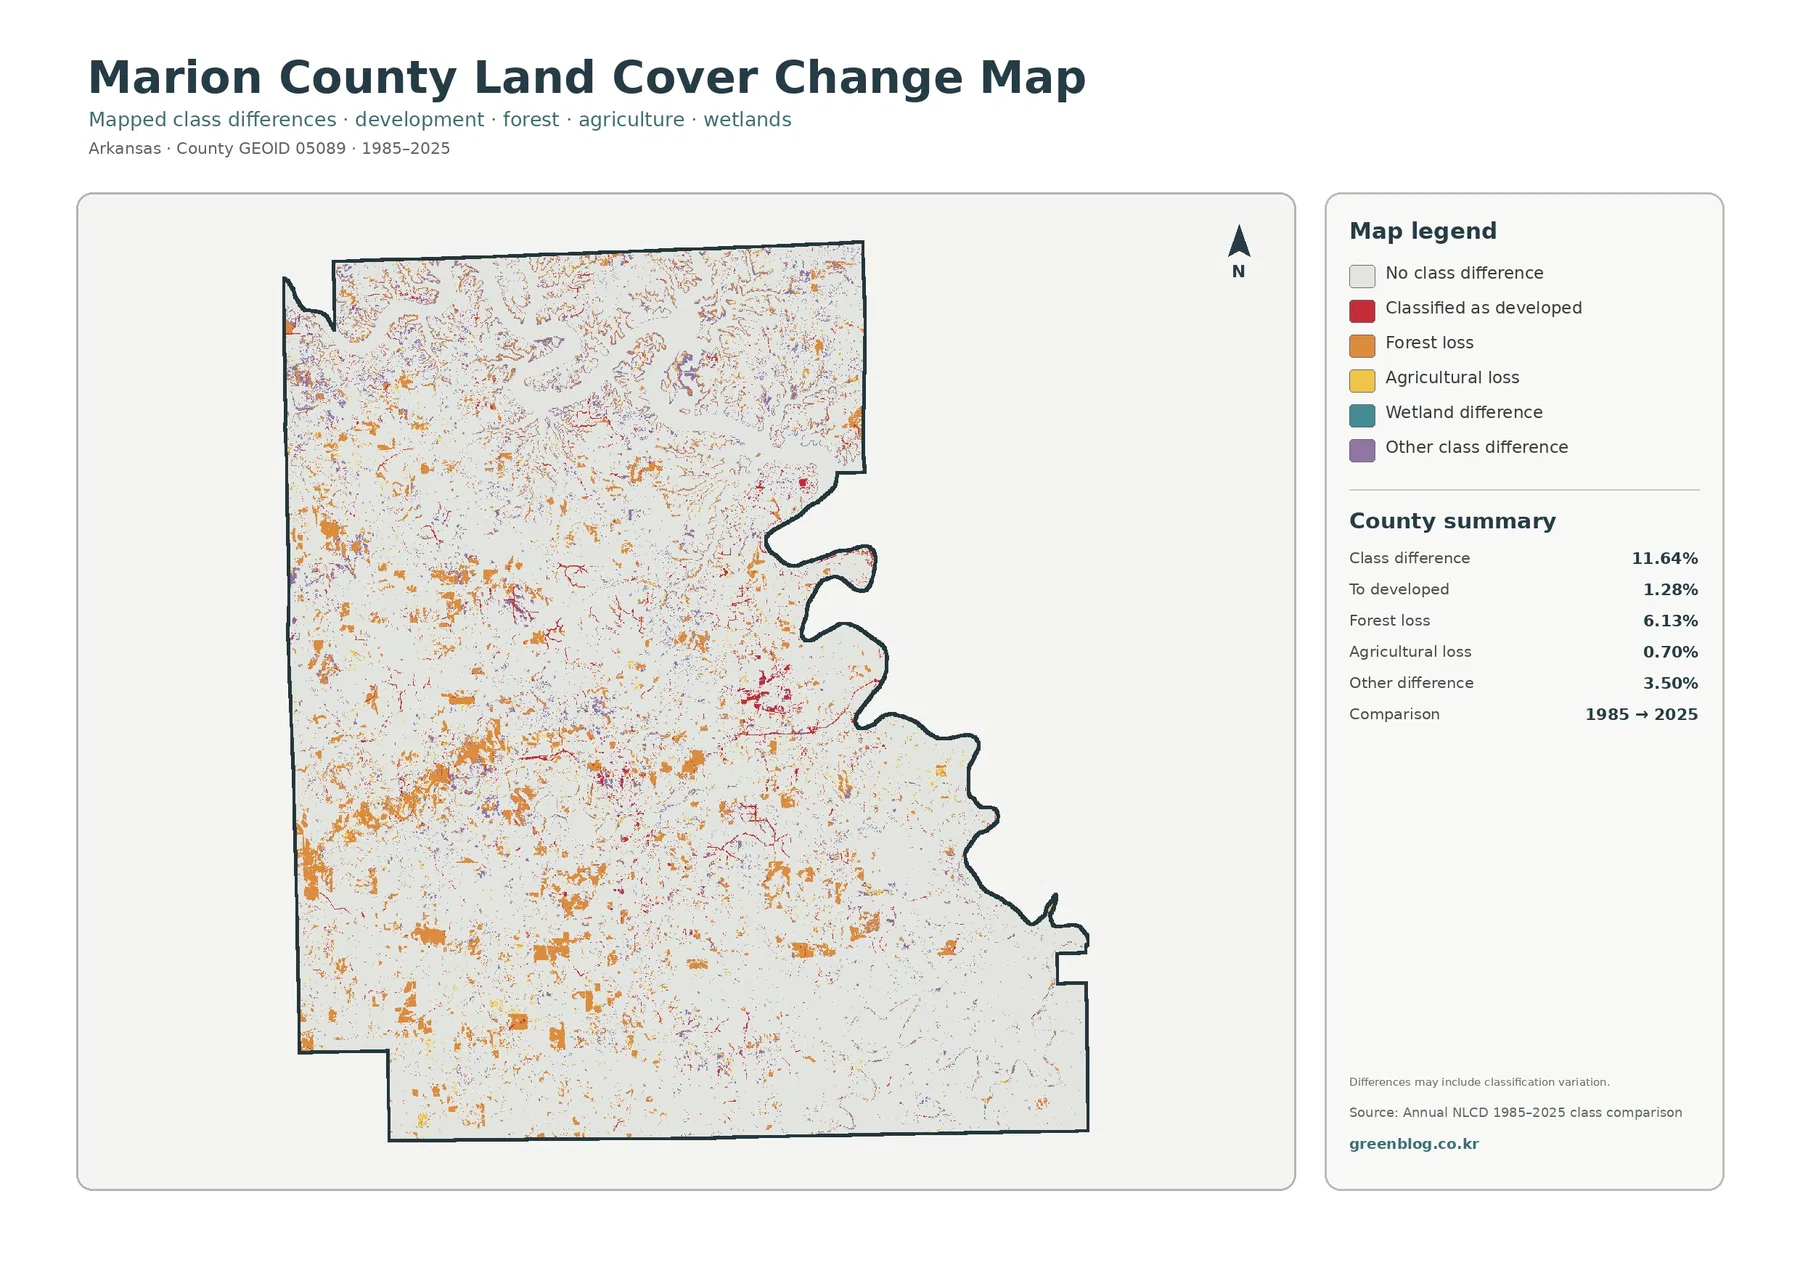
Red change-to-developed cells often occur near places that also stand out on the 2025 impervious map. That spatial overlap is useful for choosing locations to investigate, but it does not establish a cause. The impervious map describes the amount of hard surface in 2025; the change map describes a difference between two classifications. A historical aerial-photo series, planning record, or local development record would be needed to explain when and why a specific place changed.
The map itself includes an important warning that differences may include classification variation. That matters along complicated forest edges, around narrow roads and streams, and in mixed rural cells. A 30-meter cell can contain several real-world surfaces at once, and its dominant class can differ between dates even when the ground change is subtle. The 11.64% total is therefore best used to describe the scale and location of mapped class differences, not as a direct statement that exactly 11.64% of the county underwent a single kind of physical conversion.
County References Help Connect the Map to Yellville, Bull Shoals, and Major Waterways
Marion County’s official site gives a useful local frame for the unlabeled land-cover images. It identifies Yellville as the county seat and includes Flippin, Bull Shoals, Pyatt, and Summit among county communities. It also describes about 597 square miles of mostly rural mountains and waterways. These facts do not replace the maps, but they help explain why a few built clusters can coexist with a county summary dominated by forest, agriculture, and water.
The same official source names Bull Shoals Lake, the White River, the Buffalo National River, and Crooked Creek. The U.S. Army Corps of Engineers manages Bull Shoals Lake and describes it as a major Ozark reservoir with an extensive shoreline. On the land-cover map, that physical complexity appears as a broad blue area with long branching arms. The map does not identify recreation sites, flood zones, water quality, or navigation information, so those topics should be checked against the appropriate water-management sources rather than inferred from land-cover colors.
This local context is especially useful when comparing the north with the rest of the county. The north is shaped visually by the reservoir and surrounding forest, while the west and southwest have more open agricultural cover. Developed clusters occupy much smaller areas than either of those landscape types. A reader can therefore use the four maps to move from a broad regional picture to specific questions about open land, built surfaces, or long-term class differences without treating one map as a complete geographic reference.
Use the Four Views as a Sequence Rather Than Treating Them as Interchangeable
For a quick county overview, start with the general land-cover map. It places forest, agriculture, water, developed land, and smaller classes in the same frame. If the question is specifically about the relationship between wooded land and open rural areas, move to the forest-and-farmland view. That second map reduces clutter and makes the western agricultural concentrations easier to compare with the larger forest blocks in the east and south.
The impervious map is most useful after the broad pattern is understood. It isolates hard-surface concentrations that can be visually minor on a forest-dominated map. The change map should come last when the goal is a time comparison, because its colors refer to differences between dates rather than the 2025 surface alone. Reading it without the current maps can make a small change patch look more important than its present-day context warrants.
Different audiences can use the set in different ways. A teacher can pair the general and change maps to discuss current cover and mapped change. A watershed presentation can begin with Bull Shoals Lake on the general map and then compare surrounding forest and open land. A county comparison project can use the printed percentages to place Marion County beside another Arkansas county. None of these uses requires interpreting the maps as parcel surveys or regulatory documents.
Download the Four Original Marion County JPG Maps
The download ZIP contains four separate JPG files: the 2025 general land-cover map, forest and farmland map, impervious/developed-land map, and the 1985–2025 land-cover change map. The supplied asset manifest lists each original JPG at 2480×1754 pixels, while the WebP previews used in the article are 1800×1273 pixels. The manifest does not mark the originals as meeting its A3 high-resolution reference, so the files are described at their supplied size rather than as newly upscaled or guaranteed for a particular print standard.
Thirty-Meter Raster Cells Show County Patterns, Not Survey-Grade Boundaries
USGS documents Annual NLCD as a raster product derived from Landsat imagery at 30-meter spatial resolution. Raster data divide the landscape into grid cells. Each cell summarizes a dominant surface class or, for impervious products, a fraction of hard surface. A cell at the edge of a forest may contain trees, a driveway, grass, and part of a building. The final map necessarily simplifies that mix.
That simplification is important in Marion County because forest edges, small agricultural clearings, narrow streams, and rural roads frequently meet within short distances. Stair-step color edges are partly a result of the grid and should not be mistaken for surveyed fence lines. Small creeks, narrow tree strips, isolated buildings, and tiny pastures may be blended with surrounding cells. The maps are strong for county-scale concentration and contrast, but they are not appropriate for calculating a legal parcel acreage.
The current maps are labeled 2025, and the comparison map uses 1985 and 2025. Construction, harvest, vegetation recovery, farming changes, or shoreline conditions after the observation period may be absent. Reservoir shorelines can also look different with water level. When a decision depends on current conditions, the land-cover maps should be paired with recent aerial imagery, local government records, and field information appropriate to the question.
Frequently Asked Questions
What is the dominant 2025 land-cover class in Marion County?
Forest is the largest class at 62.39%, followed by agriculture at 21.98%. Water accounts for 7.59%, developed cover for 5.20%, and grassland for 1.23% in the general map summary. The largest forest blocks are especially visible in the east and south, while agricultural openings are more frequent in the west and southwest.
Why does water occupy such a noticeable part of the Marion County map?
Bull Shoals Lake spreads across the northern part of the county and creates a large branching water pattern. Marion County government also identifies the White River, Buffalo National River, and Crooked Creek as important waterways. The 7.59% water figure is a county-wide area summary, so the large reservoir contributes much more area than the narrow streams even though both are geographically important.
Does the 6.13% forest-loss category mean 6.13% of the county was logged?
No. It is a classification transition in the 1985–2025 comparison. A cell mapped as forest at the earlier date and another class at the later date enters that category, but the change map does not record the cause. Logging, development, agriculture, natural vegetation change, or classification variation would require additional evidence to distinguish.
What is included in the Marion County ZIP download?
The ZIP contains four original JPG maps corresponding to the topics shown on the page: 2025 general land cover, forest and farmland, impervious/developed land, and 1985–2025 land-cover change. They can be opened separately for printing, classroom work, presentations, or side-by-side county comparisons.
Sources and Reference Material
- MRLC Annual NLCD Data — official access to Annual NLCD land-cover and related products.
- USGS Annual NLCD Collection 1.2 Land Cover — describes the 2025 extension of the annual series and its 30-meter raster product.
- USGS: What is the spatial resolution of Annual NLCD data? — confirms the 30-meter raster resolution.
- Marion County, Arkansas Government — official county information for Yellville, Flippin, Bull Shoals, local waterways, and the county’s rural mountain setting.
- U.S. Army Corps of Engineers: Bull Shoals Lake — official information about the reservoir and its managed shoreline environment.
Map File Information
The ZIP includes four original JPG maps for Marion County: 2025 land cover, forest and farmland, impervious/developed land, and 1985–2025 land-cover change.
- Included Files: land cover, forest/farmland, impervious/developed land, and land-cover change maps
- File Type: one ZIP containing four JPG files
Related Maps
- A Craighead County Arkansas Land Cover Map
- Arkansas County Arkansas Land Cover Map
- Ashley County Arkansas Land Cover Map
Green Map creates custom-edited map images using open geographic data sources such as geoBoundaries, Natural Earth, OpenStreetMap, and government open data.
These maps are edited visual materials, not raw data files, and are provided for education, documents, presentations, and graphic reference.