Forest and developed land account for most of Douglas County in the supplied 2025 classification. Forest is the largest class at 49.08%, while developed land covers 38.79%. The built pattern is broadest in the northeast and across the middle of the county, while larger forest blocks remain toward the south and southwest. This Douglas County Georgia Land Cover Map set lets readers compare that present-day pattern with forest and farmland, impervious surfaces, and mapped class differences between 1985 and 2025.
The four WebP images on this page are quick previews. The original 2480 × 1754-pixel JPG maps are available together in one download below. They work well for county profiles, environmental lessons, presentations, and broad comparisons of development and vegetation, but they are not parcel, zoning, survey, flood, or municipal-boundary maps.
Table of Contents
A county where a dense northeast meets a greener southern half
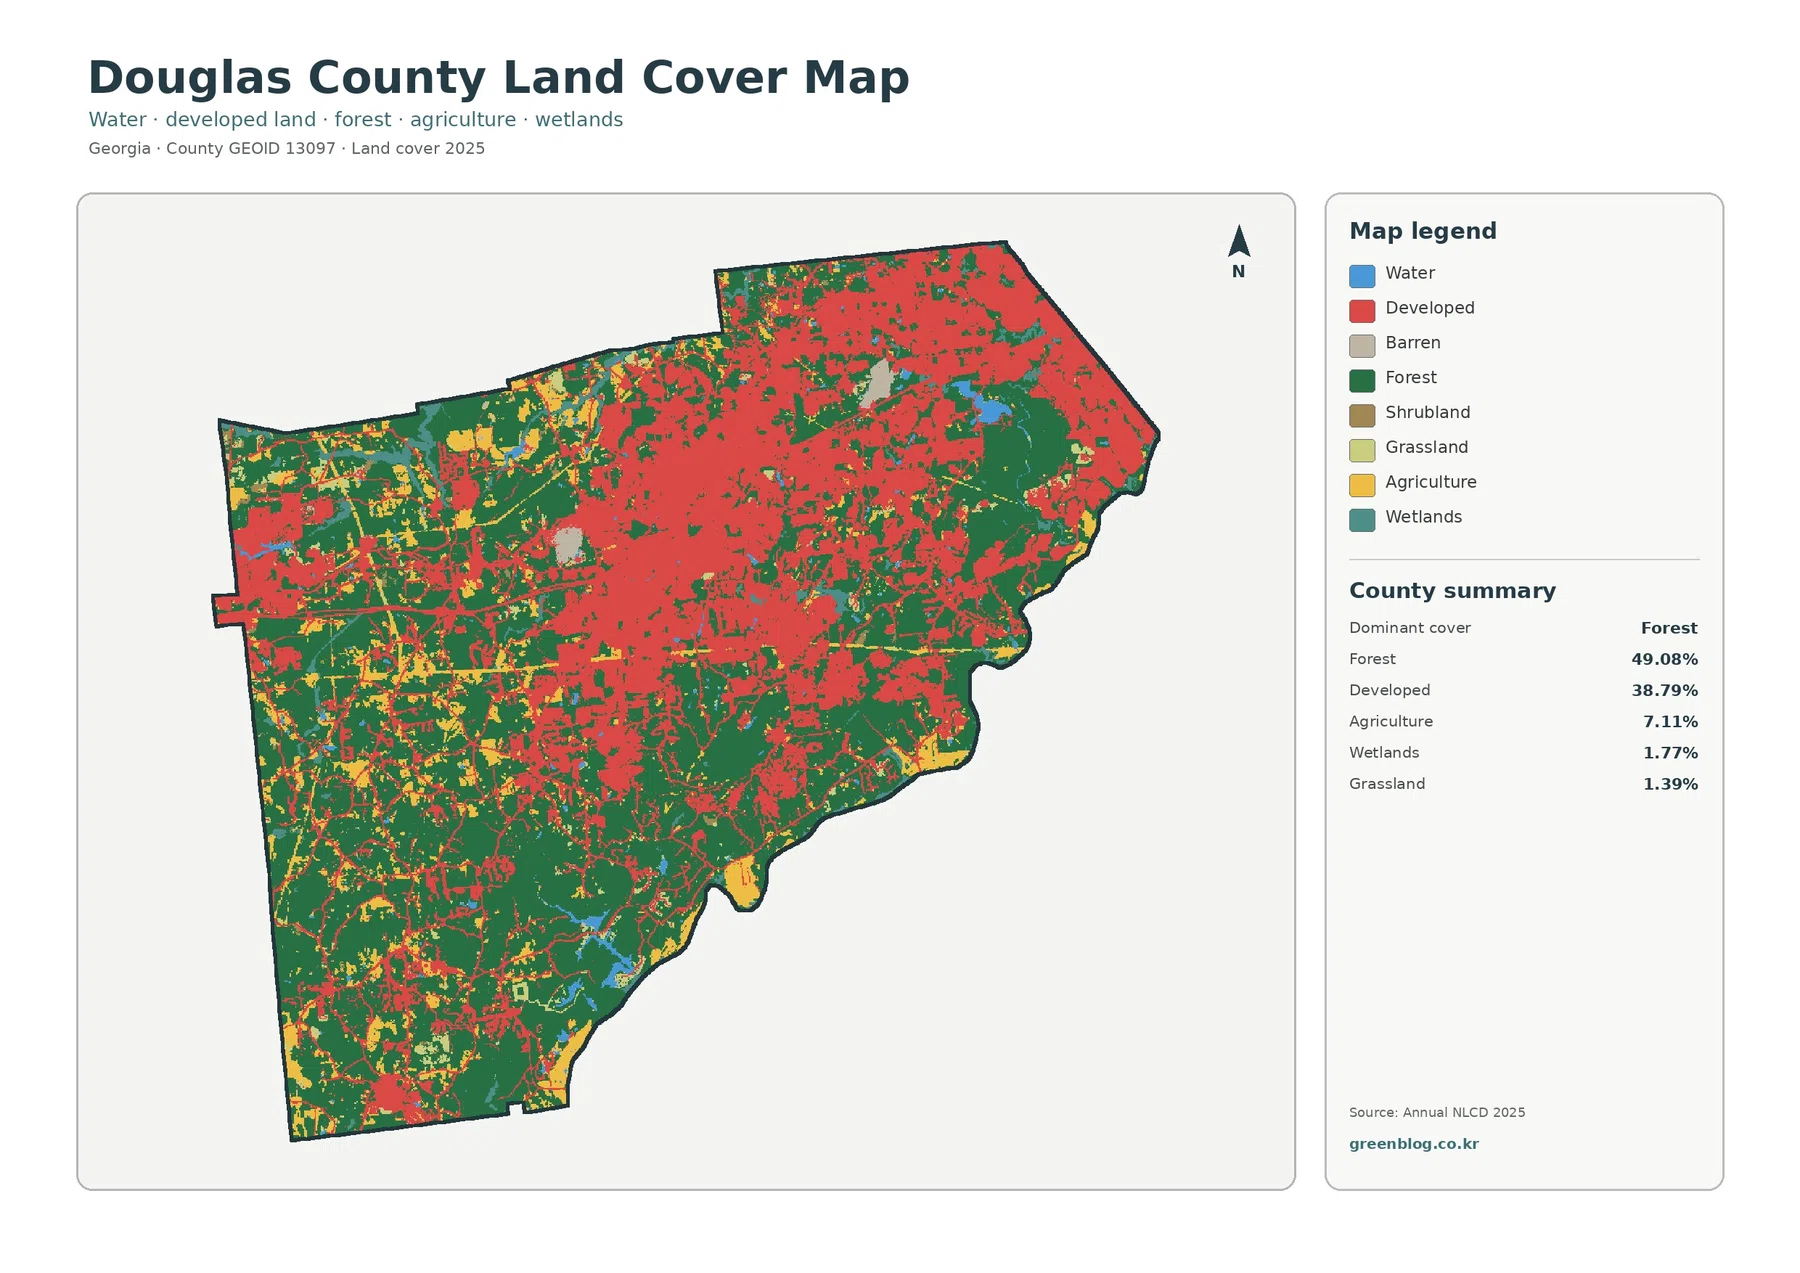
The county summary puts forest at 49.08% and developed land at 38.79%. Agriculture accounts for 7.11%, wetlands for 1.77%, and grassland for 1.39%. Those figures explain why green and red dominate the map. Yellow agricultural areas are visible, especially away from the densest eastern development, but they form a much smaller share of the county than either forest or developed cover.
The northeast contains the largest continuous concentration of developed cells. Red also extends through the central part of the county and appears in a separate western concentration. General county geography provides useful context: Douglasville is the county seat, and communities such as Lithia Springs, Austell, Villa Rica, and Winston help orient the eastern, western, and southwestern parts of Douglas County. Because the thematic map does not draw city limits, the red areas should be read as developed surface classes rather than exact municipal footprints.
South of the main built concentration, forest becomes more continuous. Large green areas remain in the southern and southwestern parts of the county, with smaller developed and agricultural patches breaking them up. The transition is gradual rather than a clean urban-rural line. Residential streets, wooded lots, small fields, commercial areas, and forest can all occur close together, and a 30-meter land-cover product simplifies that mixture into dominant classes.
Land cover is not the same thing as legal land use. A developed cell describes the physical surface class detected in the data; it does not tell a reader whether a property is zoned residential, commercial, industrial, or something else. The distinction matters in Douglas County because a developed class can include lawns and tree cover around buildings, while the impervious map isolates hard surfaces more directly.
Forest remains the largest class even in a heavily developed metropolitan county
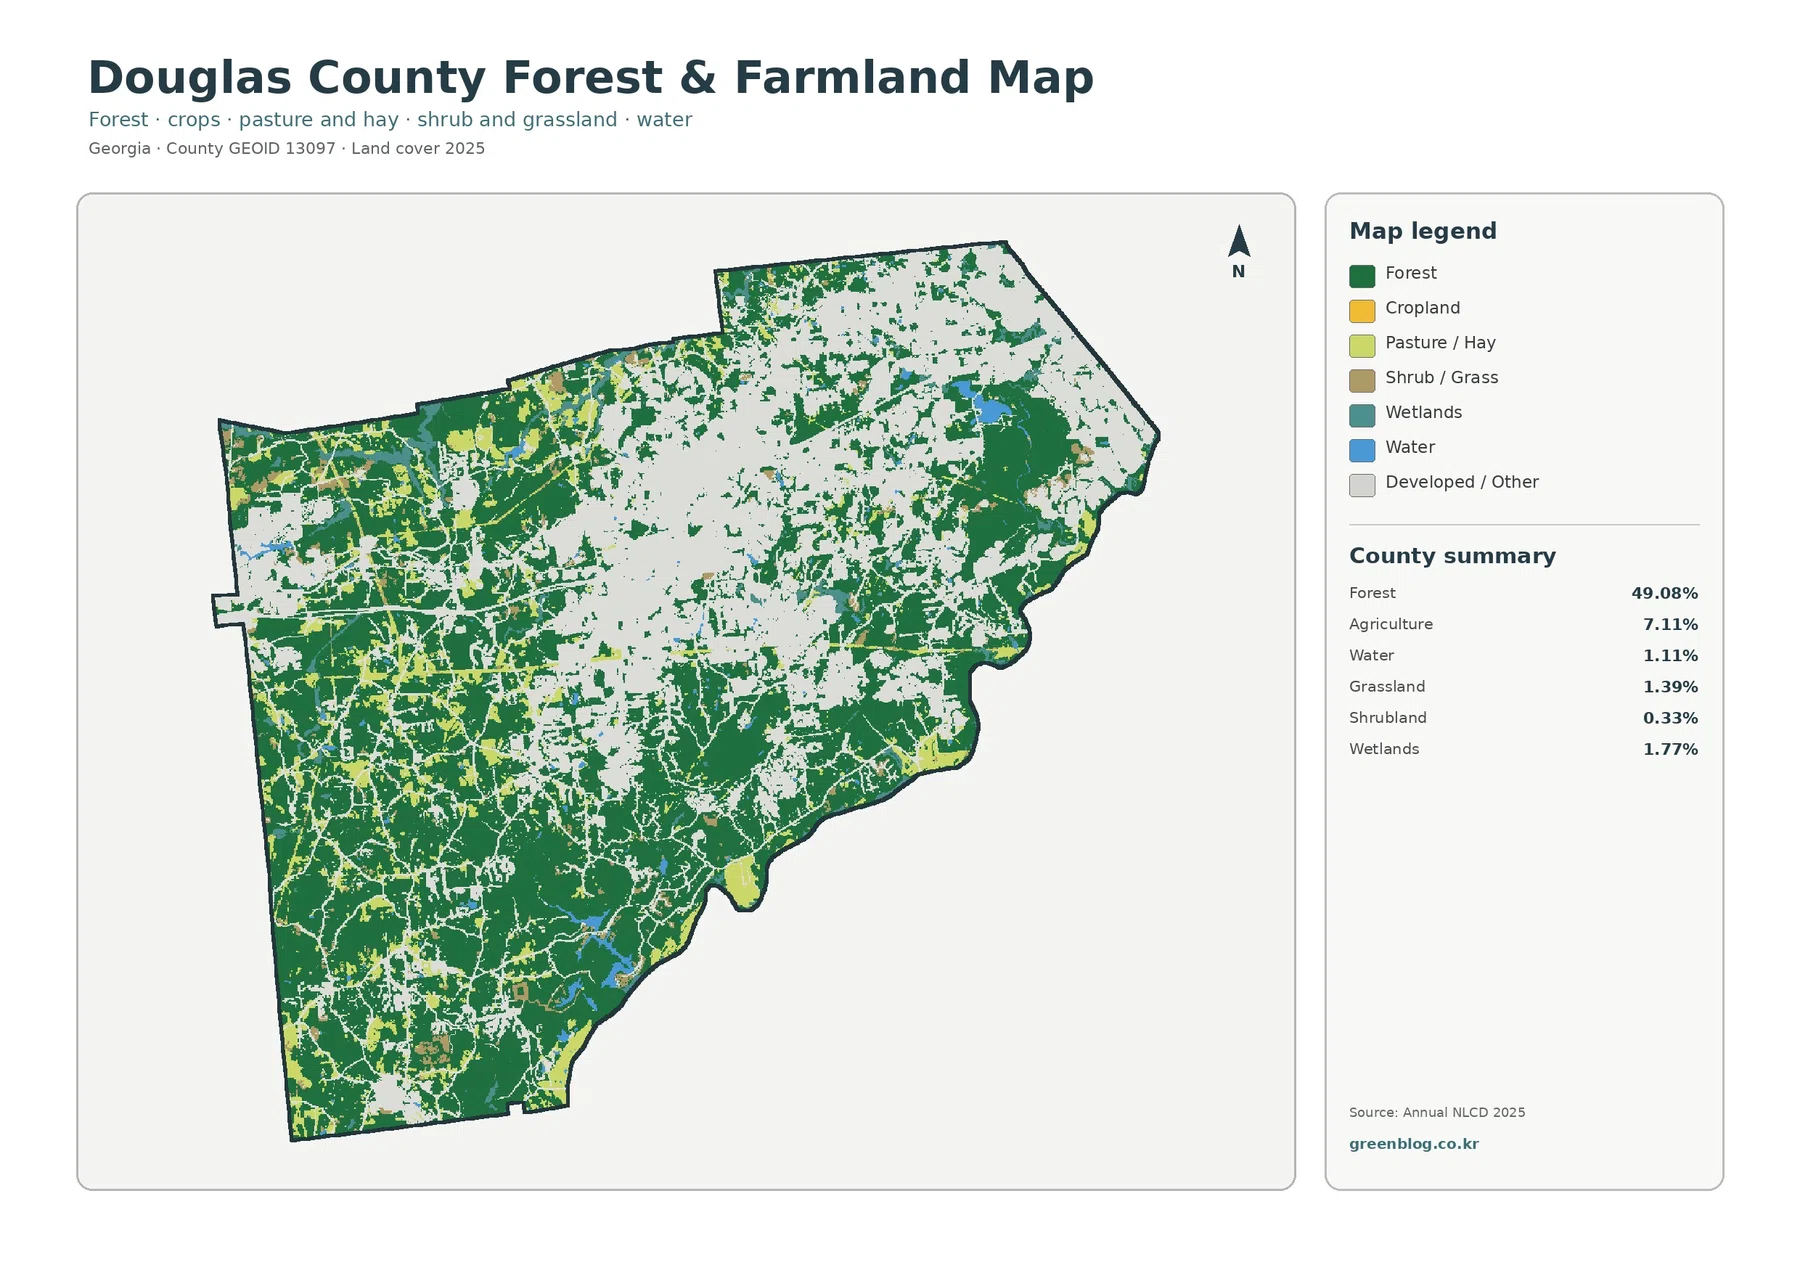
Removing most of the developed-color emphasis makes the county’s remaining forest easier to see. The largest connected forest areas sit in the south and southwest, and substantial green cover also remains along the eastern and southeastern edges. In the northeast, forest is more fragmented by the much denser built pattern, although green patches still appear within and around developed areas.
Agriculture covers 7.11% of the county. It appears as scattered yellow and light-green patches rather than one dominant farming district. The western and southwestern portions contain many of the more visible agricultural pieces, while smaller areas occur elsewhere between forest and development. The map does not identify crops, farm ownership, or field boundaries, so it is best used to show where agricultural cover is more common at a county scale.
Water accounts for 1.11% and wetlands for 1.77%. Those percentages are small in the countywide summary, but narrow water and wetland features can still matter locally. Sweetwater Creek is an important geographic reference in Douglas County, and wooded stream corridors help explain why some green areas remain close to suburban development. A land-cover image can show the broad relationship between these surfaces, but a dedicated hydrography map is better for naming individual streams, reservoirs, and drainage networks.
The forest-and-farmland view is useful when the goal is to discuss habitat context, open land, or the contrast between built neighborhoods and greener surroundings. It also prevents a common reading mistake: assuming that every light area on the general map is undeveloped forest. By separating forest, agriculture, water, wetlands, and developed or other cover, the second map makes the remaining land mosaic much easier to distinguish.
Impervious surfaces reveal where roofs and pavement are most concentrated
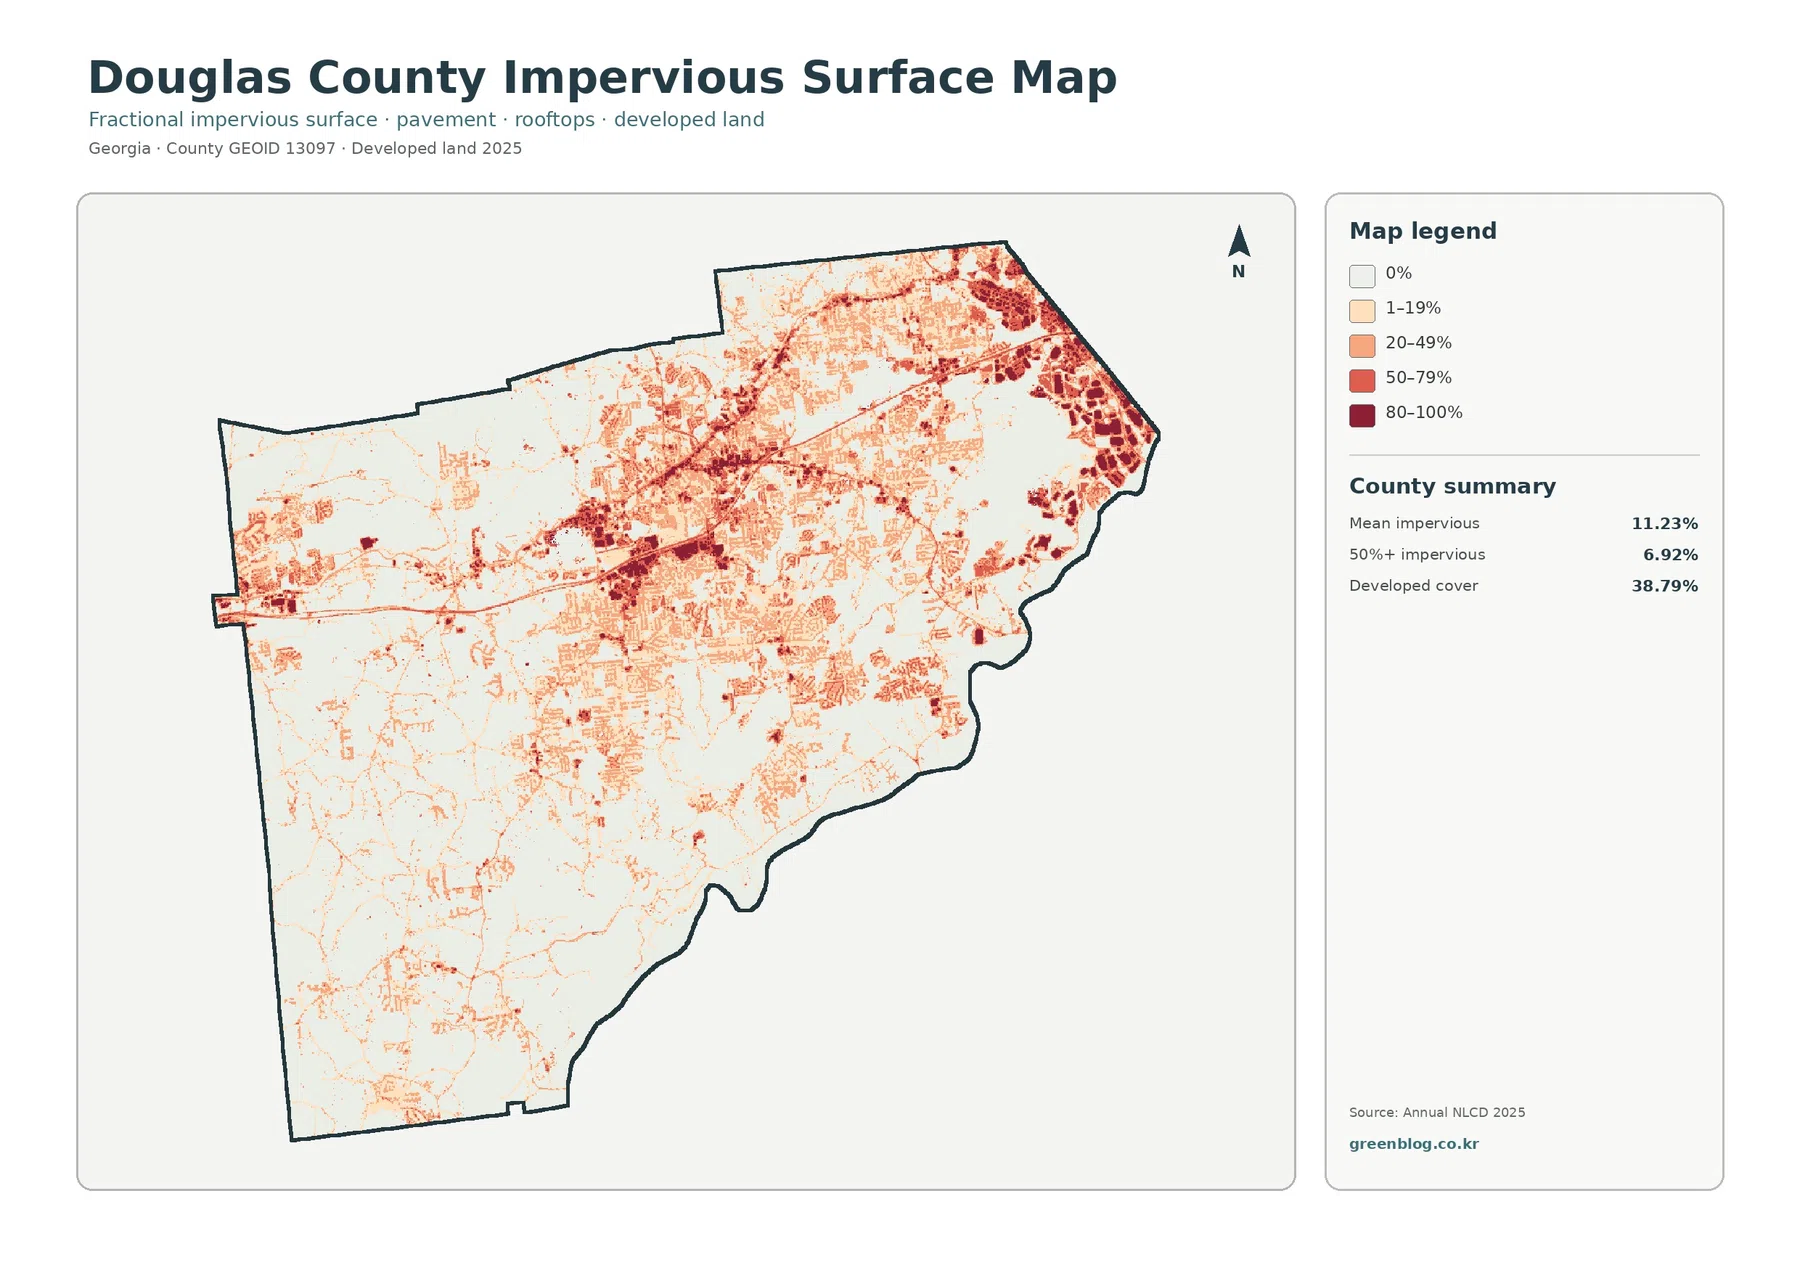
Impervious surface means pavement, rooftops, parking areas, and other materials that do not readily absorb rainfall. Douglas County has a mean impervious value of 11.23%, and 6.92% of the county falls in cells that are at least 50% impervious. Those numbers are far below the 38.79% developed-cover share because the developed land class can contain lawns, trees, soil, and other permeable surfaces around buildings and roads.
The darkest concentrations are strongest in the northeast and through the middle of the county. Several linear features and compact clusters stand out against much lighter surroundings. Interstate 20 crosses Douglas County from east to west and Douglasville serves as the primary county center, which provides geographic context for the broad developed corridor. The map itself, however, does not label road names or individual developments, so it should not be used to identify a specific street or property.
Farther south, the hard-surface network becomes thinner. Bright areas dominate much of the southern half, with narrow lines and small clusters marking local roads and settlements. This change corresponds with the broader forest blocks visible on the previous map. Looking at both images together separates two related but different questions: where land is classified as developed, and where the actual concentration of hard surfaces is highest.
For watershed or stormwater discussions, impervious cover can be a useful screening layer because it shows where rainfall encounters more hard surface. It does not measure flood risk on its own. Slope, soils, drainage infrastructure, rainfall, stream capacity, and many other conditions also matter, so the map should be used as one broad contextual layer rather than as an engineering or hazard determination.
The 1985–2025 comparison is dominated by cells classified as developed
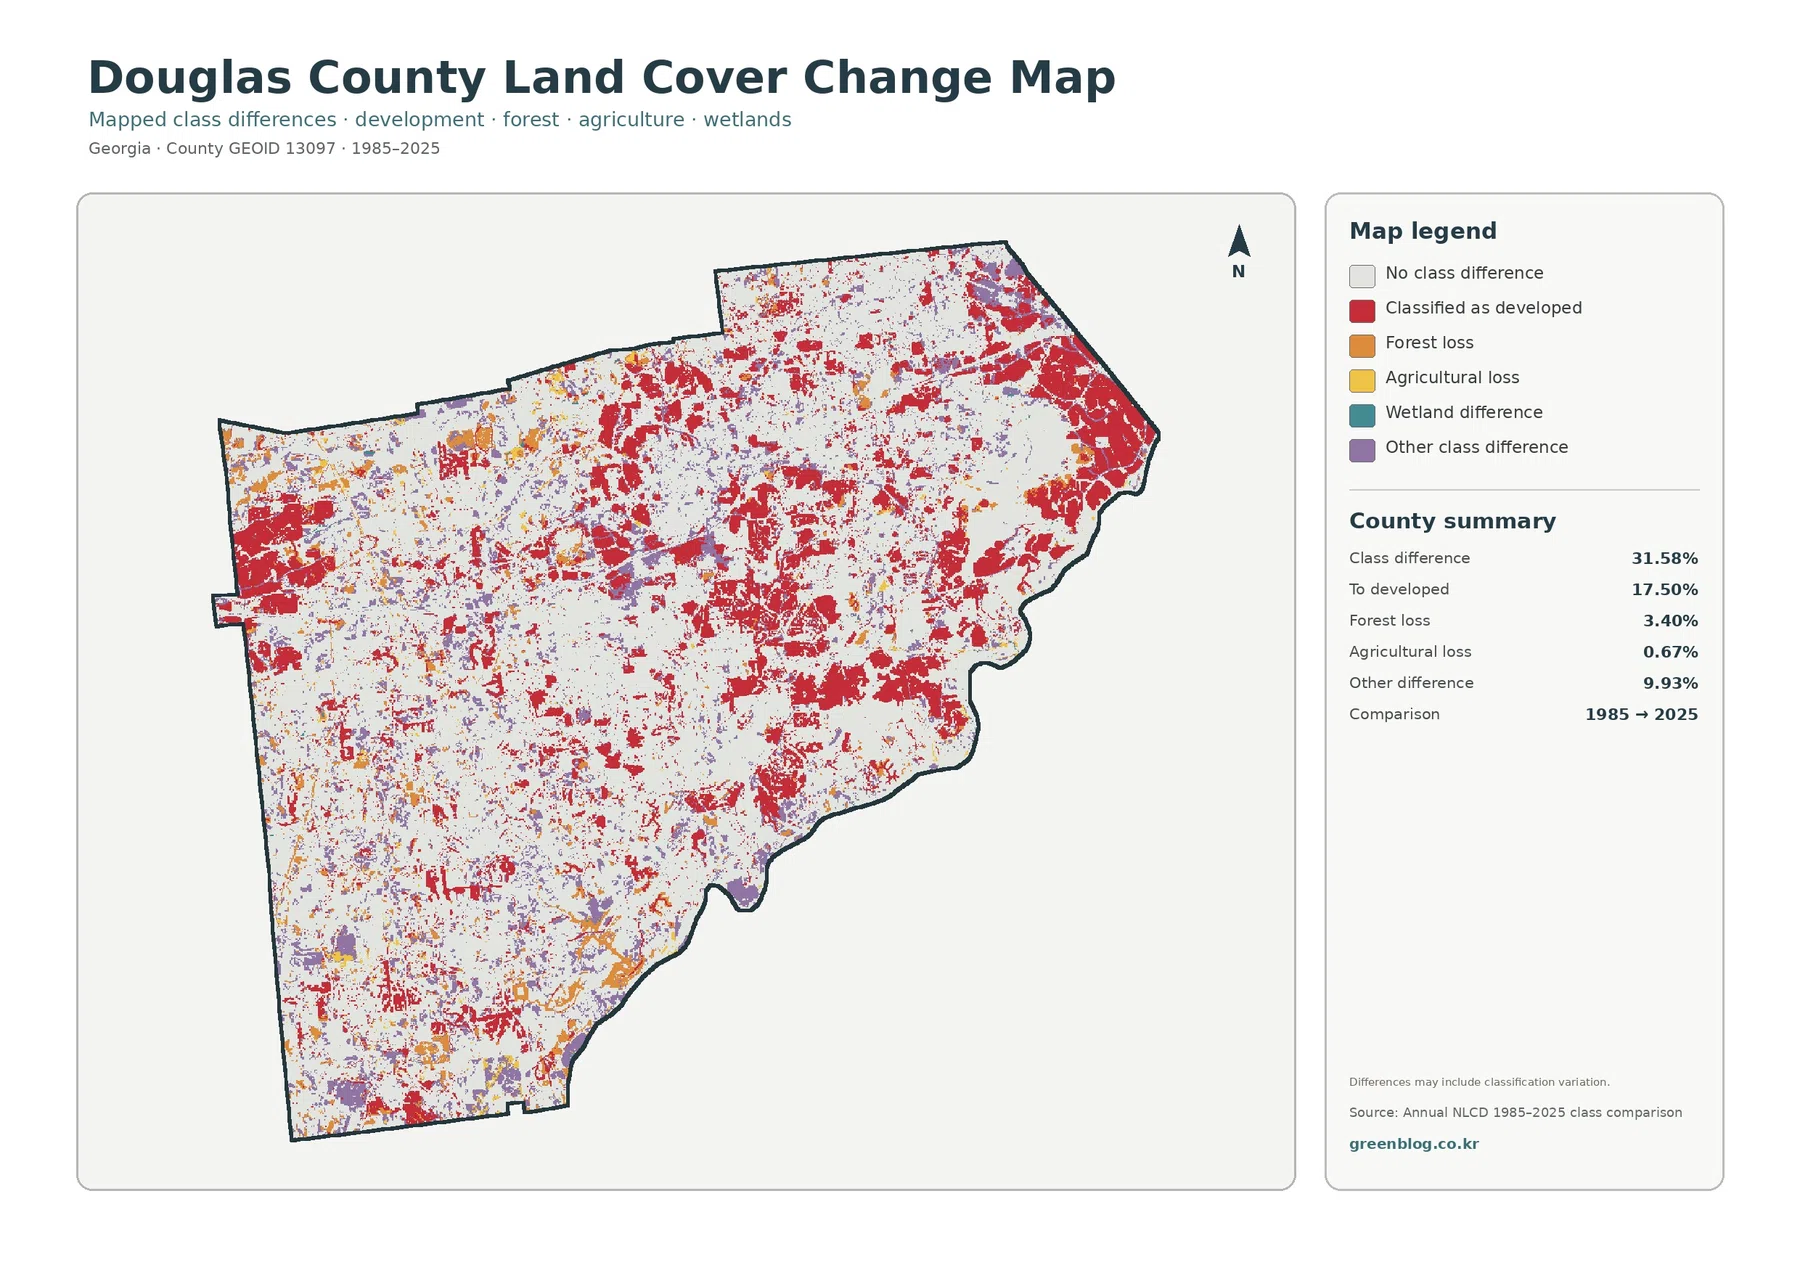
The change summary reports a class difference for 31.58% of the county between the 1985 and 2025 endpoints. Of the county area, 17.50% is shown in the category classified as developed, 3.40% as forest loss, 0.67% as agricultural loss, and 9.93% as other class difference. The light background represents cells that kept the same mapped class at the two endpoints.
Red change cells are widespread through the northeast and central county and also form substantial patches toward the west. That distribution fits the present-day map, where developed cover occupies a large share of the county. Still, the comparison does not say exactly when a cell changed, what project was involved, or what caused the change. It only compares the mapped classes at the two selected years.
The 31.58% total should not be treated as a measure of environmental damage. Endpoint comparisons can contain real landscape change along with classification variation, mixed pixels, and edge effects. A cell on the edge of a forest, road, lawn, or field may receive a different dominant class even when the physical change is modest. Questions about a specific site require intermediate-year imagery, local records, and finer-resolution sources.
A useful way to read this map is to place it beside the 2025 land-cover view. The current map answers what surface class is dominant now, while the change map identifies where the endpoint class differs from 1985. That pairing makes it easier to discuss growth without confusing today’s developed footprint with the portion that changed classification during the comparison period.
What each map contributes to a Douglas County project
The four images are most useful when they are treated as related layers rather than interchangeable graphics. Start with the countywide land-cover map for the broad forest-versus-development balance. Move to the forest and farmland map when vegetation, agriculture, wetlands, or water are the main subject. Use the impervious map for the density of hard surfaces, and reserve the change map for questions that explicitly involve the 1985 and 2025 endpoints.
- County profile: use the 2025 land-cover map to establish the 49.08% forest and 38.79% developed balance.
- Green-space discussion: use the forest and farmland map to compare larger southern forest blocks with fragmented green areas in the developed northeast.
- Built-surface comparison: use the impervious map to distinguish developed land from places where pavement and rooftops occupy a high share of each cell.
- Long-term screening: use the change map to locate broad areas where the 1985 and 2025 classes differ without assuming an exact date or cause.
For a presentation, two well-chosen maps often communicate more clearly than four small panels. A current land-cover map paired with the impervious map works well for explaining the present built pattern. A current map paired with the change map is better when the subject is long-term conversion. The full four-map set remains useful when readers need to move from the countywide overview to increasingly specific questions.
Reading limits matter at neighborhood and parcel scale
Annual NLCD products generalize the landscape into raster cells, which are square grid units. A cell can contain trees, a house, a driveway, grass, and a drainage ditch at the same time, yet the classification assigns a dominant class. That is why boundaries on the map should not be expected to follow property lines, road edges, or small habitat features exactly.
The 2025 maps represent the supplied observation year. Construction, vegetation recovery, timber activity, road work, or water changes after that observation may not appear. Likewise, the 1985–2025 comparison summarizes two endpoints rather than every event that happened during the forty-year interval. For current planning or site questions, recent aerial imagery and local government records should take priority.
Douglas County’s official geographic context also helps prevent overreading. Douglasville is the county seat, Interstate 20 provides a major east-west connection, and Sweetwater Creek is a recognizable natural feature, but none of those labels are embedded in these thematic images. Use a road, municipal, or hydrography reference beside the land-cover set whenever exact names and boundaries are important.
Four original JPG maps in one download
The ZIP contains one original JPG for 2025 land cover, forest and farmland, impervious surface and developed land, and 1985–2025 land-cover change. Each image is 2480 × 1754 pixels. The package does not identify the files as meeting an A3 high-resolution reference, so users planning large-format printing should test the output at the intended size first.
Frequently Asked Questions
Why is developed cover 38.79% when mean impervious cover is only 11.23%?
Developed land can include lawns, trees, soil, and other permeable surfaces around homes, businesses, and roads. Impervious cover measures the harder portion such as rooftops and pavement, so the countywide mean is much lower than the full developed-class share.
Does the 31.58% class difference mean nearly one-third of the county was damaged?
No. It means the mapped class at the 2025 endpoint differs from the 1985 class for 31.58% of the county. The total includes cells classified as developed, forest loss, agricultural loss, other class differences, and possible classification variation. It is not a direct measure of damage or a record of every event during the period.
Can I use these maps to locate the exact Douglasville boundary or a specific I-20 interchange?
No. The maps are thematic land-cover graphics and do not draw municipal limits, parcel lines, or named roads. Use a current administrative or transportation map when exact city boundaries, interchanges, addresses, or property locations are required.
Sources and Reference Data
- MRLC Annual NLCD Data – official access point for annual land-cover and related products
- USGS Annual NLCD Land Cover Classification – definitions and guidance for forest, developed, agriculture, wetlands, and related classes
- U.S. Census Bureau TIGER/Line Shapefiles – official county-boundary reference for Douglas County
- Douglas County Official Overview – county information for location and local context
- Douglas County Travel & Tourism – local information for Sweetwater Creek State Park and other county destinations
Map File Information
The ZIP contains four original JPG maps for comparing Douglas County forest, developed land, agriculture, impervious surfaces, and mapped 1985–2025 class differences.
- Included Files: General land cover, forest and farmland, impervious/developed surface, and land-cover change maps
- File Type: Four original JPG map files bundled in one ZIP archive
- Intended Use: Printing, education, presentations, and map-based projects
Related Maps
- Appling County Georgia Land Cover Map
- Atkinson County Georgia Land Cover Map
- Bacon County Georgia Land Cover Map
Green Map creates custom-edited map images using open geographic data sources such as geoBoundaries, Natural Earth, OpenStreetMap, and government open data. These maps are edited visual materials, not raw data files, and are provided for education, documents, presentations, and graphic reference.