Download the Bibb County map set on this page as four high-resolution A3 JPG files: a county reference map, a town-connection map, a water map, and an elevation map. Bibb County lies in central Alabama, where the Cahaba River winds through wooded ridges and tributary valleys, while Centreville and Brent provide the clearest central reference points. West Blocton and Woodstock extend the settlement pattern northward. The separate sheets make it easy to compare towns, main roads, named waterways, and terrain on screen or in an A3 print without crowding every detail onto one image.
A useful way to get oriented is to find Centreville and Brent first, then follow U.S. 82 east and west and Alabama 5 toward the north. From there, the Cahaba River gives the county a second visual backbone: tributaries enter from wooded hollows, and lower valley ground contrasts with higher ridges to the north and east. The separate sheets keep these details readable instead of stacking roads, town labels, streams, and terrain colors on a single crowded image. Readers can move from general location to town spacing, water, and relief without losing the county boundary as a reference.
Table of Contents
Centreville, Brent, and the Main Road Network
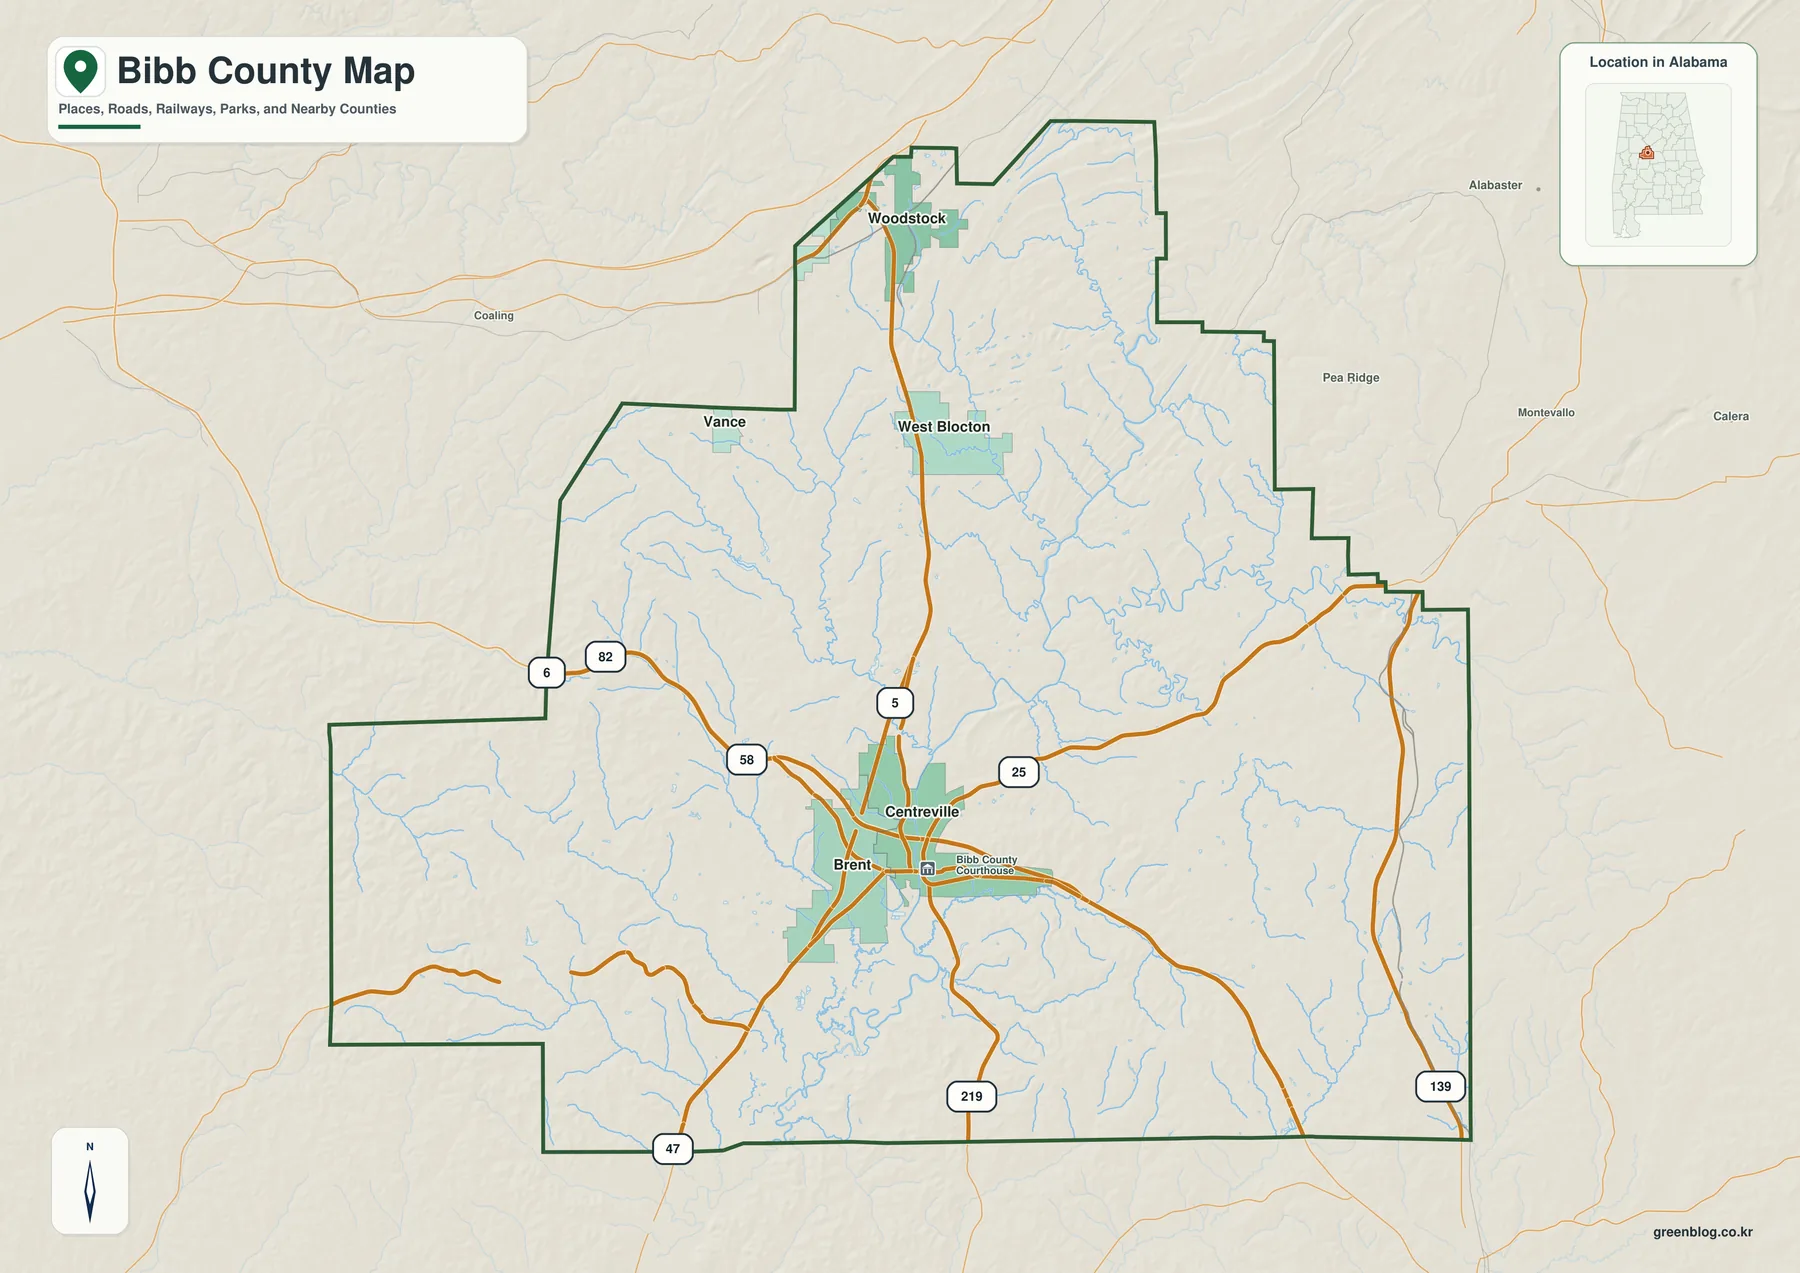
The county reference map is easiest to read from the middle outward. Centreville is marked with the courthouse symbol, identifying its role as the county seat, and Brent lies immediately to the west. Their developed areas appear close together, but the labels remain separate so the map does not blur the distinction between the two municipalities. West Blocton is farther north, and Woodstock lies near the narrow northern reach of the county. Those four places create a simple sequence that explains why Bibb County feels more elongated than a quick glance at its irregular boundary might suggest.
U.S. 82 is the main east-west road across the central part of the county. It enters from the west, passes through the Brent-Centreville area, and continues toward the eastern boundary. Alabama 5 provides the strongest north-south connection on the map, running from the central area toward West Blocton and Woodstock. Alabama 25 extends east from Centreville, while Alabama 219 leads toward the south. Additional route shields for 6, 47, 58, and 139 help show where secondary approaches connect Bibb County with surrounding areas.
Neighboring county labels are important because communities near the edge often depend on roads that cross jurisdiction lines. Jefferson County lies to the north; Shelby and Chilton are on the eastern side; Perry is to the south; and Hale and Tuscaloosa are to the west. Woodstock and other northern communities make more sense when viewed in that wider transportation setting. The pale developed-area shading is only a broad visual reference. It is not an incorporated-city boundary, a zoning layer, or a parcel map, and the road network does not attempt to show every local street, closure, bridge restriction, or current maintenance condition.
Town Spacing from Brent
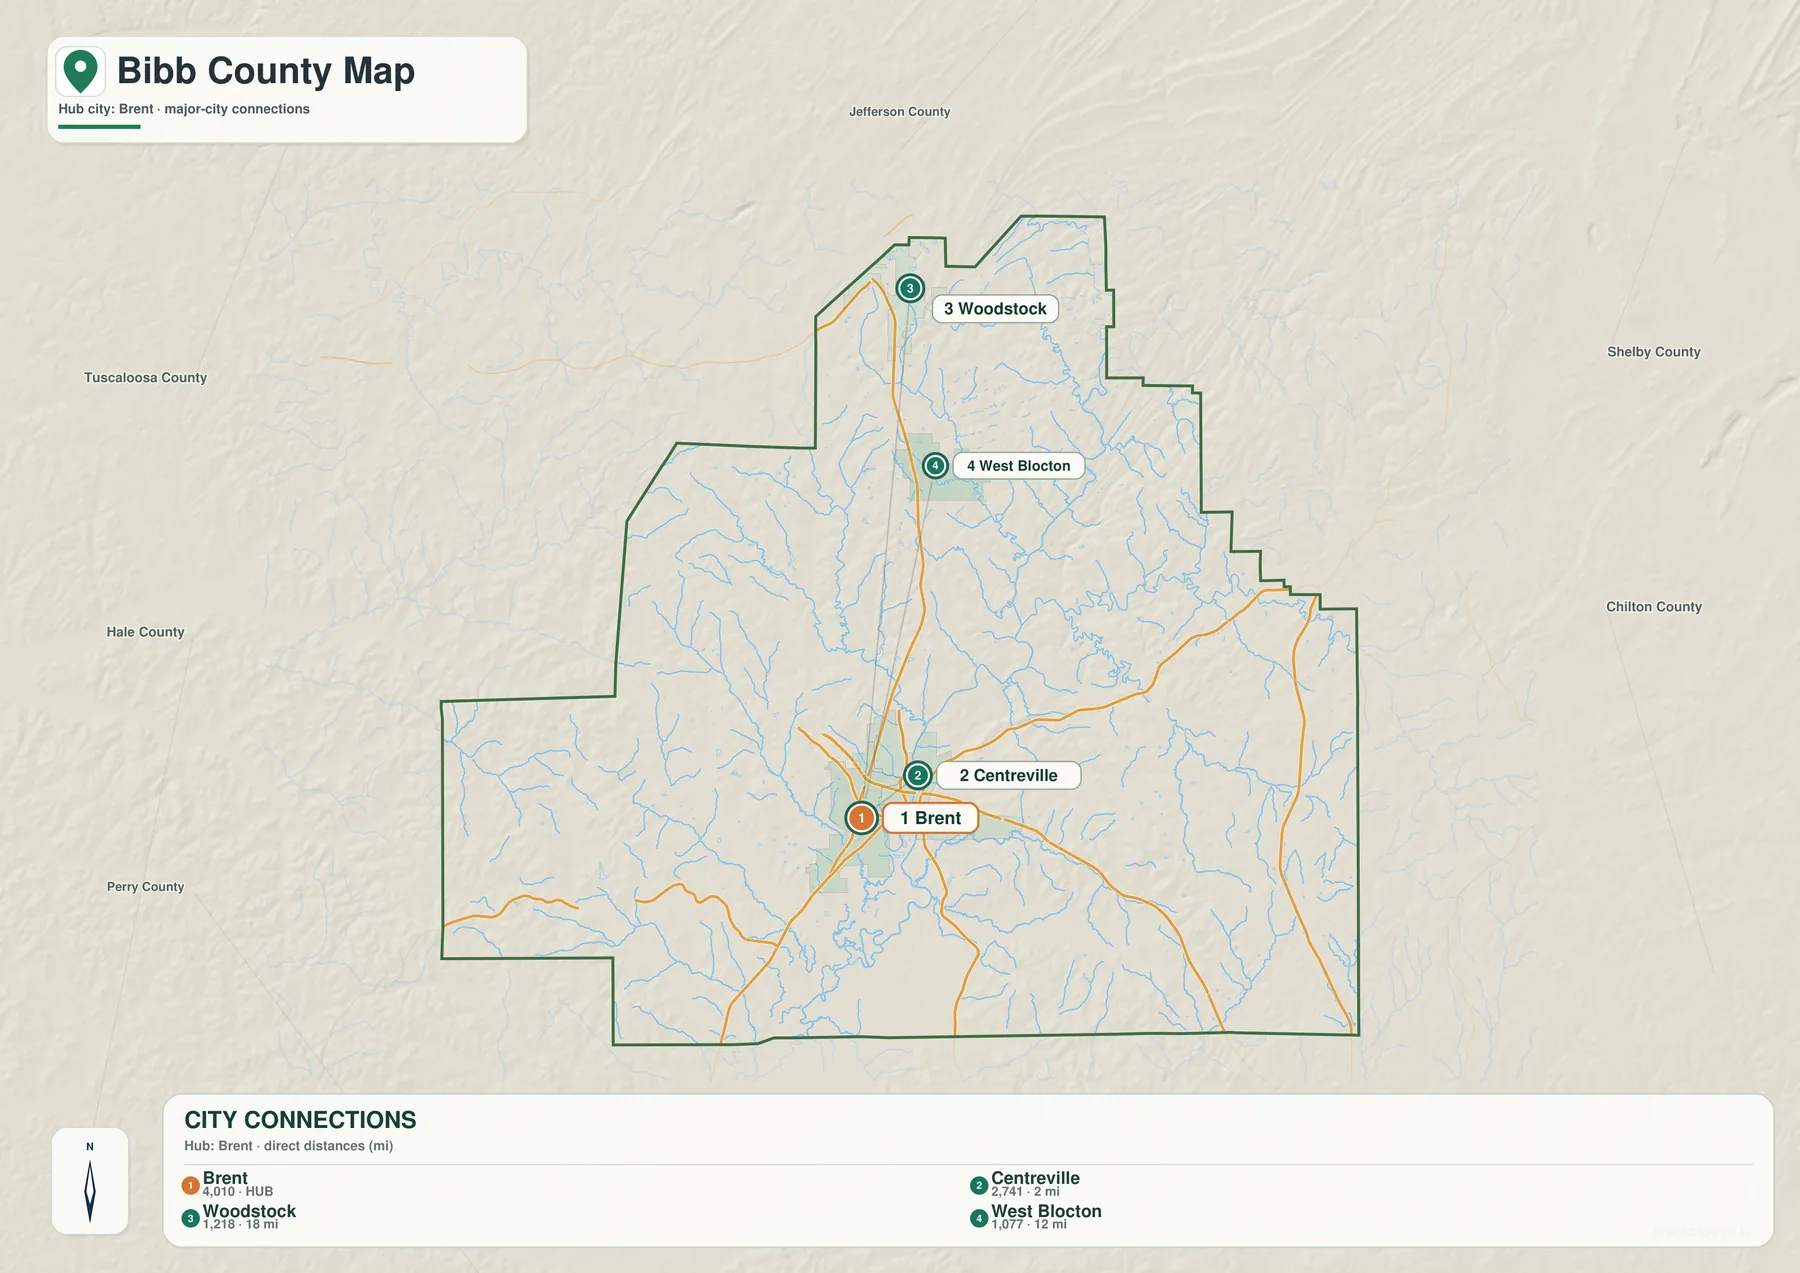
The city-connection sheet uses Brent as its hub and compares it with Centreville, West Blocton, and Woodstock. The legend shows reference populations of 4,010 for Brent, 2,741 for Centreville, 1,218 for Woodstock, and 1,077 for West Blocton. Those figures explain the labels and relative emphasis used in the graphic; they should not be treated as a substitute for the newest official population estimate. Anyone researching current demographics should check the latest Census release and make sure the geographic definition matches the town or area being studied.
Centreville is labeled 2 miles from Brent, West Blocton 12 miles, and Woodstock 18 miles. These are straight-line measurements between representative points, not driving distances. Actual road mileage can be longer because routes bend around ridges, approach bridges at particular crossings, and start or end at addresses that do not sit at the mapped town point. The numbers therefore work best as a quick comparison of relative spacing rather than as travel-time estimates or a suggested driving sequence.
The strongest message on this sheet is the contrast between the close Centreville-Brent pair and the two northern towns. Centreville and Brent nearly share the same central position at county scale, while West Blocton and Woodstock occupy separate points along the long northern portion of Bibb County. Smaller communities are intentionally omitted to keep labels legible at print size. Their absence does not mean they fall outside the county; local trip planning and detailed settlement research require a fuller road or Census map.
Cahaba River and Tributary Valleys
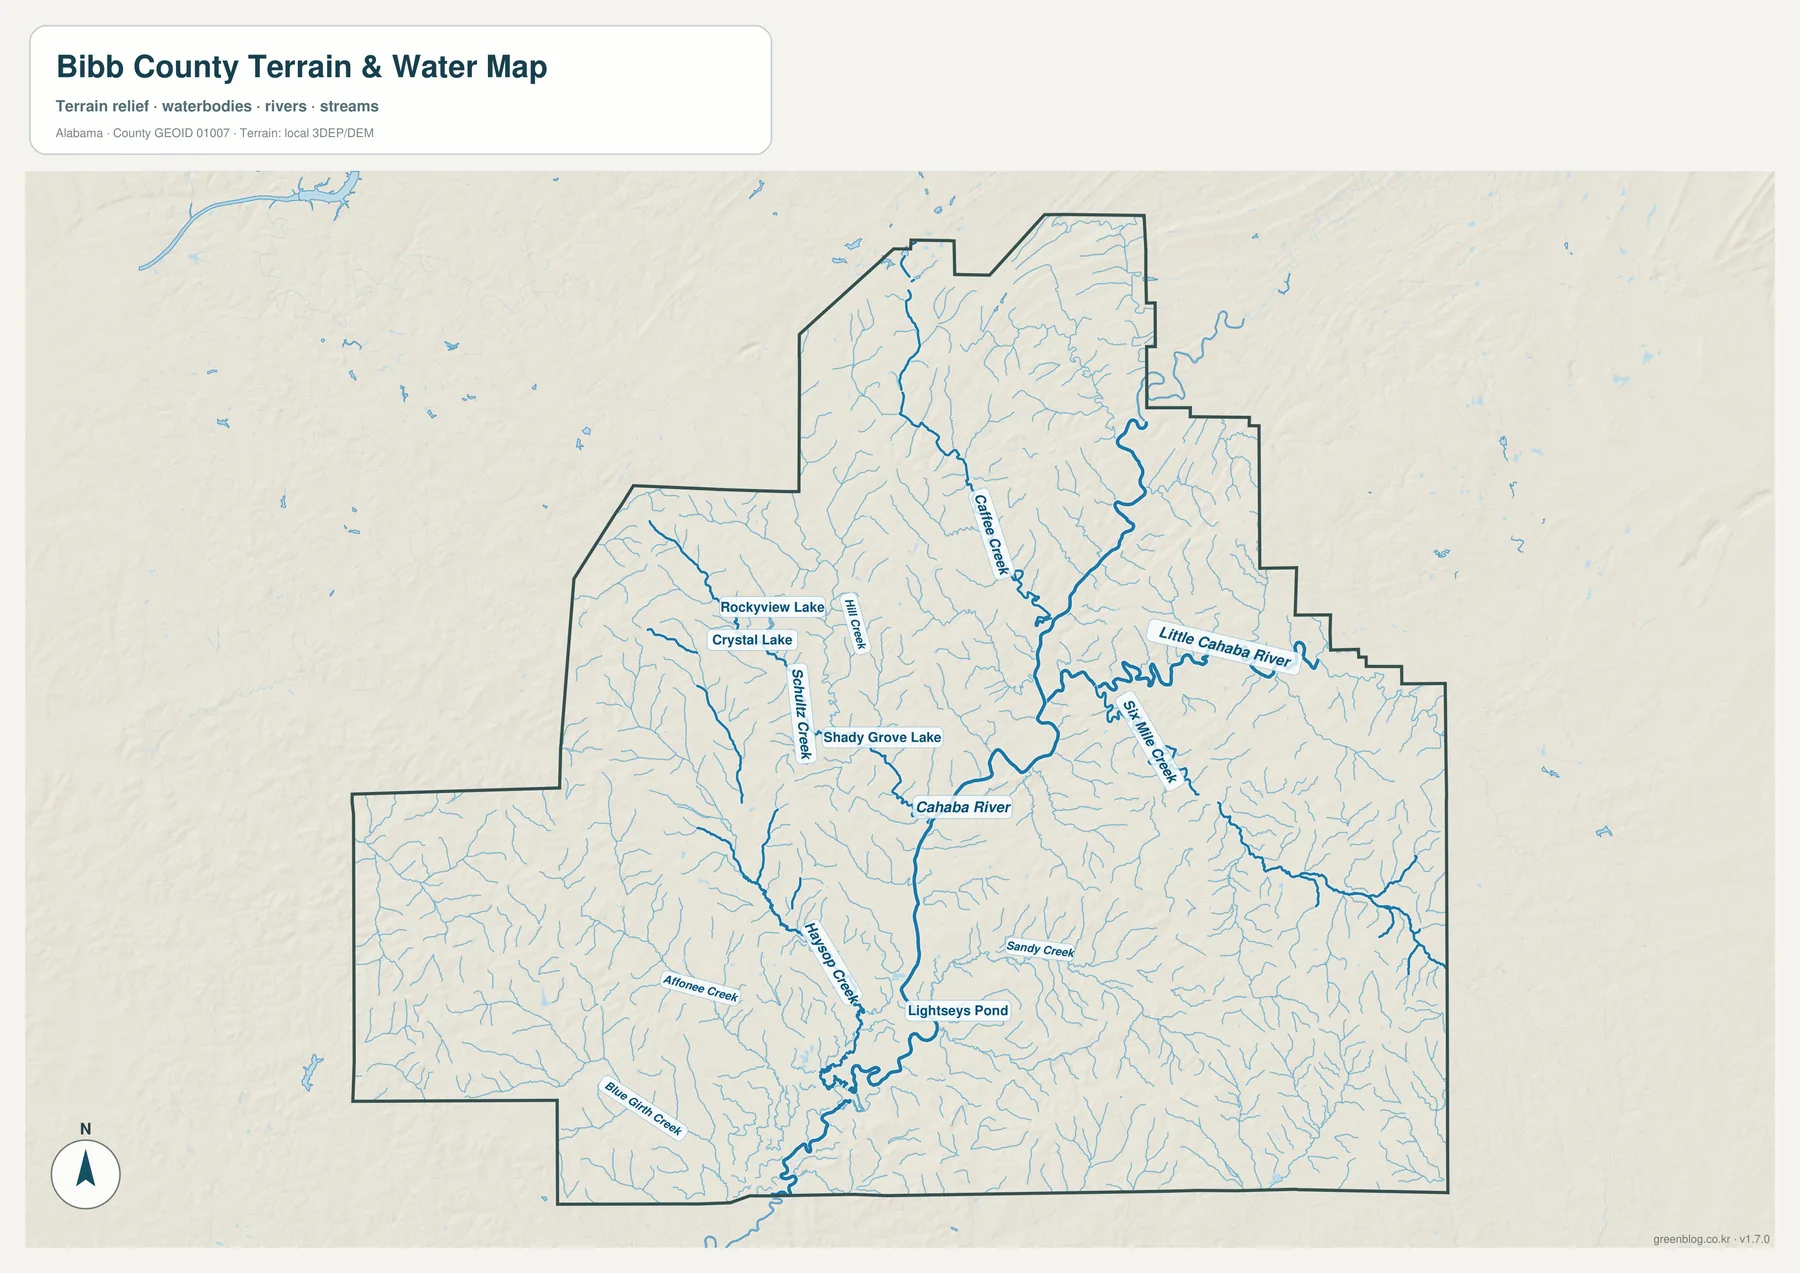
The Cahaba River is the dominant water feature on the county sheet. It enters from the northeastern side, bends through the central part of Bibb County, and continues south through a broad low corridor. Little Cahaba River approaches from the east, with Sixmile Creek also contributing to the eastern drainage network. Caffee Creek follows a long north-central valley, while Schultz Creek and Hill Creek spread across the western side. Their positions show how water from many short ridge slopes eventually gathers into larger valley channels.
Farther south, Maehop Creek, Sandy Creek, Altoona Creek, and Blue Girth Creek add another group of branches. Rockyview Lake, Crystal Lake, Shady Grove Lake, and Lightseys Pond appear as smaller reference features between the larger streams. The map is selective rather than exhaustive, so unnamed ponds, seasonal channels, wetlands, and minor drainage features may not appear. Visitors interested in the Cahaba River National Wildlife Refuge should use the refuge’s official information for current boundaries, access rules, facilities, and notices.
The blue lines are meant to answer a location question: where are the major named streams and how do they relate to the larger Cahaba system? They do not report current depth, river stage, water quality, navigability, public access, or safe crossing conditions. The sheet also does not establish official flood zones, wetland jurisdiction, property rights, or parcel-level flood probability. Insurance, engineering, development, and safety decisions require current hazard products, hydrologic observations, land records, and site-specific investigation.
Cahaba Lowlands and Wooded Ridges
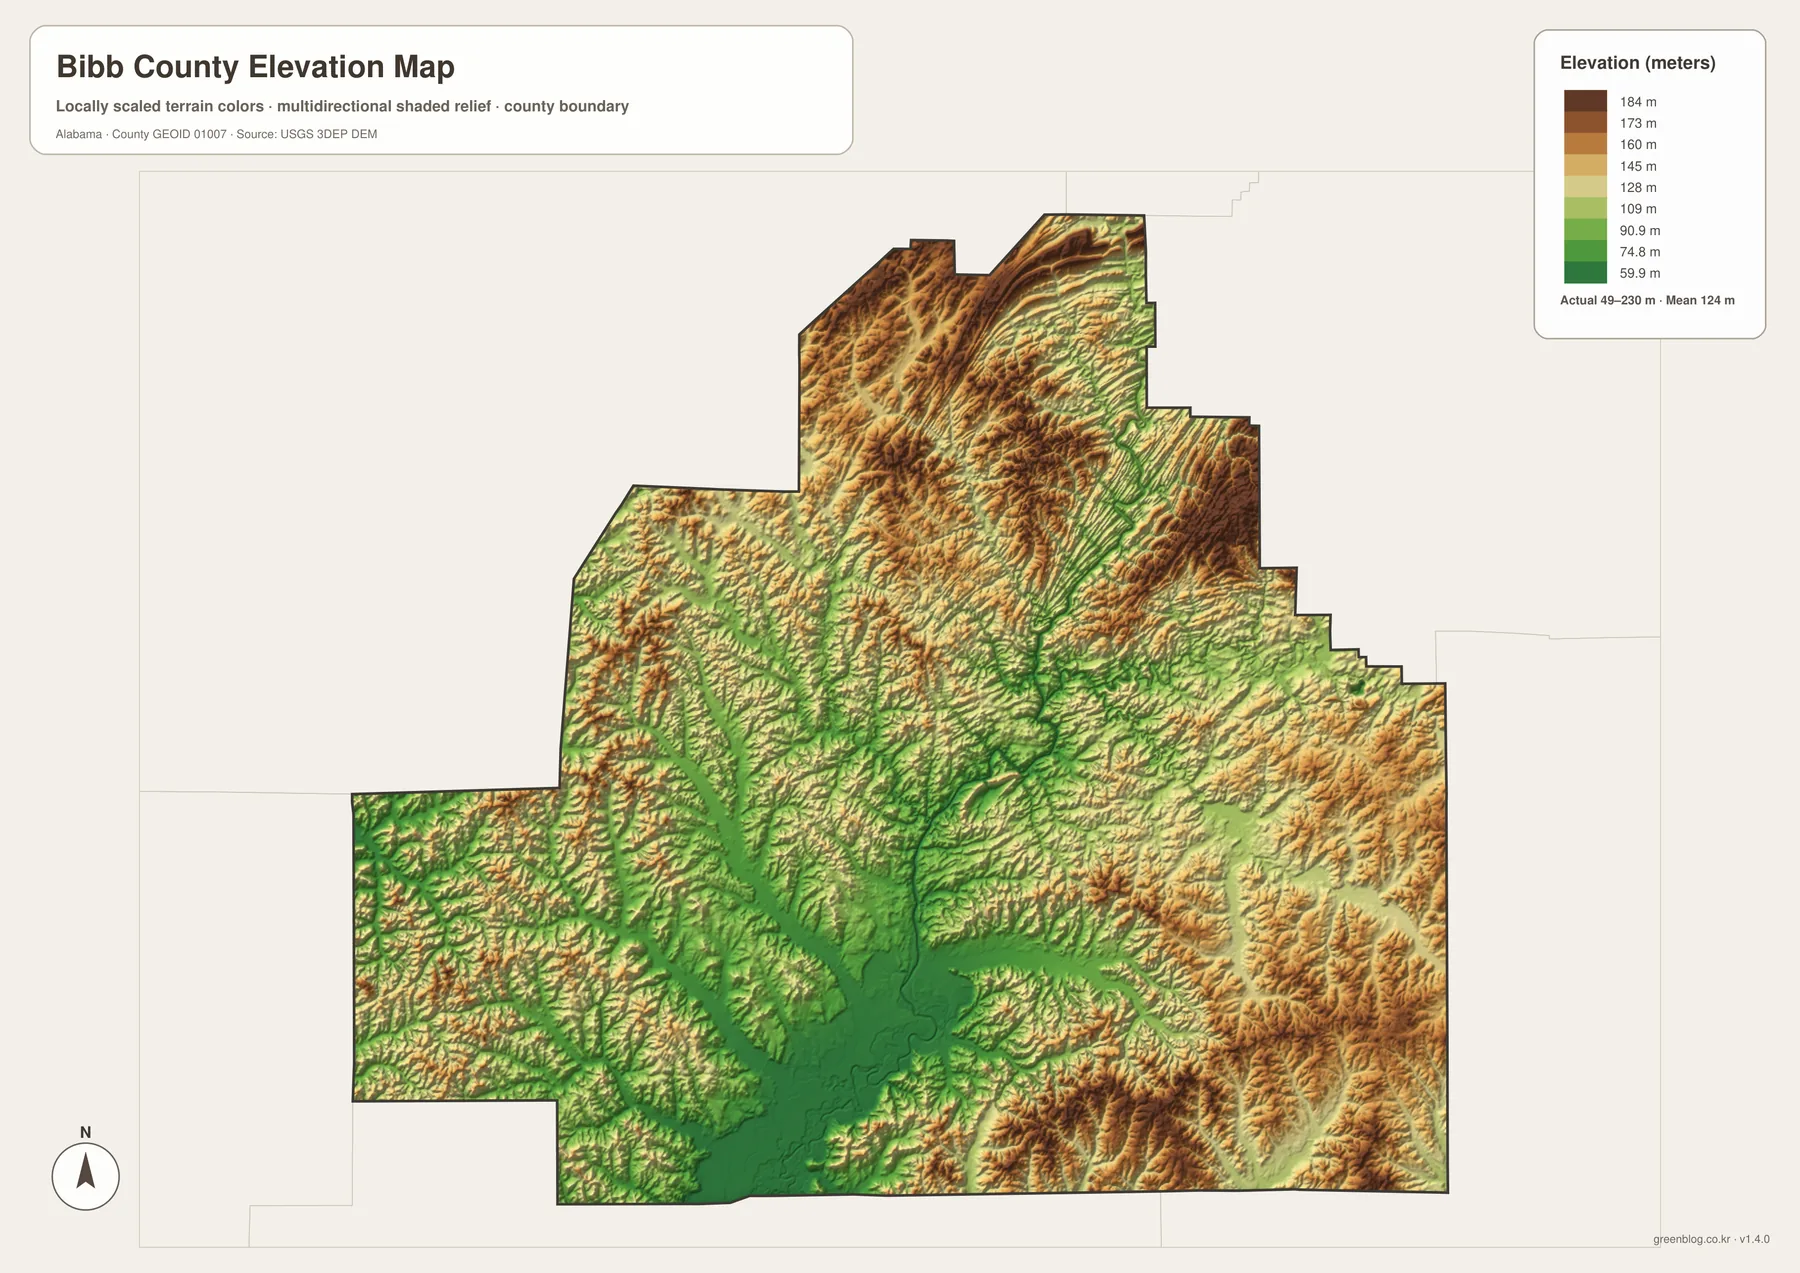
The elevation map reports a range of about 49 to 230 meters, with a mean near 124 meters. Greens mark relatively low terrain, while tan and brown areas rise above the main valleys. The broadest low area follows the Cahaba through the central and south-central county. In the north and northeast, repeated narrow ridges produce a much denser pattern of higher ground, and elevated terrain also continues along the eastern and southeastern side. This contrast gives the county a clear valley-and-ridge character even without detailed contour lines.
Comparing the elevation sheet with the water map makes those colors easier to interpret. The Cahaba occupies the widest low corridor. Little Cahaba River and Caffee Creek follow narrower green valleys between higher ridges, and smaller western and southern creeks use branching hollows of their own. The same terrain helps explain why roads between nearby points do not always follow straight lines. Routes may need to stay in gentler valleys, work around steep or elongated ridges, or reach a practical stream crossing before continuing toward the destination.
The color breaks are tuned to make differences inside Bibb County easy to see. A green or brown shade on another county map may correspond to a different absolute elevation, so cross-county comparisons should use the numeric scale rather than color alone. This is also a generalized county-scale terrain surface, not a survey product. It cannot determine the exact elevation of a building site, parcel slope, drainage design, property corner, or flood condition. Those questions call for current source data and qualified site or survey work.
Choosing and Printing the Map Files
Each sheet is designed for a different kind of lookup. Use the county reference map when the first question is where a town, highway, or county boundary sits. The city sheet is better for comparing the relative spacing of Brent, Centreville, West Blocton, and Woodstock. The water map is useful when a location needs to be placed beside the Cahaba or a named tributary, and the elevation sheet adds the distinction between low valley ground and higher ridges. For a project focused on one place, start with the reference map, then compare that same area on the water and elevation sheets.
The downloadable archive contains four JPG images, each measuring 3638 × 2572 pixels in A3 landscape proportion. For an A3 print, choose landscape orientation, preserve the original aspect ratio, and fit the image inside the printer’s usable margins. If the file is reduced to A4 or letter size, preview the result and check that small creek names and route shields remain legible. These are high-resolution raster graphics made for viewing and printing; they are not editable vector boundaries or georeferenced GIS layers for coordinate analysis.
For classroom use, the separation between sheets can be helpful because students can first identify the county’s towns and roads, then compare those locations with drainage and terrain. A presentation can follow the same sequence without covering stream names with road symbols or placing elevation colors behind dense labels. Field travelers can also keep the maps as broad regional context, but current navigation, weather, road status, refuge access, and property information should always come from up-to-date sources.
Frequently Asked Questions
Are the mile labels driving distances?
No. The labels from Brent—2 miles to Centreville, 12 miles to West Blocton, and 18 miles to Woodstock—are straight-line distances between representative points. Road mileage depends on the route, bridges, terrain, and the exact starting and ending addresses.
Which town is the Bibb County seat?
Centreville is the county seat. Brent lies immediately west of Centreville and serves as the hub on the city-connection graphic, but the two places remain separate municipalities.
Can the water and elevation maps show parcel flood risk?
No. They provide county-scale context for waterways and relief but do not model rainfall, live river stage, drainage infrastructure, or parcel-level inundation. Use current official hazard data and site-specific information for insurance, development, or safety decisions.
What is included in the downloadable ZIP?
The archive contains four high-resolution JPG files: a county reference map, a city-connection map, a water map, and an elevation map. Every image is 3638 × 2572 pixels in A3 landscape proportion.
Map File Information
Download Bibb County reference, town-connection, water, and elevation maps as four high-resolution A3 landscape JPG files.
- Included Versions: County reference, city connection, water, and elevation maps
- Printable Size: A3 landscape, 3638 × 2572 pixels each
- File Type: ZIP archive containing four high-resolution JPG images
Related Maps
Official Sources and Bibb County Information
For current government information, population figures, roads, water data, elevation sources, and refuge access, use the official resources below. The maps on this page are designed for readable county-scale reference and printing, so time-sensitive or regulatory questions should be checked against the most recent source material.
- Bibb County Commission official website
- U.S. Census Bureau QuickFacts for Bibb County
- Alabama Department of Transportation county maps
- Cahaba River National Wildlife Refuge
- USGS National Hydrography
- USGS 3D Elevation Program
- Alabama Population Density Map: Urban Clusters, County Totals and a Decade of Change
Green Map creates custom-edited map images using open geographic data sources such as geoBoundaries, Natural Earth, OpenStreetMap, and government open data. These maps are edited visual materials, not raw data files, and are provided for education, documents, presentations, and graphic reference.