Calhoun County in northeastern Alabama brings together a compact urban corridor, a broad river system, and a noticeably higher ridge belt within one county. Anniston and Oxford form the easiest starting point for reading the area, while Jacksonville and Weaver extend the settlement pattern northward, Piedmont sits toward the northeast, and Ohatchee lies closer to the Coosa River side. This page includes map previews for roads, cities, water, and elevation, plus a downloadable ZIP with high-resolution A3 JPG files for printing, classroom work, presentations, or general reference.
Rather than treating each image as a separate illustration, it helps to move through the county in a simple order. First locate Anniston and Oxford and notice how the main roads spread from the southern part of the county. Then compare the other communities, follow the Coosa River and Choccolocco Creek systems, and finish with the elevation map to see why the eastern side looks so different from the lower western terrain.
Table of Contents
Use Anniston and Oxford as the main reference points
On the county map, Anniston and Oxford stand out as the clearest pair of nearby communities. Major roads meet and separate around this part of Calhoun County, making the area a practical reference point when you are trying to understand where the rest of the county lies. Jacksonville is farther north, Piedmont is toward the northeast, and Ohatchee sits west of the main southern urban area.
The county boundary is irregular enough that city names alone do not tell the whole story. Looking at roads and boundary lines together makes it easier to judge whether a place is close to the western river side, the eastern ridge country, or the central urban corridor. This is especially useful when comparing Anniston with Jacksonville to the north or Piedmont to the northeast.
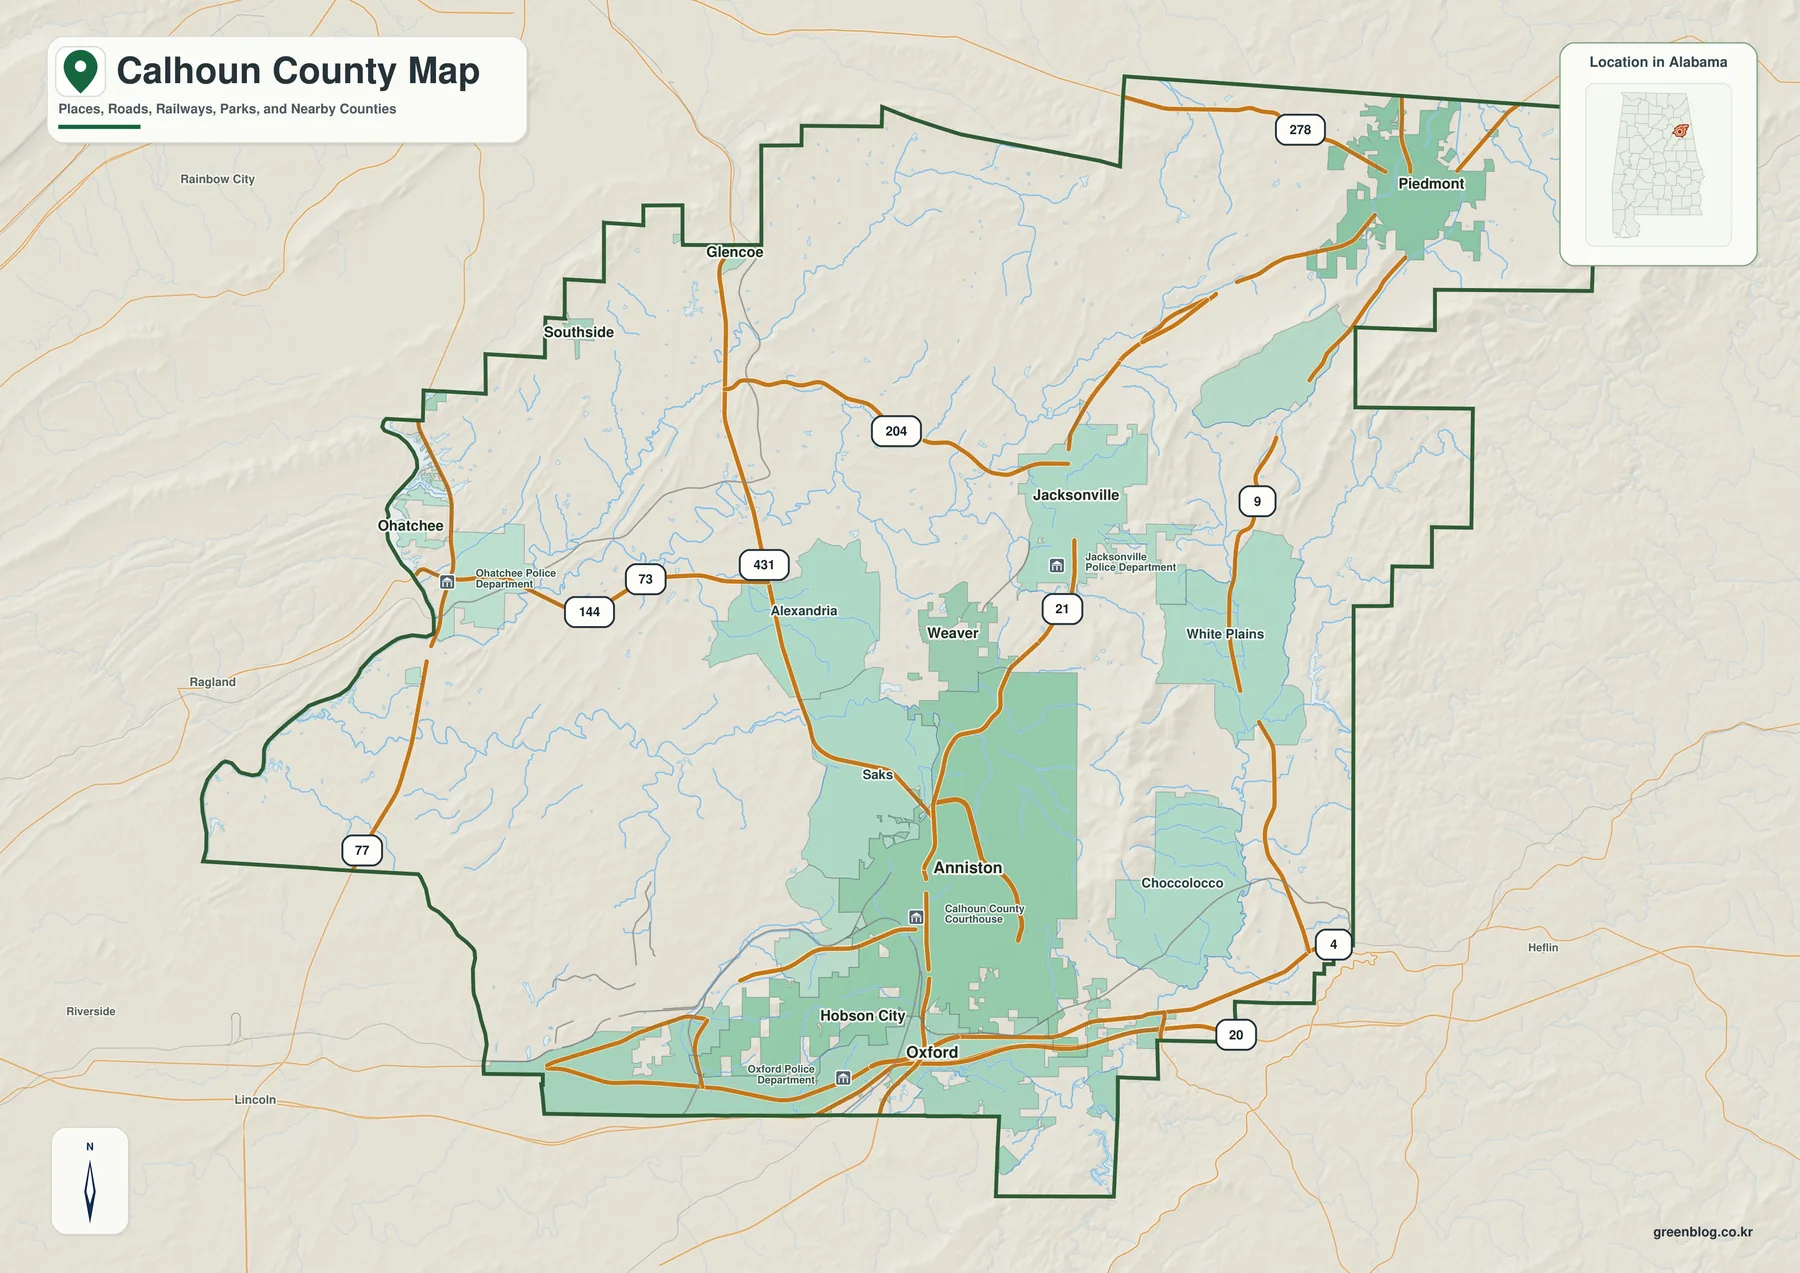
This map is intended for regional orientation rather than turn-by-turn navigation. It can help you identify where a community sits within the county and which major road corridor passes nearby, but current driving directions should still be checked with a road or navigation service when planning an actual trip.
Compare the southern urban area with northern and eastern communities
The city-focused map simplifies the county so the relative positions of Oxford, Anniston, Jacksonville, Piedmont, Weaver, and Ohatchee are easy to compare. Anniston and Oxford are close together in the south. Weaver and Jacksonville continue the pattern northward, while Piedmont is separated toward the northeastern side of the county. Ohatchee provides a western reference point nearer the Coosa River side.
Lines connecting the marked cities are visual guides, not driving routes. Their purpose is to make relative direction and spacing easier to understand. Actual road distance may be longer because highways curve, cross terrain, and do not always follow the most direct line between two places.
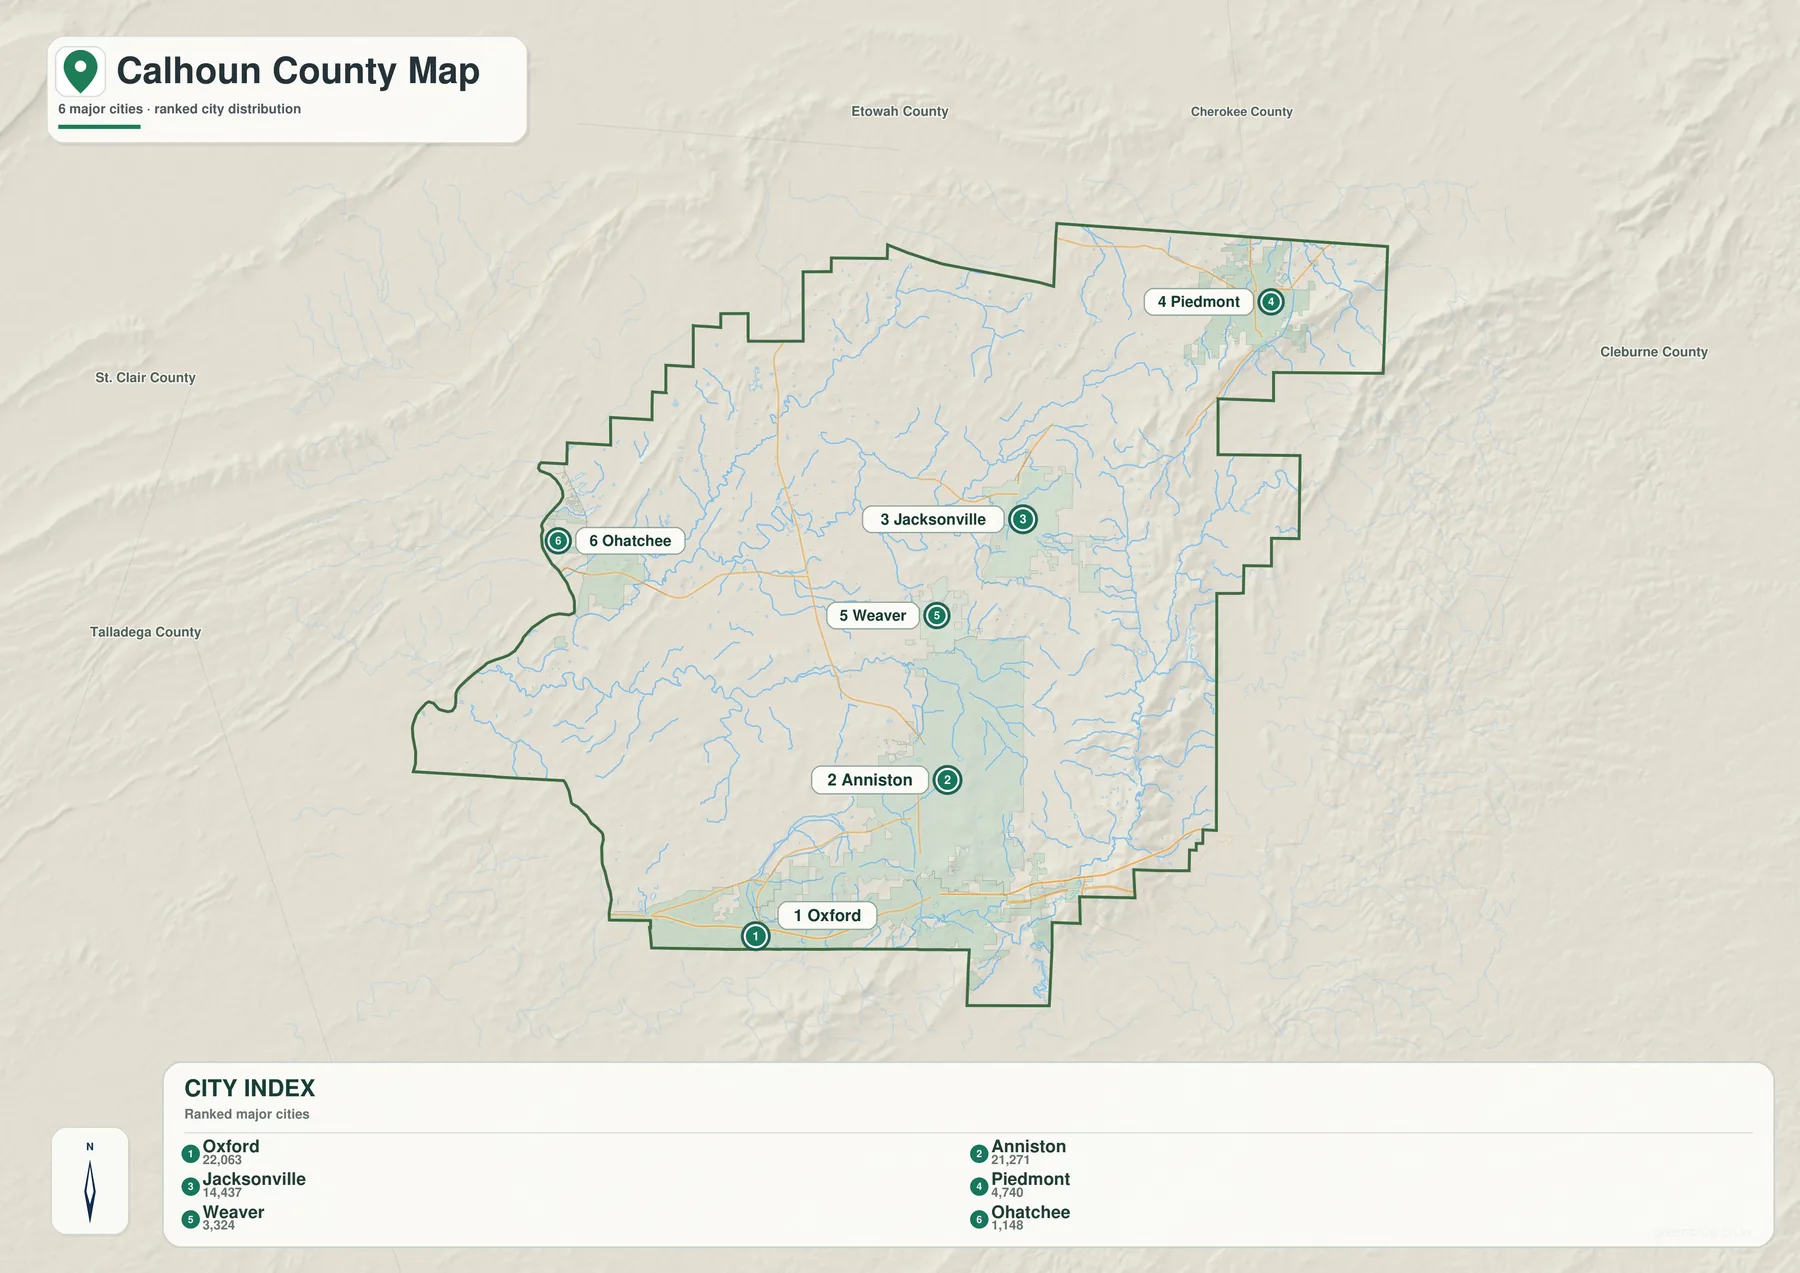
For classroom or presentation use, this simplified view is often easier to explain than the full road map. It shows that Calhoun County does not have a single isolated center; instead, several communities form a north–south pattern while other places sit distinctly east or west of that line.
Follow the Coosa River and Choccolocco Creek systems
Water features create a different set of reference lines across Calhoun County. The Coosa River is the dominant feature on the western side, while Choccolocco Creek and its associated drainage system are prominent farther east. Smaller tributaries spread between them, so the county is crossed by many more watercourses than the largest labels alone might suggest.
Terrapin Creek and named lakes add more detail to the pattern. When these features are compared with the city map, the western position of Ohatchee becomes easier to understand, while the Anniston–Oxford area sits closer to the Choccolocco Creek side of the county. The drainage network also helps explain how water moves away from higher ground toward lower valleys and larger channels.
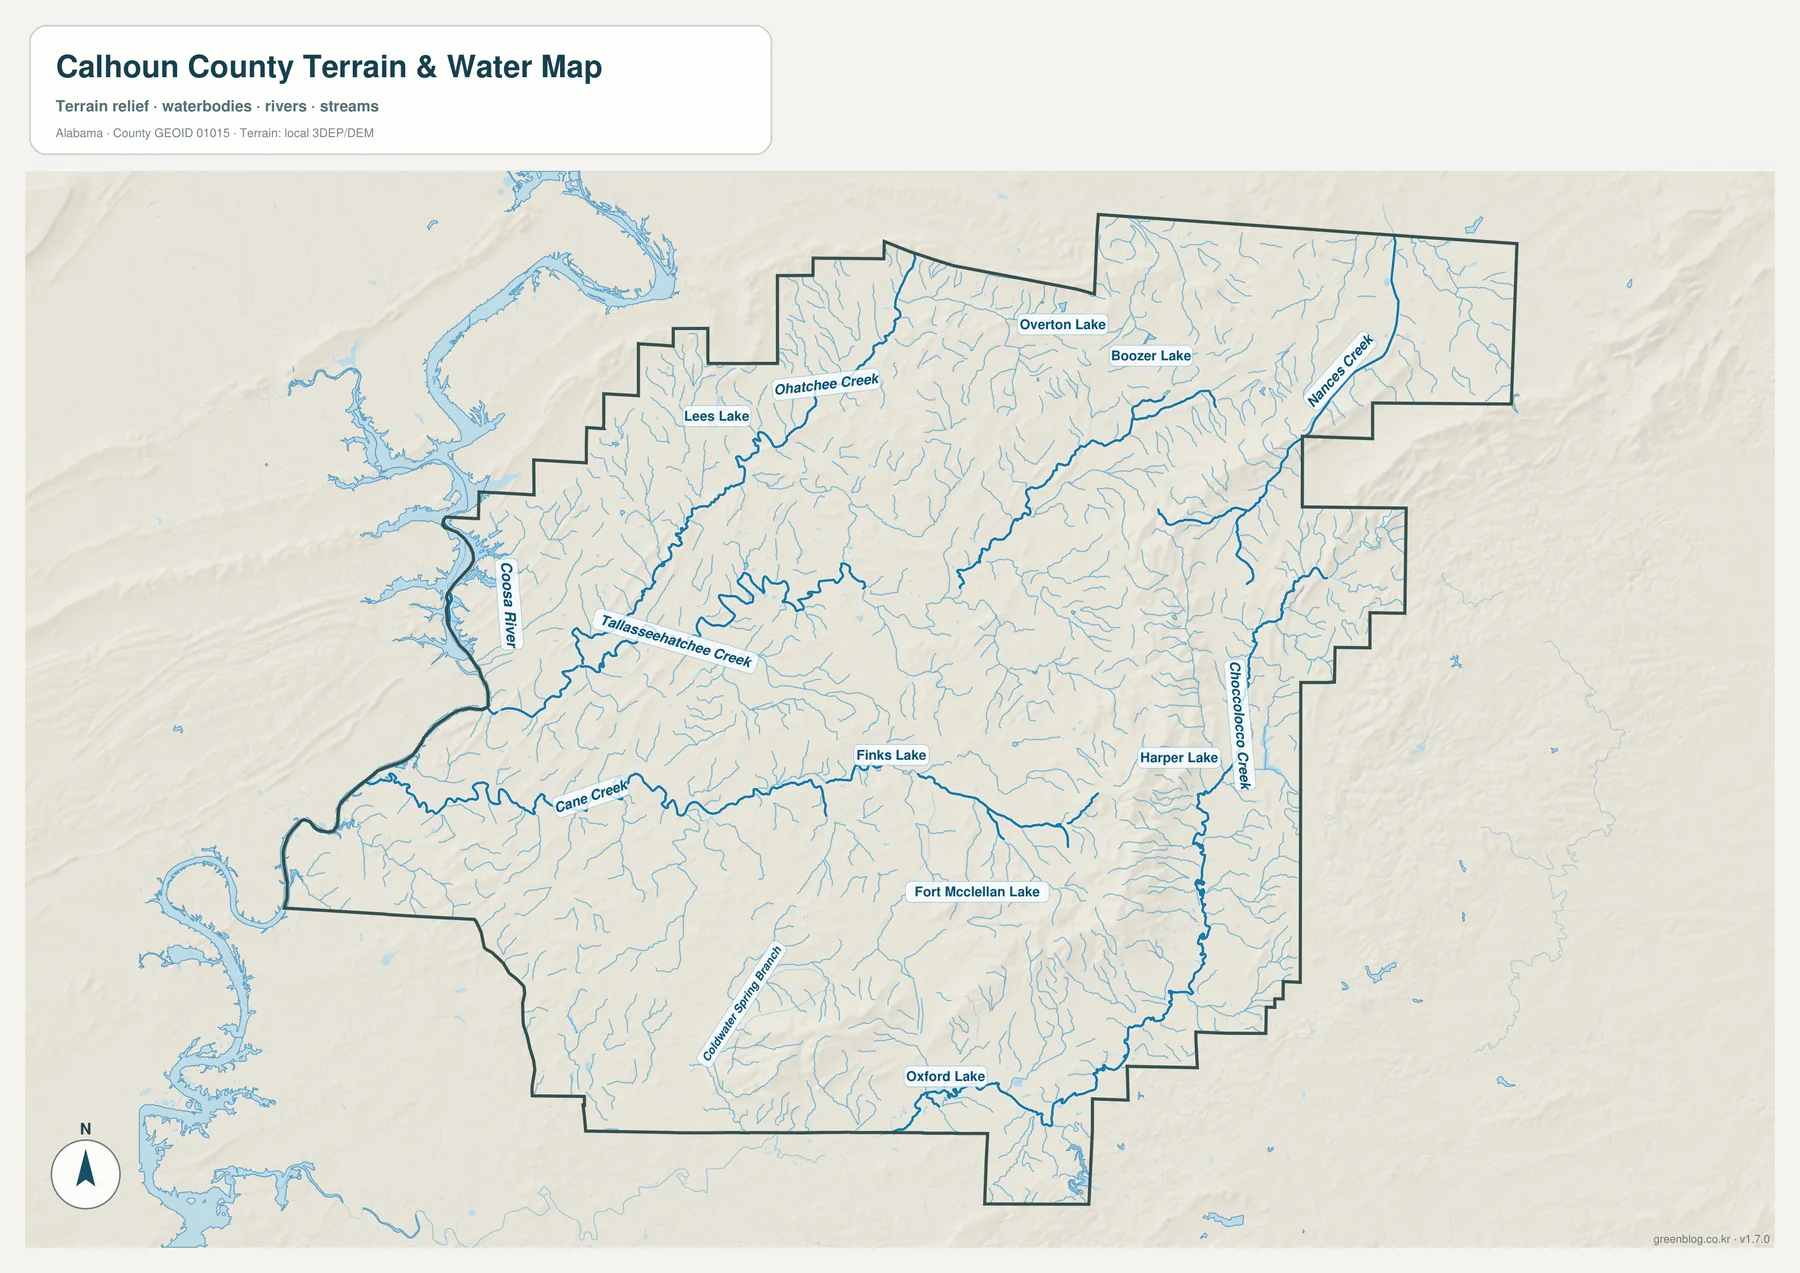
The water map is a location reference, not a flood-risk product. It does not show flood zones, expected inundation, real-time river levels, navigation limits, or property ownership. Those questions require current information from official flood and water-monitoring sources.
See how the eastern ridge belt rises above the west
Elevation creates one of the strongest visual contrasts in the county. A higher ridge belt runs along the eastern side, appearing as a long band of warmer and lighter terrain colors, while much of the west and southwest is lower. The difference is easy to see even without reading individual elevation values because the relief changes across a relatively short distance.
Anniston and Oxford sit close to the transition between the urban corridor and the higher ground to the east. Farther toward Piedmont, the terrain remains visibly uneven. Moving west toward the Coosa River side, the map shows broader areas of lower relief. Comparing this view with the road and city maps adds useful context for why routes and settlements occupy the positions they do.
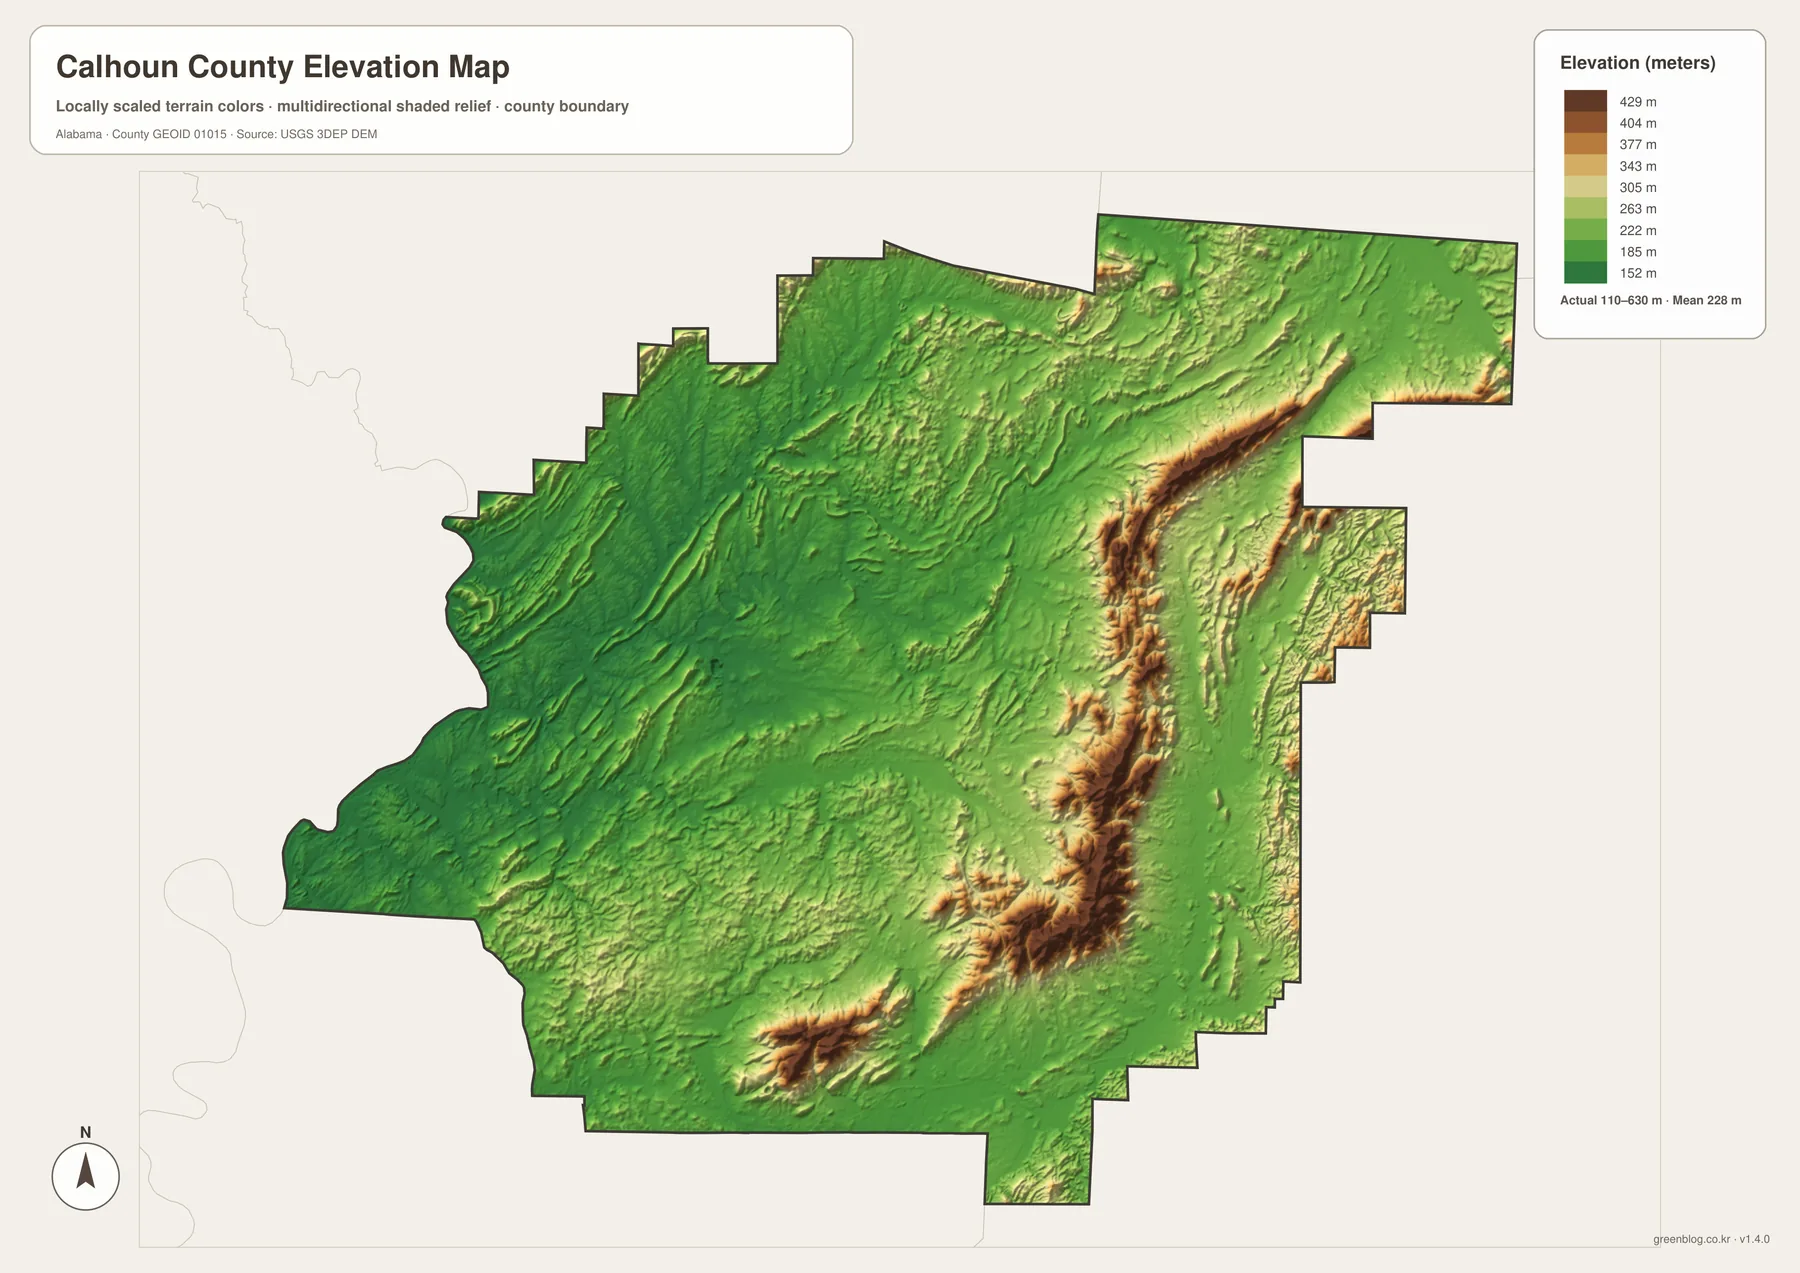
The elevation colors are designed to make relative height differences easy to compare within the county. They should not be used as survey measurements for a specific parcel or structure. Engineering, construction, and boundary work require original elevation data or professional survey information.
Choose the view that fits the question
If you only need to locate a community, start with the county map and use Anniston and Oxford as anchors. For a cleaner comparison of settlement positions, switch to the city map. The water view is better when the Coosa River, Choccolocco Creek, tributaries, or lakes are the focus, while the elevation map is the clearest choice for explaining the ridge belt and the lower western terrain.
- Regional orientation: compare major roads, communities, and the county boundary.
- City placement: see how Anniston and Oxford relate to Jacksonville, Piedmont, Weaver, and Ohatchee.
- Water features: trace the Coosa River, Choccolocco Creek, tributaries, and lakes.
- Terrain: compare the higher eastern ridges with lower areas toward the west.
Using the maps this way avoids crowding every subject into one image. A road-and-city discussion remains easy to follow, while a water or terrain lesson can use the specialized view that makes those features more visible. The maps can also be placed side by side when a direct comparison is useful.
Download the Calhoun County A3 JPG map files
The ZIP below contains high-resolution JPG versions of the county, city, water, and elevation maps. The WebP images on this page are useful for quick viewing in a browser, while the JPG files are better suited to larger displays, printing, classroom handouts, and presentation slides.
Frequently Asked Questions
What files are included in the Calhoun County download?
The ZIP contains four high-resolution JPG files: a county map, a six-city map, a water map, and an elevation map. Each image is prepared in an A3 landscape format for printing, classroom use, presentations, or general reference.
Are the city connections the same as driving distances?
No. The city comparison uses straight-line relationships to show relative position. Driving distance can be longer because vehicles must follow the actual road network, so the map should not replace a route-planning service.
Does the water map identify flood-prone areas?
No. It shows rivers, creeks, lakes, and smaller waterways as geographic references. Flood zones, current stream conditions, and hazard information require separate official data products.
Map File Information
Download the Calhoun County map set for roads, cities, waterways, and terrain.
- Included Files: county map, city map, water map, elevation map
- File Type: high-resolution JPG files in one ZIP
- Intended Use: printing, classrooms, presentations, and location reference
Related Maps
More Alabama County Maps
Sources and Further Reference
For more detailed or current information, use the official sources below. The maps on this page are intended for clear regional reference, while legal boundaries, flood decisions, engineering work, and precise elevation measurements should be checked against current agency data.
- Official Calhoun County profile — county government background and local information.
- ALDOT Calhoun County functional-classification map — a reference for major road classifications.
- USGS Choccolocco Creek monitoring location — stream monitoring and water information.
- USGS 3D Elevation Program — source information for elevation data.
- Alabama Population Density Map: Urban Clusters, County Totals and a Decade of Change
- Calhoun County Alabama Land Cover Map with Forested Ridges and Anniston–Oxford Development
Green Map creates custom-edited map images using open geographic data sources such as geoBoundaries, Natural Earth, OpenStreetMap, and government open data. These maps are edited visual materials, not raw data files, and are provided for education, documents, presentations, and graphic reference.