Calhoun County in northeastern Alabama is more than half forest in the 2025 land-cover summary, but the map also shows a substantial amount of farmland and developed land. Forest accounts for 55.95% of the county, agriculture 18.54%, and developed cover 17.81%. Large wooded areas are especially prominent through the central and eastern parts of the county, while built-up clusters become much stronger toward the south and at several separate centers farther north.
This page separates that landscape into four views: current land cover, forest and farmland, impervious surface and developed land, and mapped class differences from 1985 to 2025. The four original JPG maps are available together in one download, so the web previews can be used to choose a view before saving the larger files for reports, lessons, presentations, or regional comparison work.
Table of Contents
The 2025 pattern is forest-led, but not uniformly rural
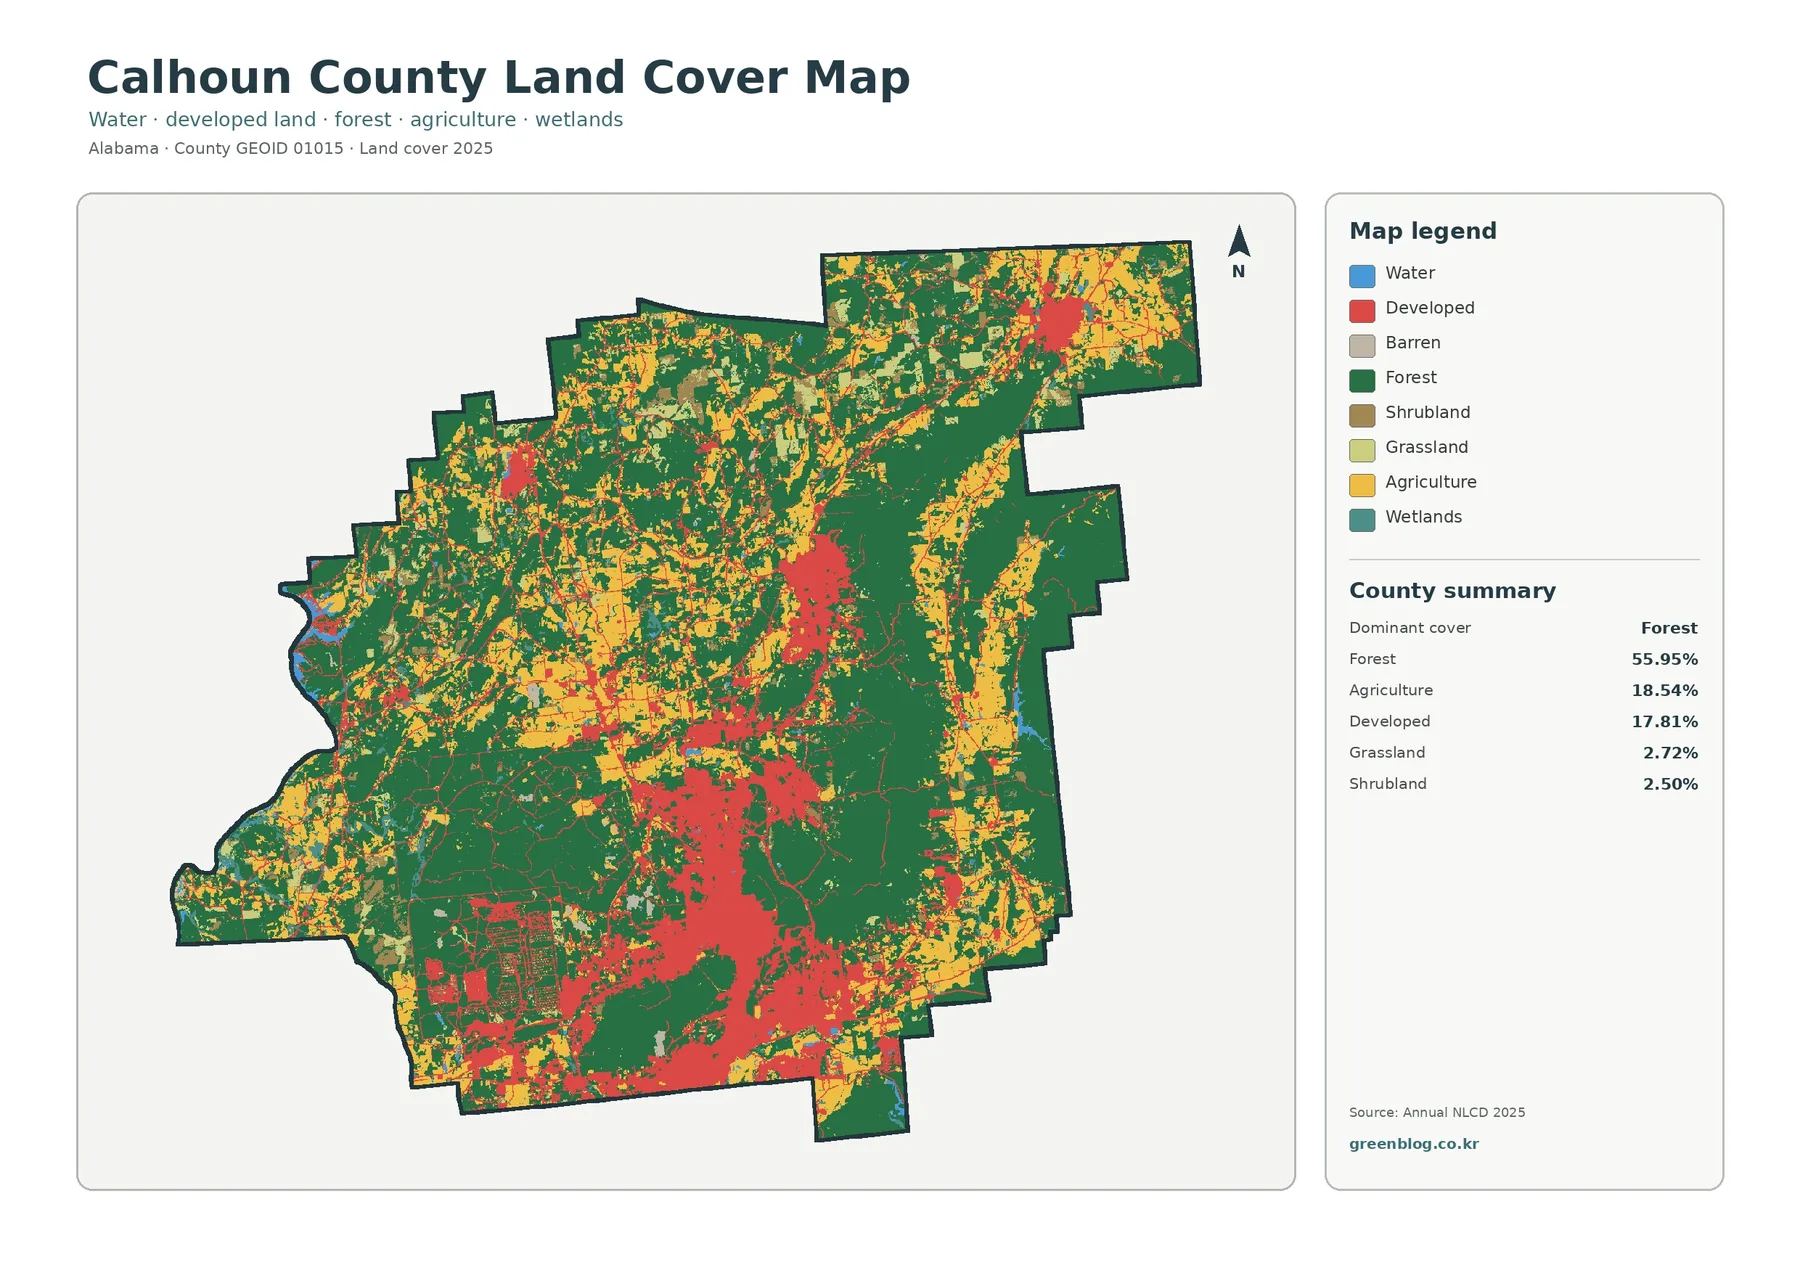
The general land-cover map is the best place to start because it keeps all of the major mapped classes visible at once. Dark green forest forms the broadest cover, including a large continuous-looking area through much of the central-east and southeast. Yellow agriculture appears in many separate patches, especially across northern, western, and eastern parts of the county. Red developed land is less widespread than forest but forms several obvious concentrations instead of appearing only as scattered pixels.
The percentages help explain the visual balance. Forest at 55.95% is the clear majority, while agriculture at 18.54% and developed land at 17.81% are close enough in size that both have a strong presence in the countywide pattern. Grassland adds 2.72% and shrubland 2.50%. Water and wetlands are smaller in area, yet they still matter geographically because narrow water-related features can shape local patterns even when their countywide percentages are modest.
Local geography provides useful context for the colors. Calhoun County lies entirely within Alabama’s Valley and Ridge physiographic section. Anniston is the county seat and largest city, with Oxford, Jacksonville, Piedmont, and Weaver among the other significant population centers identified in regional references. The Coosa River follows the western edge, portions of the eastern and southern margins are associated with Talladega National Forest, and several creeks cross the county. These facts help orient the map, but the land-cover colors themselves do not mark city limits, ownership, or protected-area boundaries.
Forest and farmland form a patchwork rather than a single divide
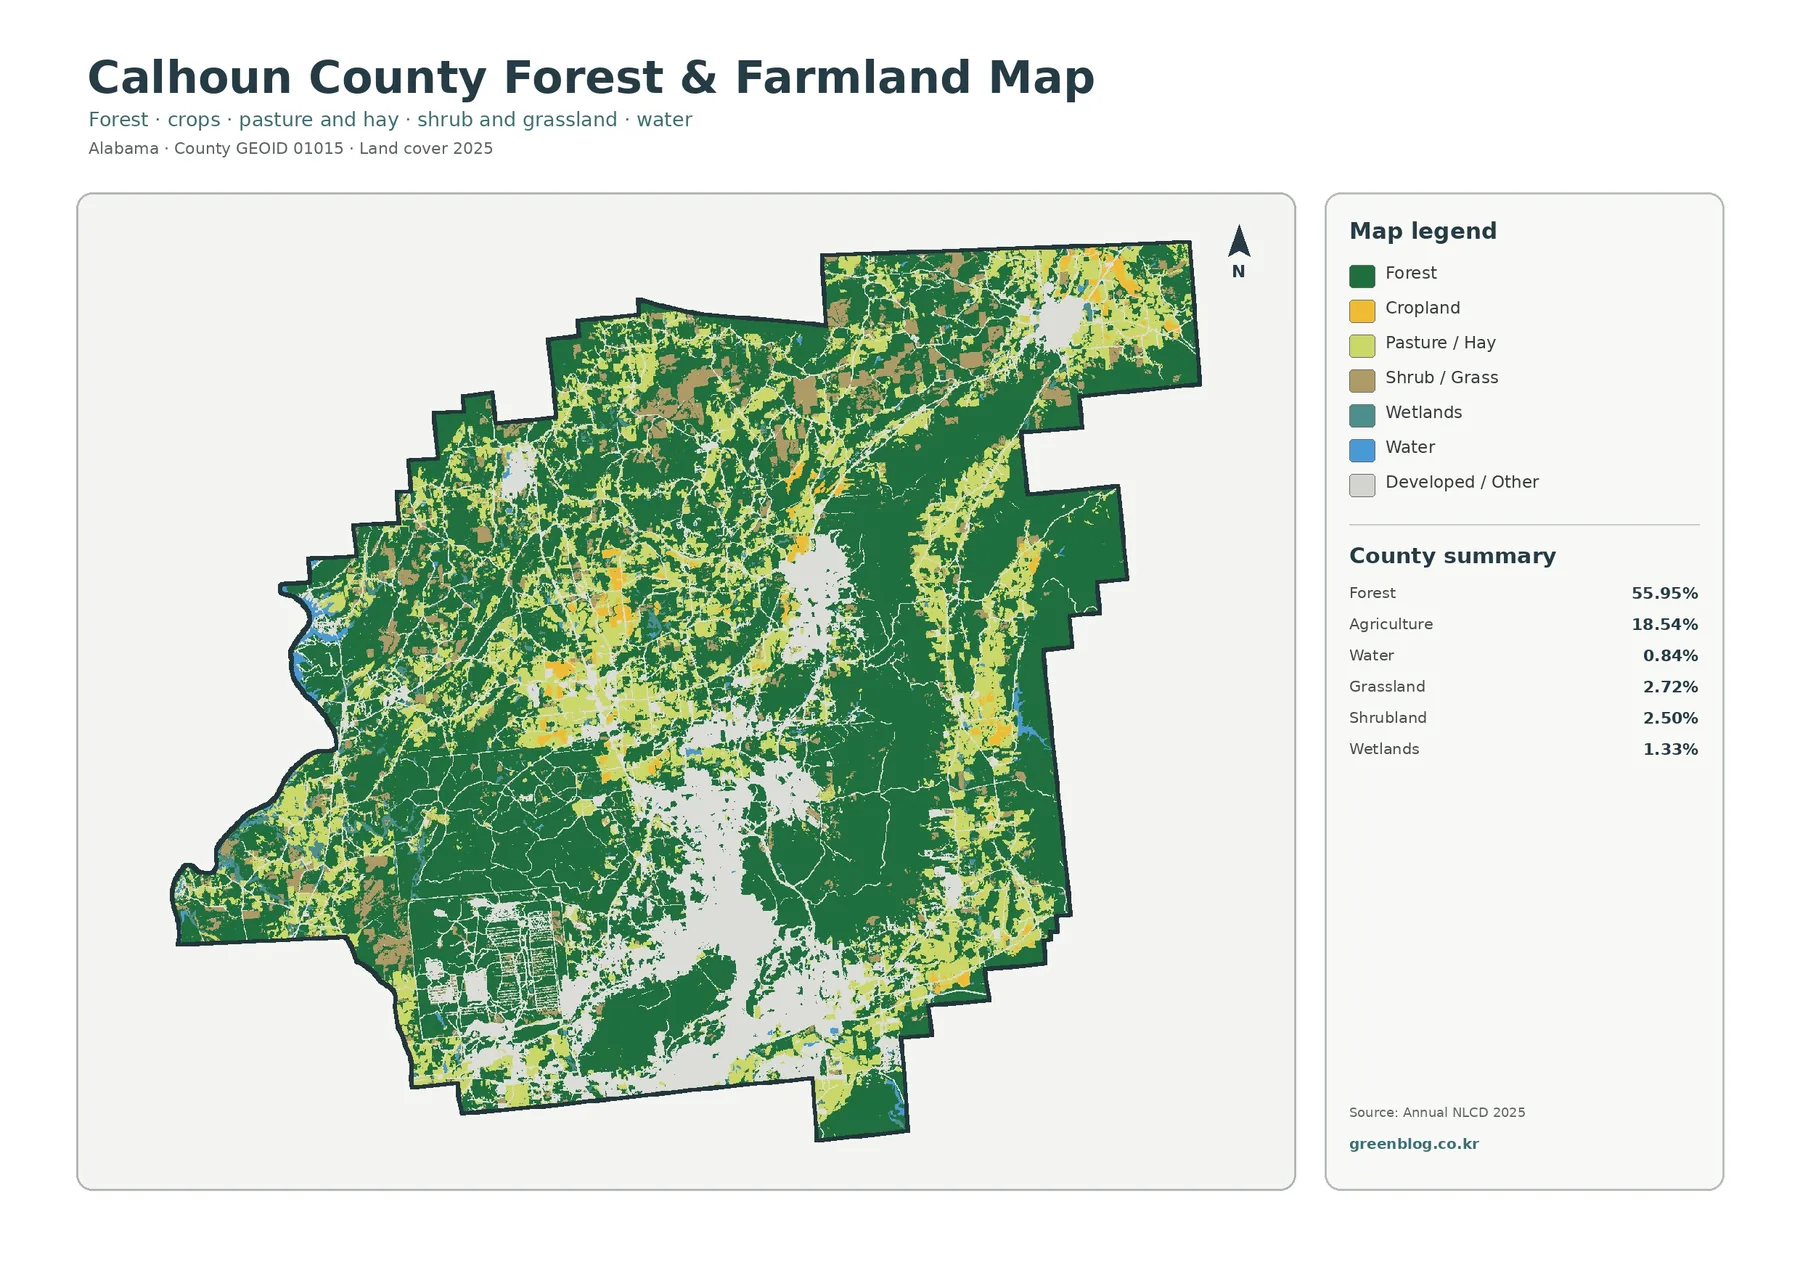
The forest-and-farmland view simplifies the county by emphasizing wooded land, cropland, pasture and hay, shrub or grass cover, wetlands, and water. Once many developed and miscellaneous surfaces are muted, the county’s rural pattern becomes easier to follow. Forest remains extensive, but open agricultural areas repeatedly interrupt it. The result is not one clean farming zone beside one clean forest zone; instead, wooded and open land meet along many irregular edges.
Agriculture represents 18.54% of the 2025 summary. On the map, farm-related colors are especially noticeable in the north and west, along parts of the eastern side, and in smaller openings through the interior. Grassland and shrubland add another set of non-forest surfaces around those areas. This view is useful when a classroom exercise, presentation, or planning discussion needs to compare wooded and open rural land without giving the developed classes the same visual emphasis as the full land-cover map.
Land cover should not be confused with legal land use. A pixel classified as agriculture means the observed surface fits an agricultural cover category; it does not prove that a parcel is zoned for farming. Likewise, a forest-colored cell says that tree cover dominates that cell, not that the property is publicly owned, protected, or unavailable for development. Parcel boundaries, zoning, ownership, and development rights require separate county or municipal records.
The eastern and southern parts of Calhoun County also have important forest context beyond the map itself. Regional sources place portions of Talladega National Forest along those edges, while the U.S. Fish and Wildlife Service manages Mountain Longleaf National Wildlife Refuge near Anniston to protect and restore a mountain longleaf pine ecosystem. Those named areas help explain why forest is an important regional feature, but the broad NLCD forest class should not be read as a map of longleaf pine specifically. It combines forested surfaces that may contain different tree communities.
Hard surfaces are concentrated in several distinct centers
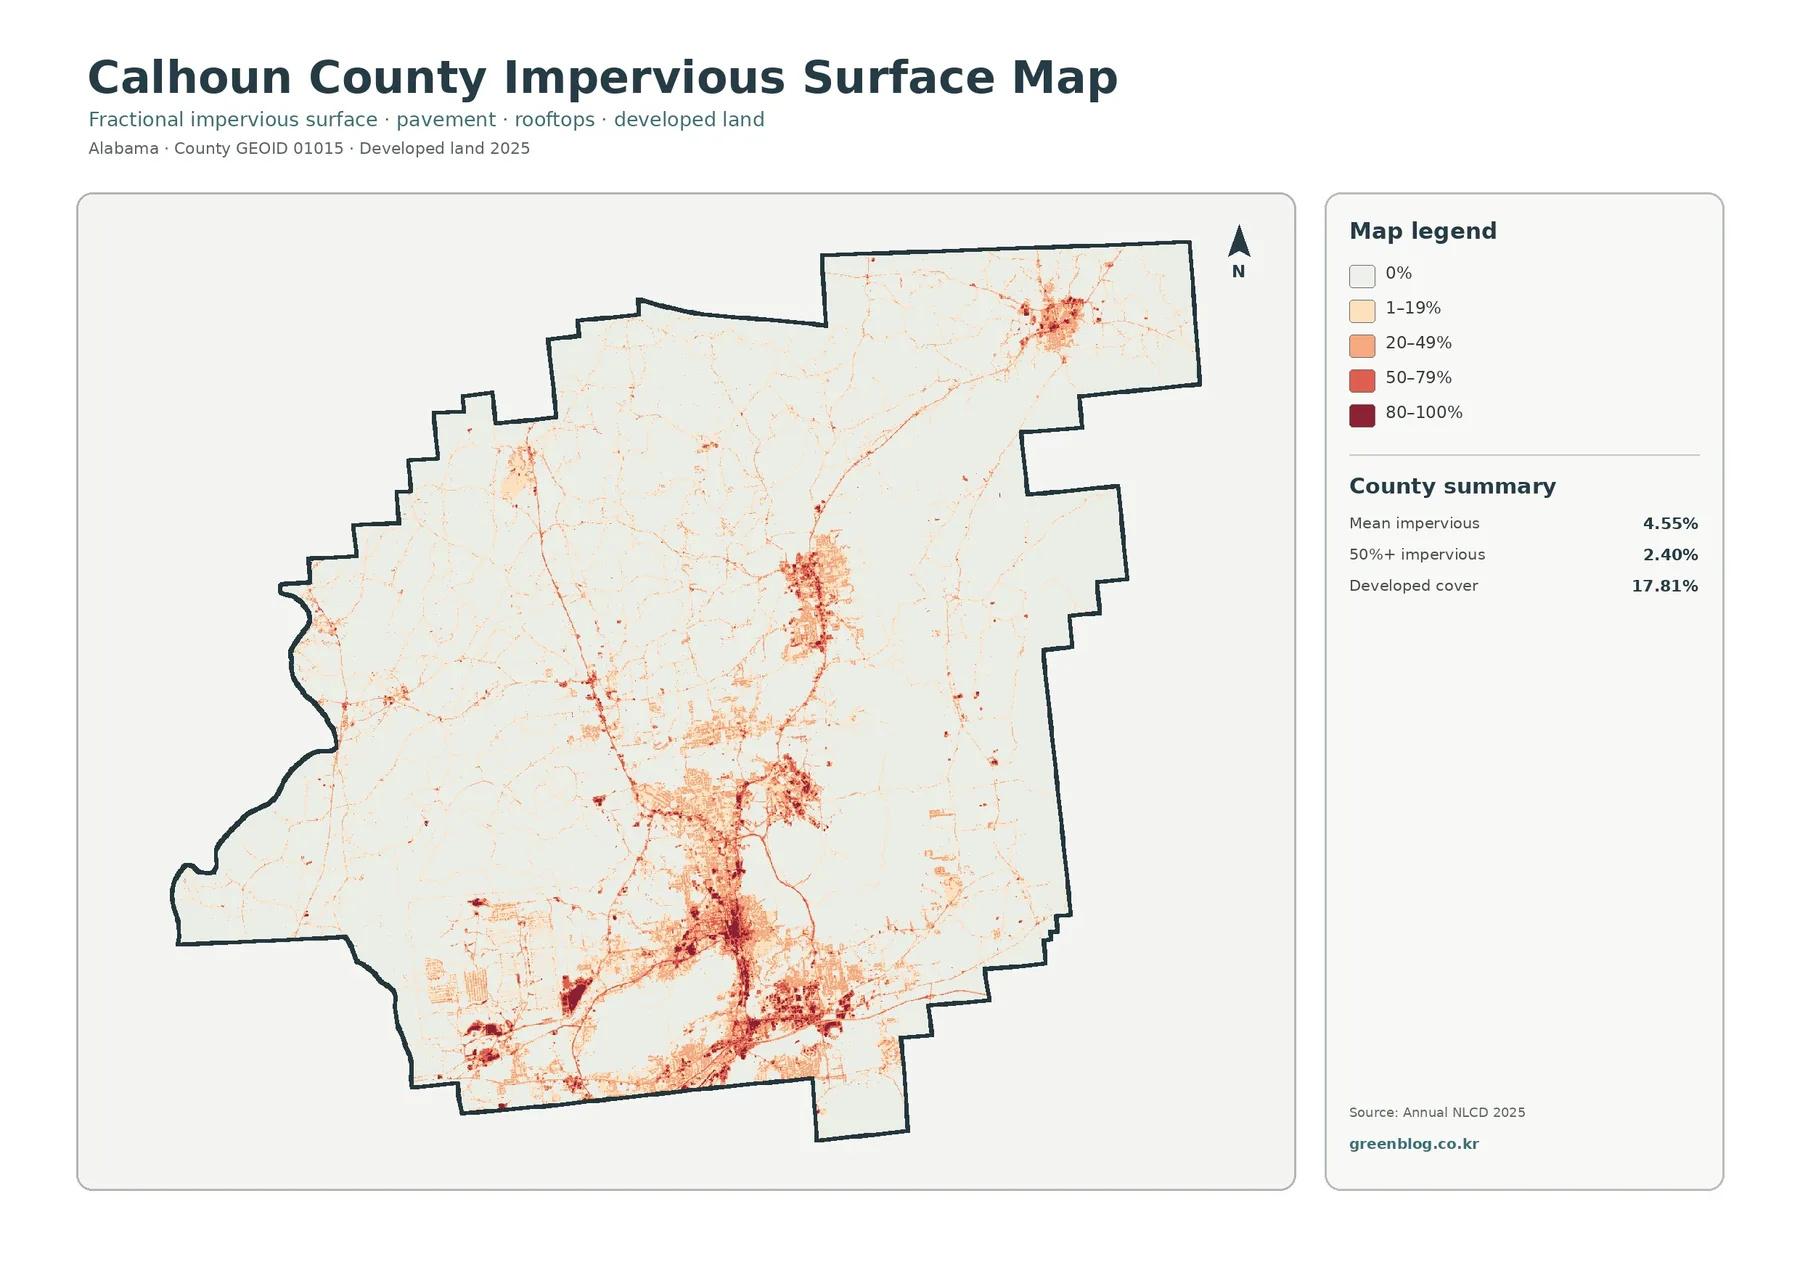
Impervious surface means rooftops, pavement, parking areas, and other hard surfaces that do not readily absorb rainfall. Calhoun County’s mean impervious value is 4.55%, while 2.40% of the county is mapped at 50% impervious or higher. Developed land, which is a broader land-cover category, totals 17.81%. The difference between those figures is expected because developed land can include lawns, trees, bare soil, and other surfaces that still allow water to infiltrate.
The strongest impervious cluster is in the southern part of the county, with another clear concentration in the central area and a separate cluster in the northeast. Thin linear traces connect or extend away from those centers. Regional geography places Anniston and Oxford in the southern urban area, Jacksonville farther north, and Piedmont in the northeast. Looking at those settlement locations alongside the map helps a reader understand the broad pattern, although an individual raster line should not be assigned to a named road without checking a road map.
Major transportation routes in Calhoun County include U.S. 431, Interstate 20, and U.S. 78. Built surfaces and transportation corridors often occupy the same parts of a developed landscape, but this map does not establish cause and effect. It is appropriate to say that hard surfaces and settlement corridors are concentrated together. It would take historical road, zoning, building, and population data to determine when particular areas developed and why.
The impervious layer can be useful in watershed education because it highlights places where rainfall is more likely to meet pavement or rooftops instead of soil and vegetation. It should not, however, be treated as a flood-risk map. Drainage depends on slope, soils, streams, stormwater infrastructure, and rainfall as well as imperviousness. The map works best as a screening and comparison layer that points to areas where more detailed hydrologic information may be worth checking.
Water and wetlands are small in percentage but important in location
The forest-and-farmland summary reports water at 0.84% and wetlands at 1.33%. Those figures are much smaller than forest, agriculture, or developed land, yet the water-related classes still provide useful geographic anchors. The Coosa River runs along the county’s western edge, where H. Neely Henry Lake occupies part of that river system. Cane, Ohatchee, and Choccolocco creeks are among the tributaries identified in regional sources.
On a county-scale raster map, narrow waterways can be difficult to display continuously. A stream may be narrower than a 30-meter cell, and a cell near a channel may contain water, trees, wet ground, and developed or agricultural surfaces at the same time. That is one reason a small water percentage should not be interpreted as proof that surface drainage is unimportant. A dedicated hydrography map is the better source for named streams, channel continuity, and detailed water-network work.
Wetlands also deserve separate attention from open water. A wetland cell can represent saturated or periodically wet ground with vegetation rather than a blue, open-water surface. For environmental education, comparing the wetland class with forest and agriculture can help show how drainage-related areas pass through different landscapes. For permitting, wetland delineation, or property decisions, however, a generalized land-cover class is not a substitute for site-specific regulatory information.
The 1985–2025 map records class differences, not a single kind of change
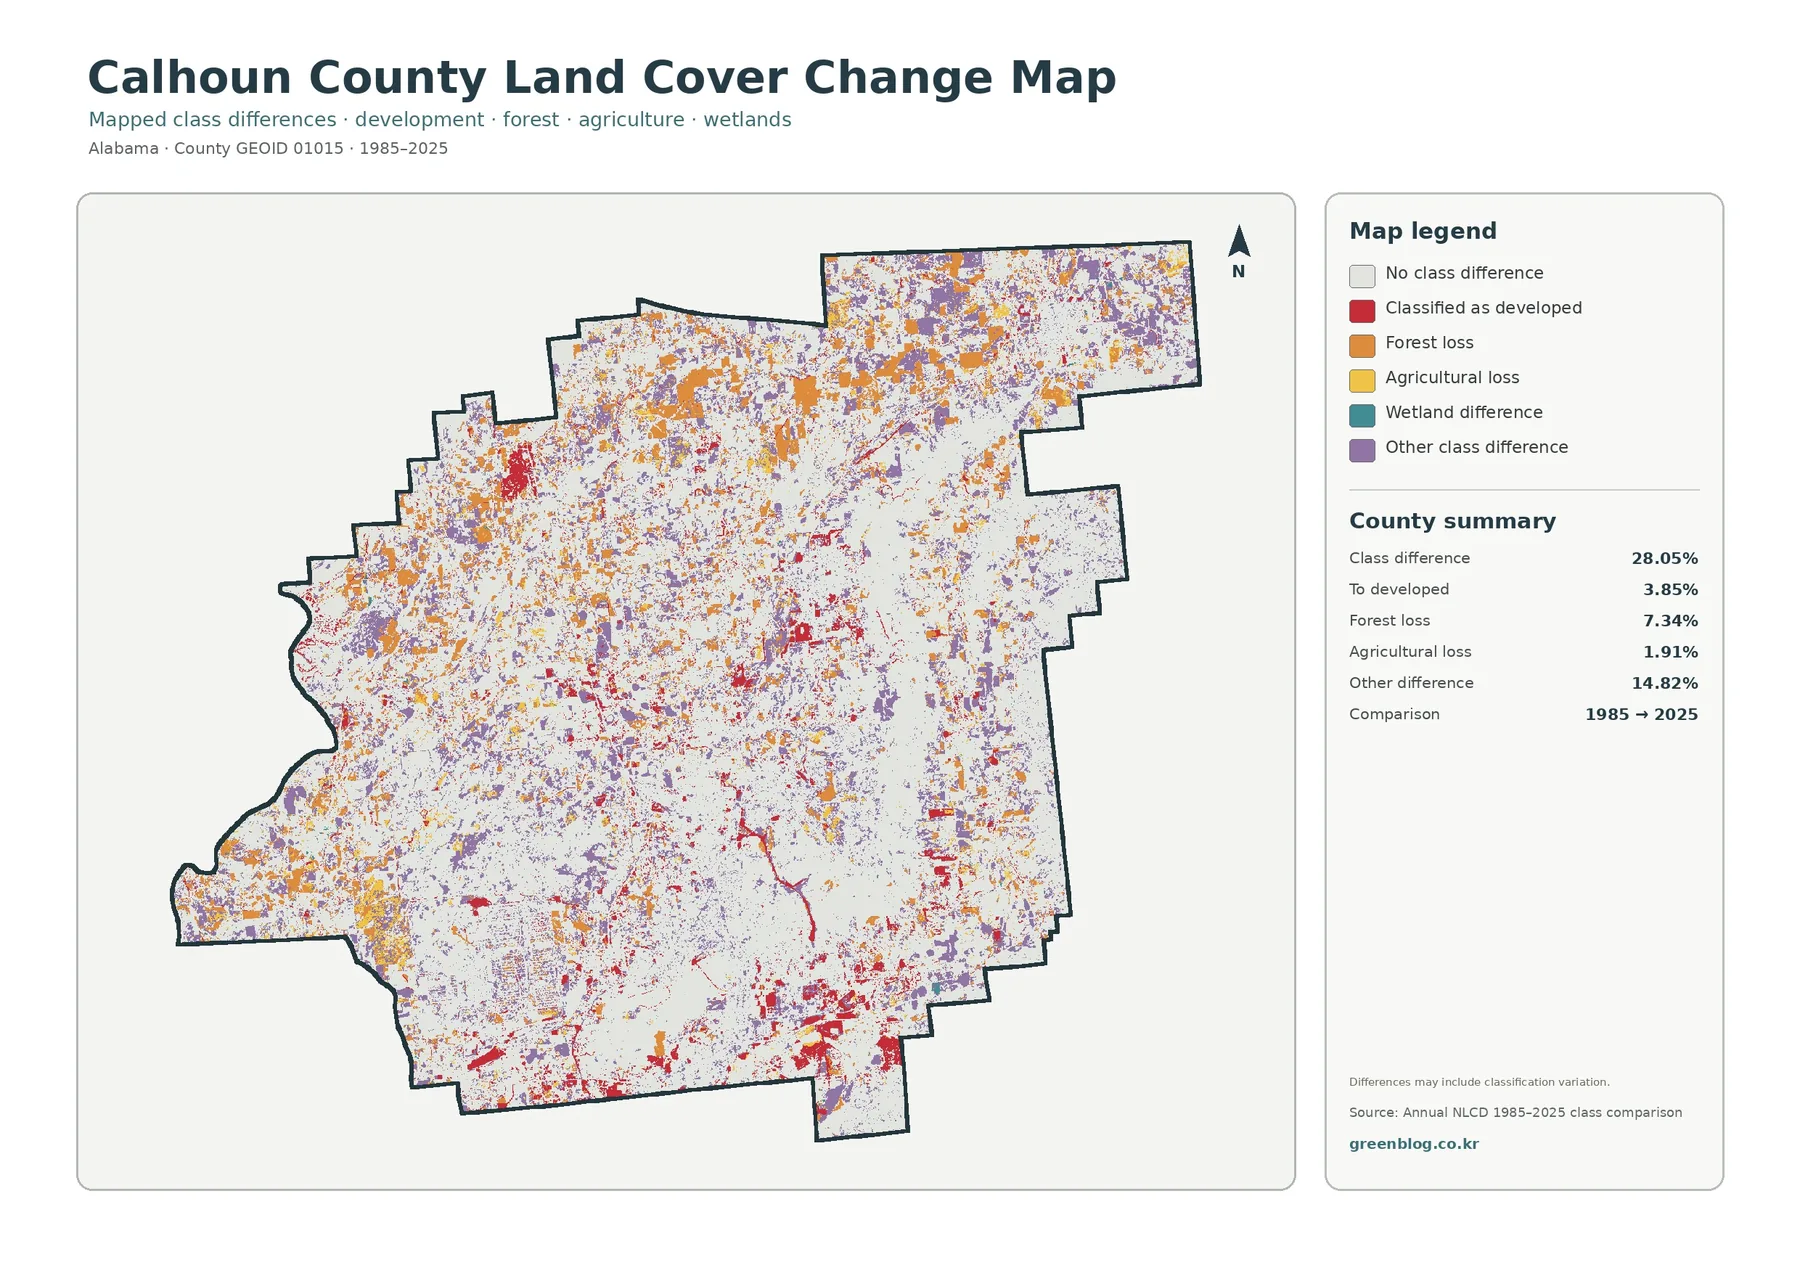
The change map reports a mapped class difference across 28.05% of Calhoun County between 1985 and 2025. Within that total, 3.85% is labeled as changed to developed, 7.34% as forest loss, 1.91% as agricultural loss, and 14.82% as other class difference. Wetland difference is also represented in the legend. White areas indicate no mapped class difference under this comparison, while the colored areas identify several different types of change.
That 28.05% figure should not be described as the share of the county that became developed. The changed-to-developed category is much smaller at 3.85%. Nor should every colored cell be treated as a confirmed physical conversion with a known cause. The map itself notes that differences may include classification variation. Satellite observations, class definitions, mixed pixels, and the conditions of the imagery can all affect how a cell is labeled at two different dates.
Forest-loss and other-difference colors are scattered through many parts of the county, including the north and west, while changed-to-developed areas are more visually noticeable around places that already contain stronger impervious patterns. Comparing the change map with the 2025 impervious map is useful because the two answer different questions. One shows where hard surfaces are concentrated now; the other shows where the mapped land-cover class differs from its 1985 label.
This comparison can guide follow-up research. A student or analyst can identify a cluster of forest-loss color and then check annual land-cover products or historical aerial imagery for that location. A changed-to-developed cluster can be compared with current road and parcel information. The colored change category is a starting point for asking what happened, not a complete explanation of the event.
Choosing the right Calhoun County map for a project
Use the full 2025 land-cover map when the project needs an overview of the county. It is the best view for comparing the 55.95% forest share with agriculture, development, grass, shrub cover, wetlands, and water in one frame. If the question is specifically about the rural landscape, the forest-and-farmland version removes some competing detail and makes wooded areas and open agricultural surfaces easier to compare.
Choose the impervious map when the focus is the built environment. It makes the southern and central urban concentrations much clearer than the general map and shows the difference between widespread developed cover and the smaller fraction that consists of hard surfaces. For a time-based question, the 1985–2025 map is more appropriate, but it is easier to interpret after the reader has already seen the 2025 pattern.
For a presentation, using one primary map and one supporting map usually communicates more clearly than placing all four at equal size. A forest and farming topic can pair the general map with the forest-and-farmland view. A development topic can pair the general map with impervious surfaces. A change discussion can place the current map beside the long-term class comparison so the audience does not confuse present condition with mapped historical difference.
Download the four original JPG maps
The download ZIP contains four original JPG files: the 2025 land-cover map, the forest and farmland map, the impervious surface and developed-land map, and the 1985–2025 land-cover change map. Each image is 2480×1754 pixels. Because the maps use the same Calhoun County boundary, a reader can switch from one theme to another without changing the geographic extent.
The files can be used in classroom materials, reference documents, presentation graphics, or as an early step in a larger mapping project. They are particularly useful for identifying where a more detailed source is needed. A user might first locate a strong impervious cluster, a forest-farmland boundary, or a change hotspot, then open parcel records, aerial imagery, hydrography, or annual land-cover data for a closer look.
The package identifies the JPGs as original-resolution files but does not mark them as meeting the A3 high-resolution reference. If a large printed output is planned, check text and legend clarity at the intended size first. Enlarging the JPG also does not increase the underlying spatial detail of the land-cover data.
What the 30-meter raster can and cannot show
Annual NLCD land cover is raster data, meaning the landscape is divided into grid cells and each cell is assigned a representative class or value. The land-cover product uses a 30-meter spatial resolution. A single cell can therefore contain more than one real-world surface, such as trees beside a road or grass around a building, even though the map must summarize the cell in a consistent way.
This matters most around narrow roads, small ponds, stream channels, individual buildings, and sharp edges between fields and forest. Zooming in makes the pixels larger on screen but does not create new ground detail. The map is not a parcel survey and should not be used to determine ownership, zoning, wetland jurisdiction, building setbacks, or property boundaries.
The 2025 map also represents a dated observation and classification. Construction, timber harvest, vegetation recovery, crop rotation, storm impacts, or other changes after that period will not appear until newer data are used. The 1985–2025 comparison summarizes the endpoints and cannot describe every intermediate transition. Annual NLCD data, aerial imagery, and local records are better choices when the timing of a specific change matters.
Frequently Asked Questions
What is the largest land-cover class in Calhoun County?
Forest is the largest class in the 2025 summary at 55.95%. Agriculture accounts for 18.54% and developed land 17.81%, followed by grassland at 2.72% and shrubland at 2.50%. The county is therefore forest-dominated, but the amount and concentration of agricultural and developed cover make the overall map much more varied than a simple woodland map.
Why is developed cover 17.81% while mean imperviousness is only 4.55%?
Developed land is a broad land-cover category that can include lawns, trees, soil, and other permeable surfaces around buildings and roads. Imperviousness measures the hard fraction, such as roofs and pavement. A county can therefore have a much larger developed-cover percentage than its average impervious percentage.
Does the 28.05% class difference mean 28.05% of Calhoun County was physically converted?
No. It means the mapped class differs between the 1985 and 2025 comparison for that share of the county. The categories include 3.85% changed to developed, 7.34% forest loss, 1.91% agricultural loss, 14.82% other difference, and a wetland-difference class. Some differences may reflect classification variation, so a specific land conversion should be confirmed with additional time-series evidence.
Can these maps show parcel boundaries or zoning in Anniston?
No. These maps are designed for county-scale land-cover, impervious-surface, and change comparison. They do not show parcel ownership, zoning districts, legal development rights, or surveyed property lines. Use official county or municipal GIS and planning records for those questions.
Map File Information
Calhoun County Land Cover Maps Four original JPG maps covering 2025 land cover, forest and farmland, impervious surfaces, and the 1985–2025 class comparison.
- Included Files: Use only the versions confirmed in the article and supplied images
- File Type: Use the confirmed download contents
- Intended Use: Printing, education, presentations, and map-based projects
Related Maps
- Autauga County Alabama Land Cover Map
- Baldwin County Alabama Land Cover Map
- Barbour County Alabama Land Cover Map
Sources and references
- MRLC Annual NLCD Data — current and annual land-cover data access
- USGS Annual NLCD Land Cover Classification — class definitions and interpretation guidance
- U.S. Census Bureau TIGER/Line Shapefiles — county boundary reference
- Encyclopedia of Alabama – Calhoun County — cities, waterways, highways, and regional geography
- U.S. Fish & Wildlife Service – Mountain Longleaf National Wildlife Refuge — Calhoun County forest and conservation context
Green Map creates custom-edited map images using open geographic data sources such as geoBoundaries, Natural Earth, OpenStreetMap, and government open data.
These maps are edited visual materials, not raw data files, and are provided for education, documents, presentations, and graphic reference.