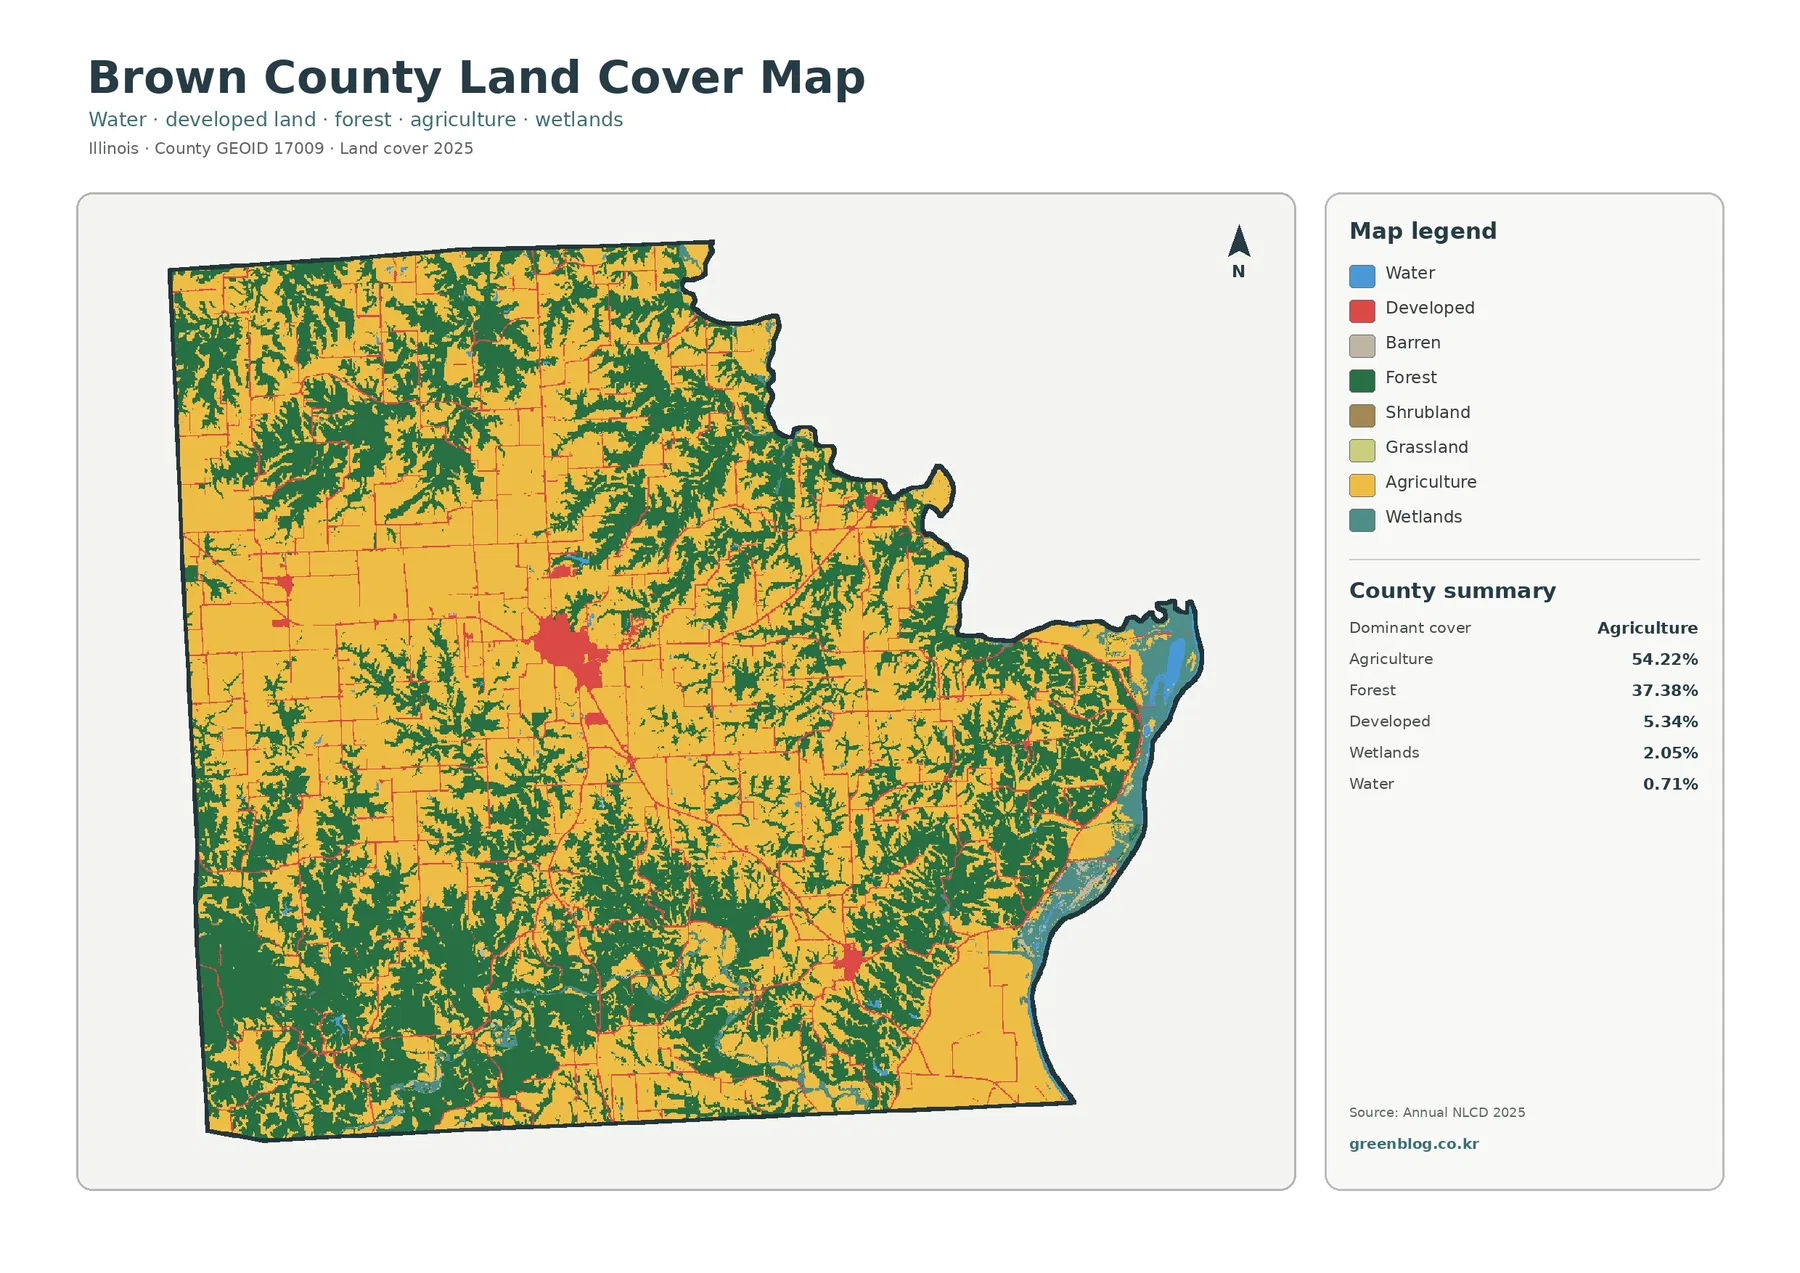
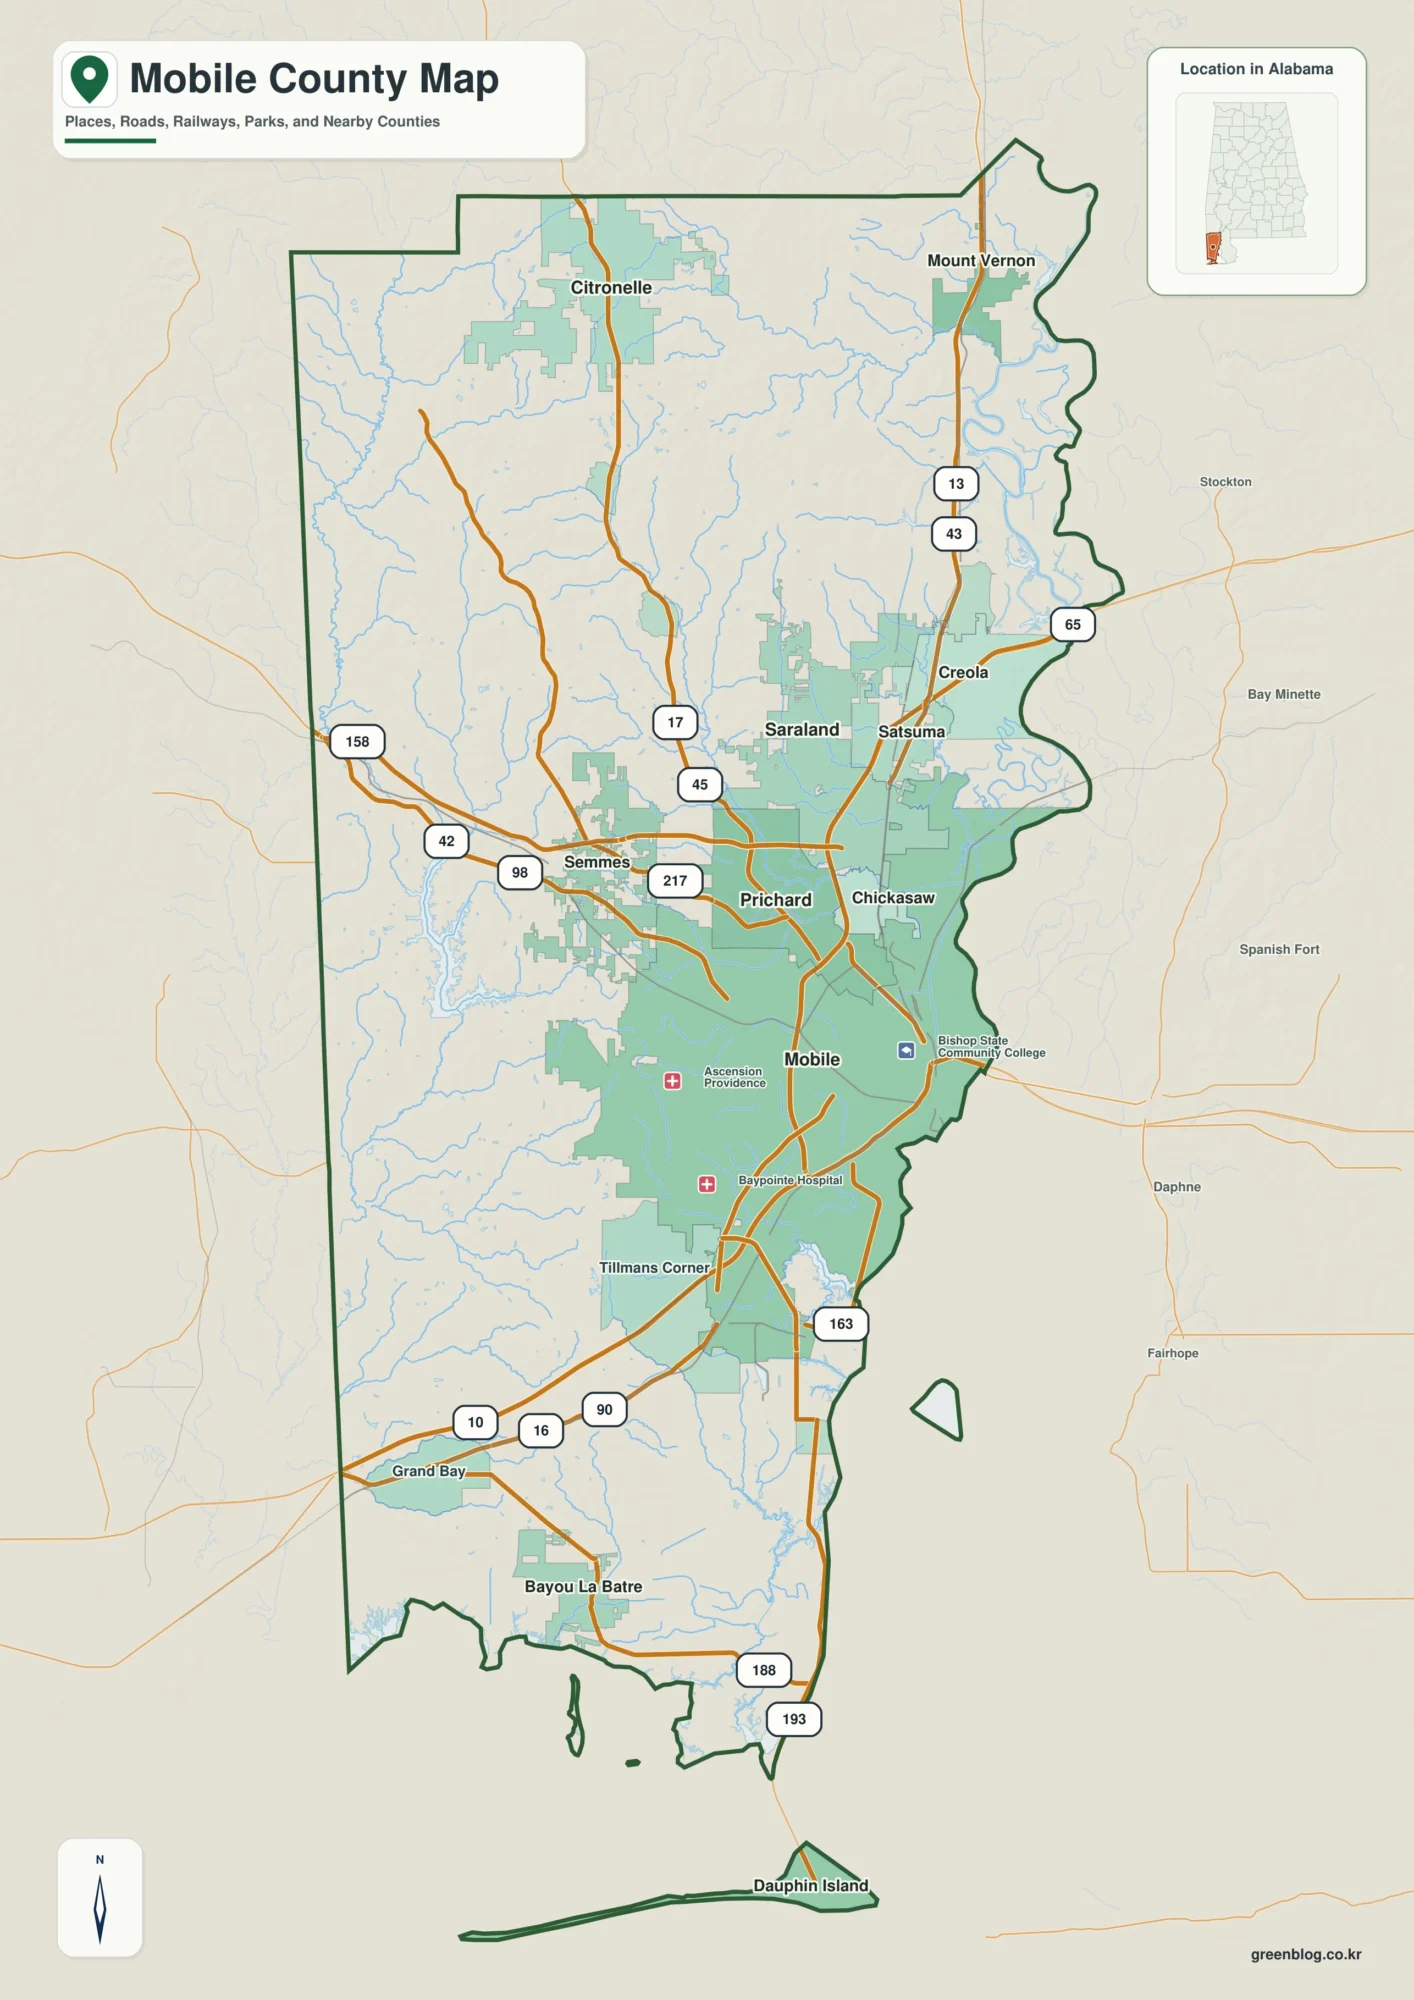
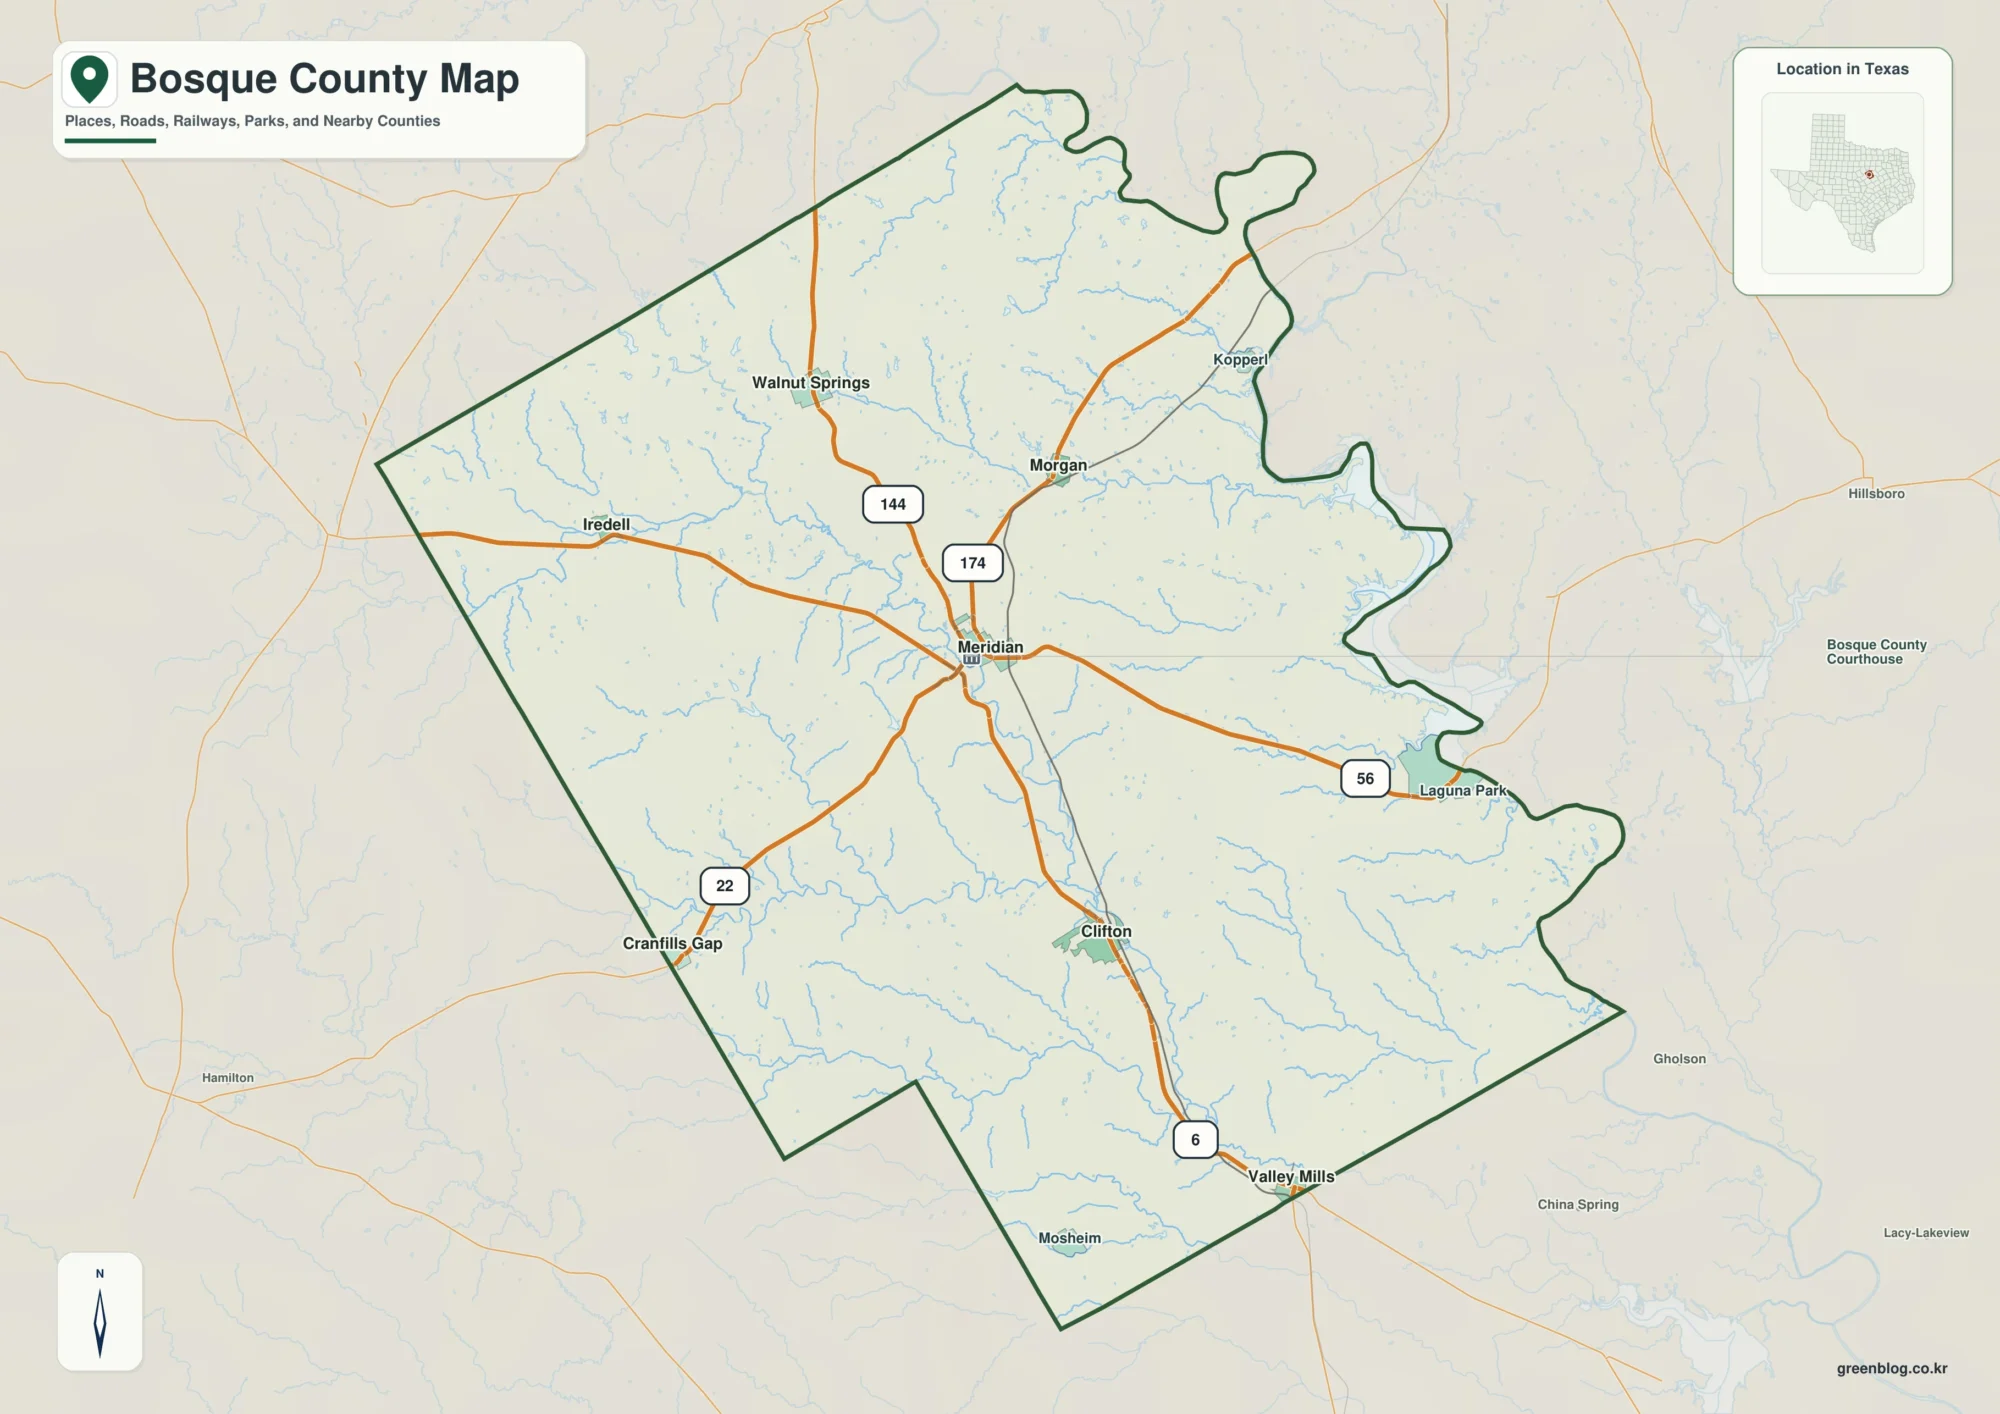
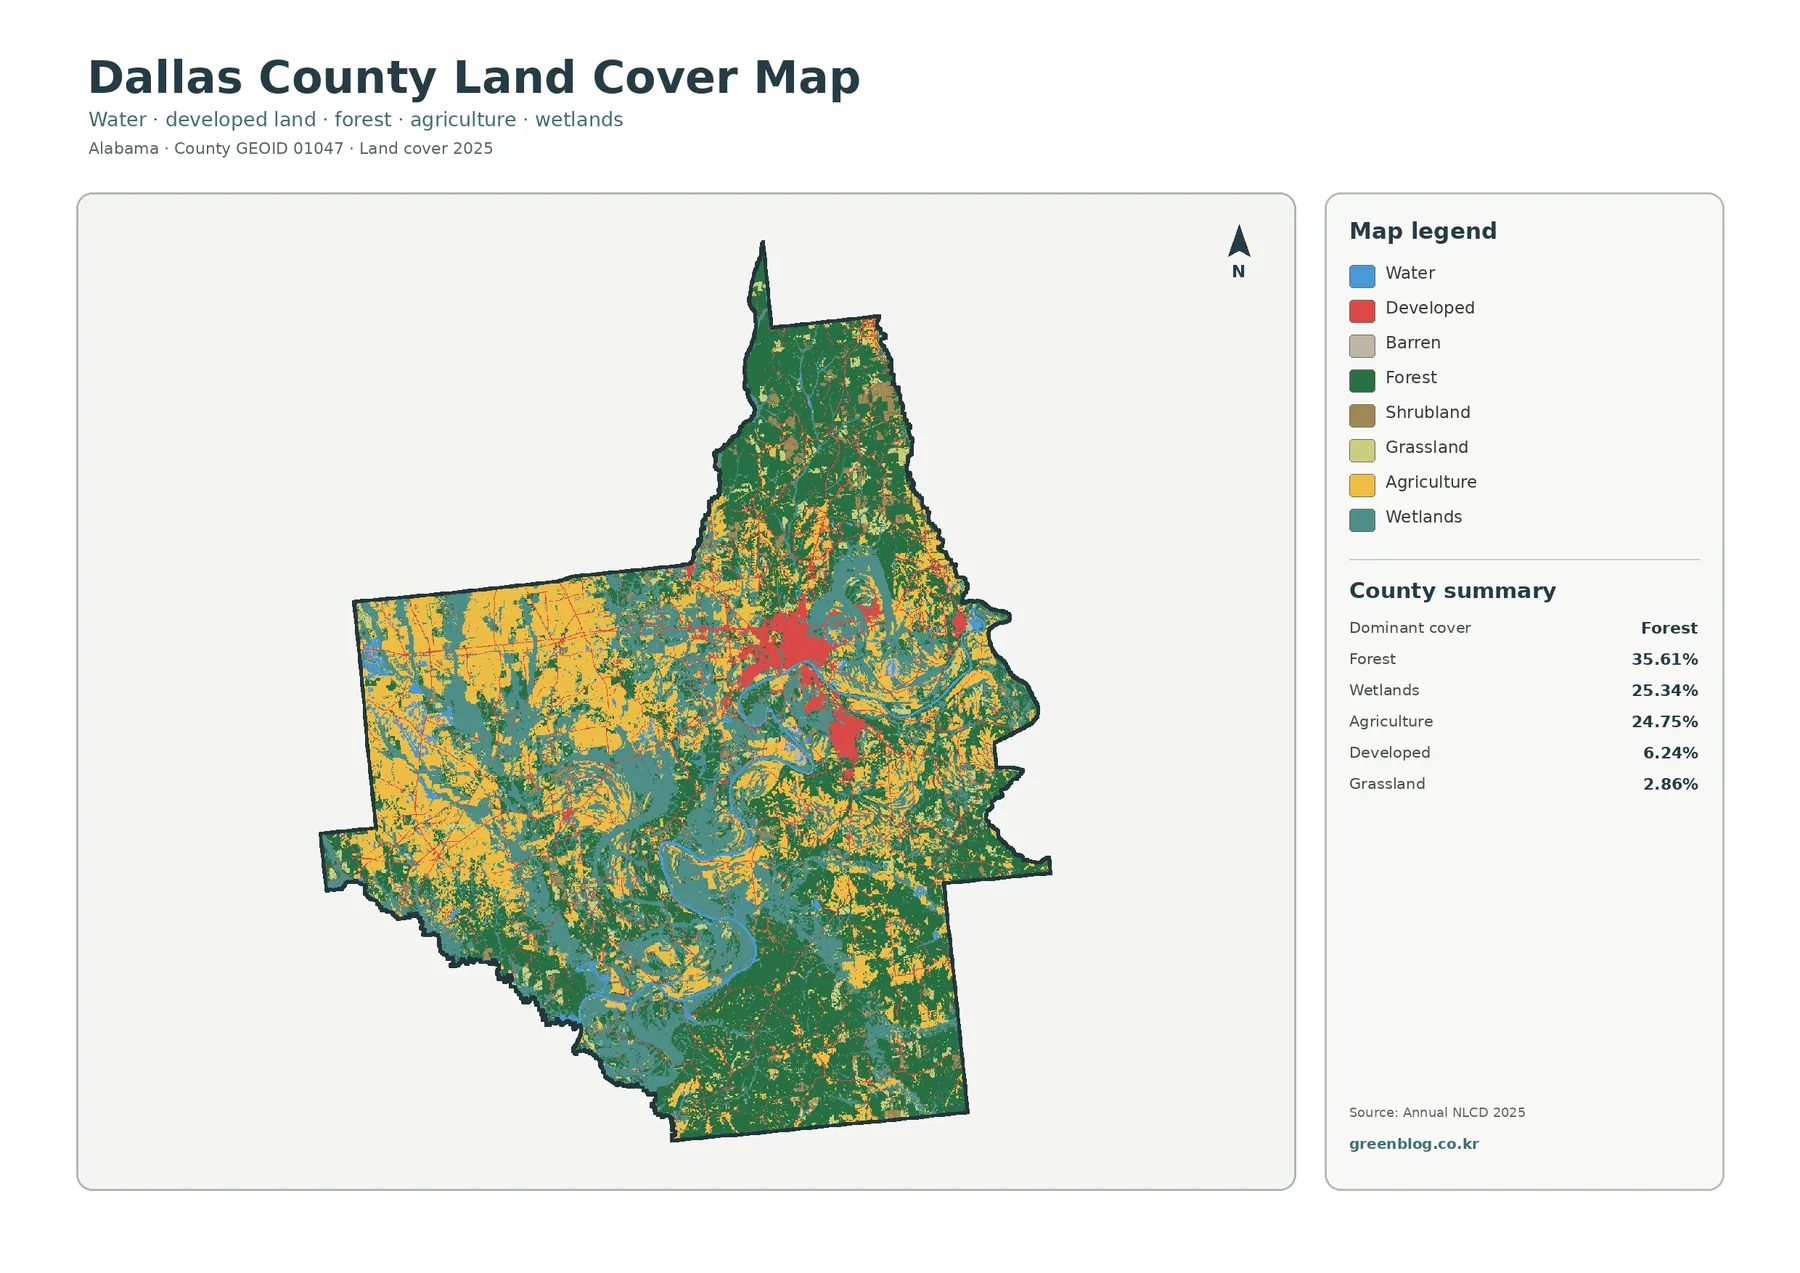
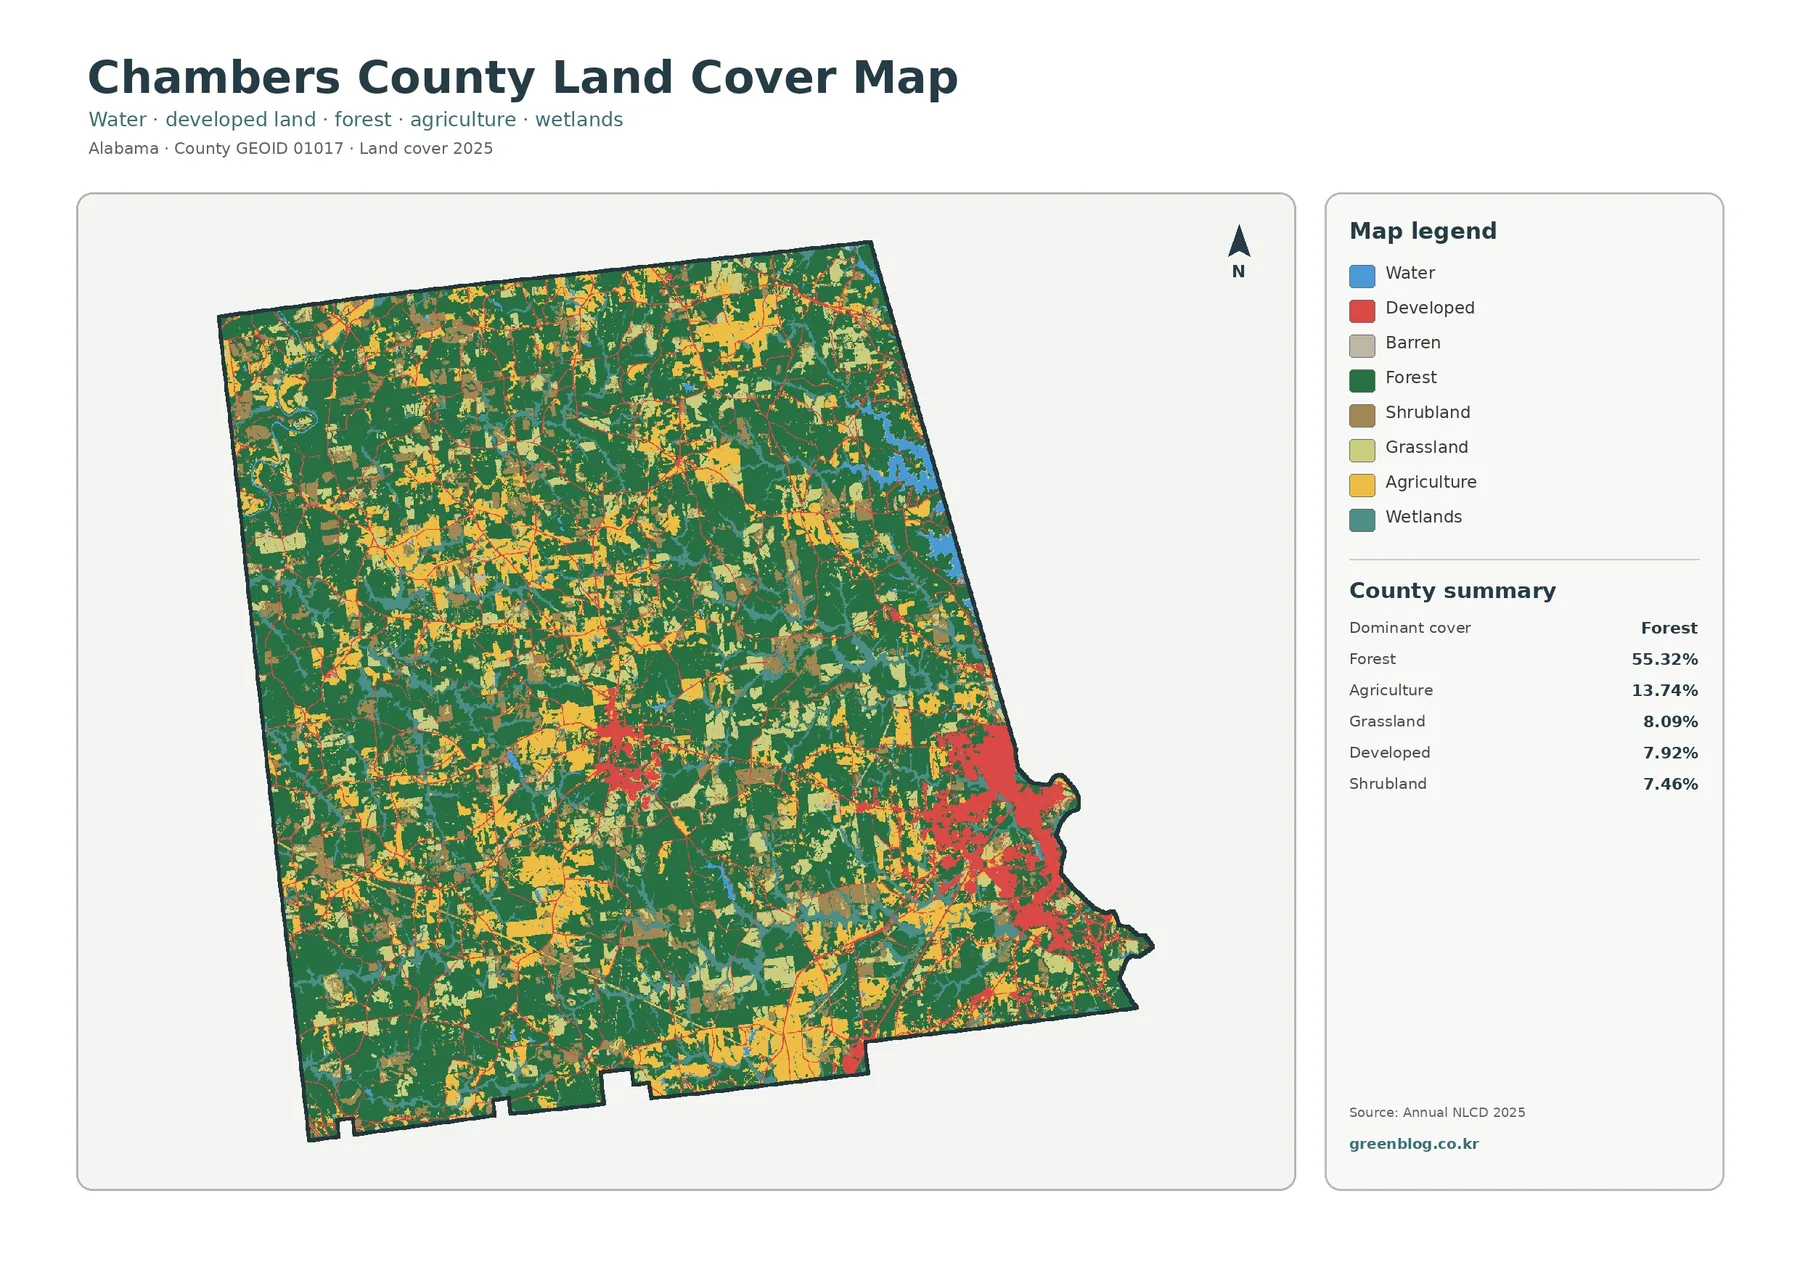
Chambers County in eastern Alabama is forest-dominant on the 2025 land-cover map, but the county is far from a single continuous block of trees. Forest accounts for 55.32% of the mapped area, while agriculture covers 13.74%, grassland 8.09%, developed land 7.92%, shrubland 7.46%, wetlands 6.14%, and water 1.17%. The eastern side stands out for larger developed clusters and visible water and wetland edges, while much of the interior mixes forest with farms and other open cover.
This page separates those patterns into four views: the full 2025 land-cover map, a forest-and-farmland map, an impervious-surface map, and a 1985–2025 class-difference map. The WebP images are useful for quick viewing, and the four original JPG maps are available together in one download for classroom work, regional comparison, presentations, or an initial environmental review. Because all four maps use the same county boundary, locations can be compared directly from one view to the next.
Table of Contents
What stands out in Chambers County’s 2025 land cover
The first impression is the amount of dark green. Forest spreads across most of Chambers County, but yellow agriculture, lighter grassland, brown shrubland, and red developed areas repeatedly break that green into a varied pattern. Some forest blocks are broad and connected, while other parts of the county look more like a patchwork of woods and open land. The result is a landscape where rural cover dominates overall but settlements and working land remain easy to pick out at county scale.
The summary numbers help describe that balance. Forest is 55.32%, agriculture 13.74%, grassland 8.09%, developed land 7.92%, shrubland 7.46%, wetlands 6.14%, and water 1.17%. Percentages alone do not show whether a class forms one large block or hundreds of small pieces, so they are most useful when read beside the map. Agriculture and open cover, for example, appear as many differently sized patches rather than one simple belt, which makes their spatial pattern as important as their total share.
The eastern side contains the most obvious developed concentration. Chambers County’s official materials identify Lanett and Valley on that side of the county, while LaFayette, the county seat, is farther west near the interior. That local geography provides useful context for the larger eastern red cluster and the smaller developed concentration near the middle of the map. The land-cover layer does not draw municipal limits, however, so the edge of a red area should not be treated as a city boundary.
Blue water and teal wetlands are especially noticeable near the northeastern and eastern edge. Chambers County road and transportation maps also show West Point Lake along the eastern side, providing a geographic reference for the broad mapped water area there. Open water and wetlands should still be read as separate classes. Water represents open water surfaces, while the wetland class groups areas where wet conditions and wetland vegetation are important to the surface cover.
A clearer look at the forest and farmland mosaic
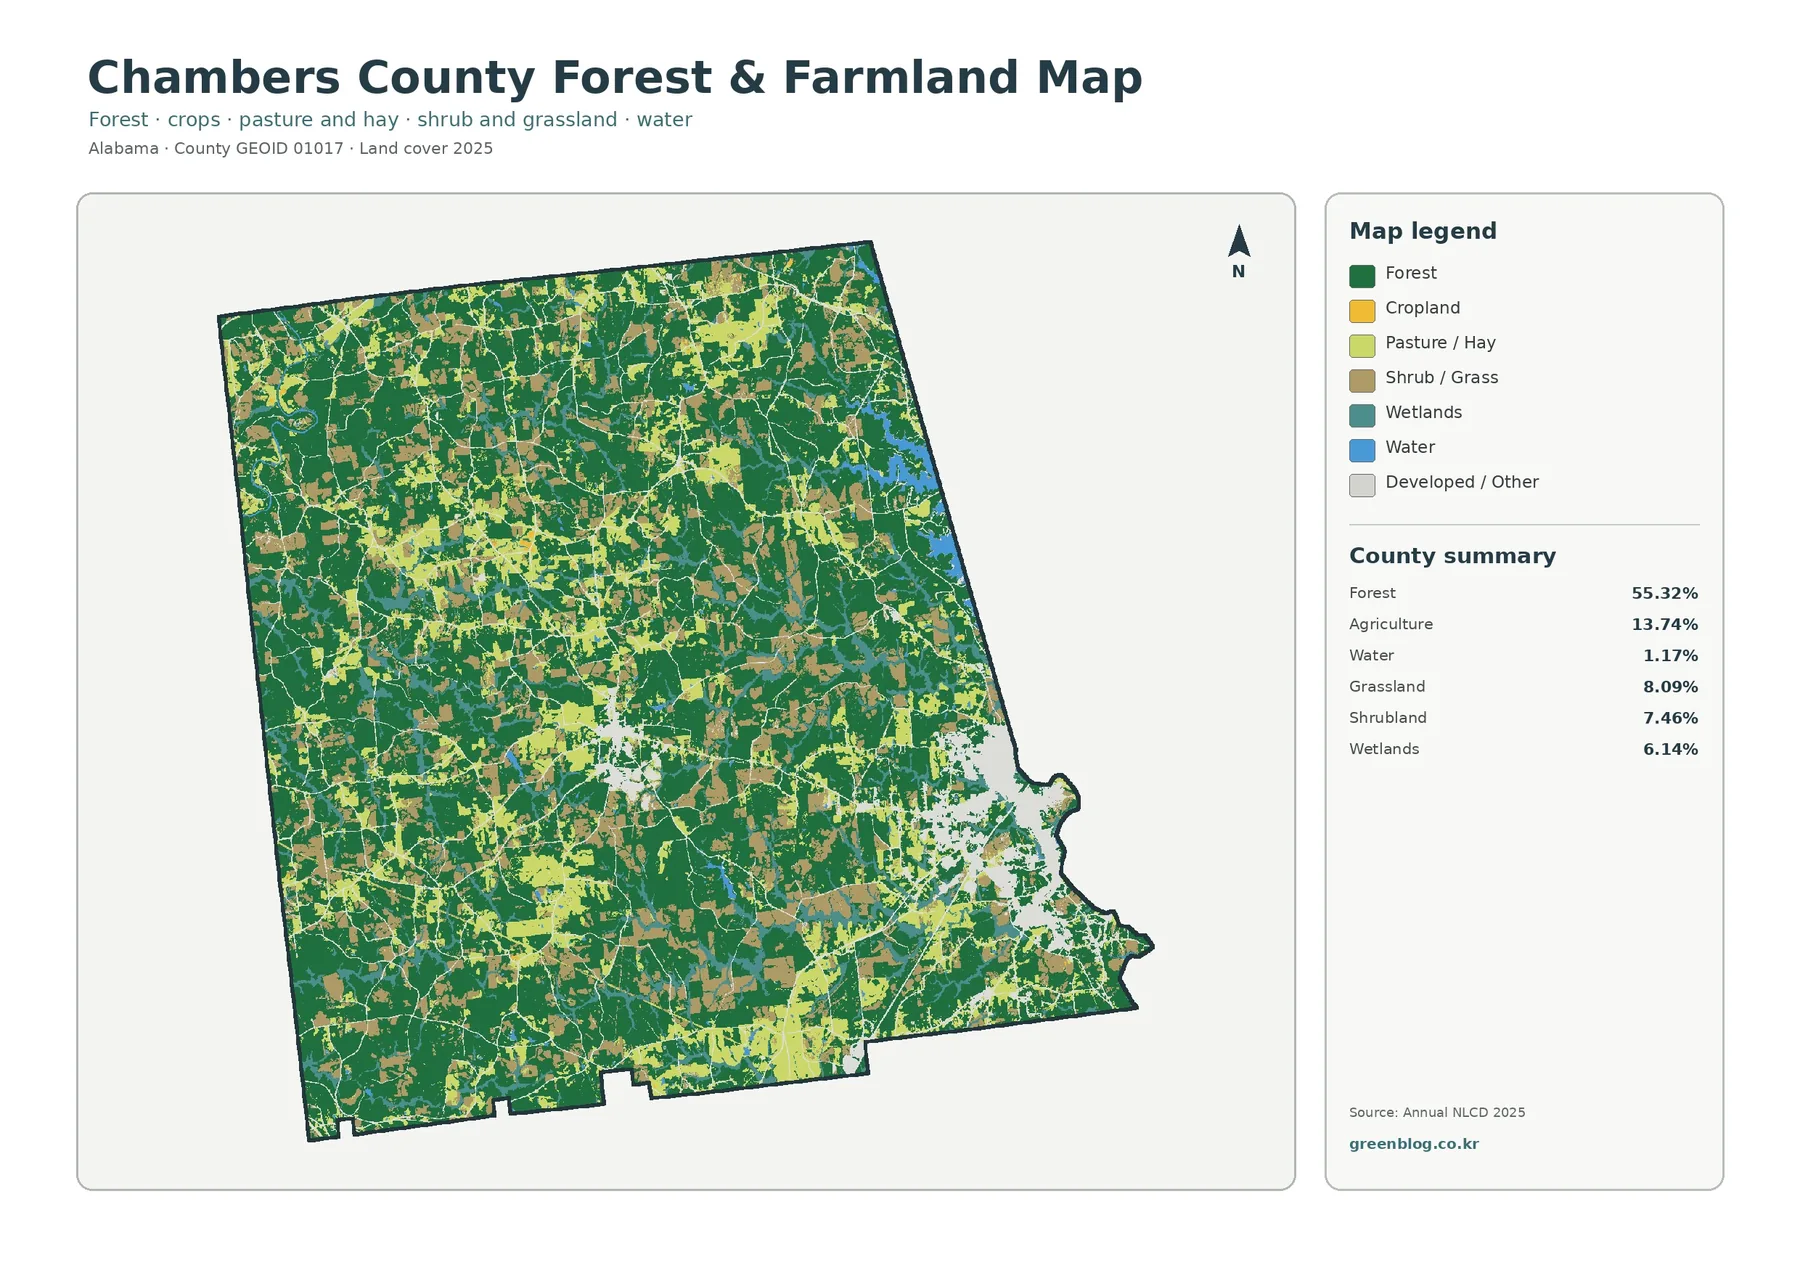
The forest-and-farmland view reduces the visual weight of developed and other classes so that wooded and open rural cover is easier to compare. Forest still fills much of the county, yet agriculture, pasture or hay, and shrub or grass cover interrupt it across the west, north, center, and south. In some places open land sits as isolated pieces within larger forest blocks; elsewhere several light-colored agricultural areas lie close together and form a more complex rural patchwork.
Agriculture makes up 13.74% of the 2025 summary, but its shape on the map matters as much as the number. It does not form a single continuous zone. Instead, agricultural colors appear in patches of different size, often next to forest or grassland. Grassland at 8.09% and shrubland at 7.46% add another layer of open cover, so the county cannot be described accurately by a simple forest-versus-farm split.
The simplified map also shows why a single map can be misleading if its legend is ignored. Areas rendered very lightly are not automatically barren or unused ground. In this view, developed and other cover are intentionally subdued so the forest-and-farmland relationship is easier to see. Anyone interested in built surfaces should return to the full land-cover map or the impervious layer instead of interpreting pale areas as vacant land.
Land cover is also different from land use, zoning, ownership, or parcel status. A cell classified as agriculture means the mapped surface has characteristics associated with agricultural cover; it does not prove that the parcel is legally zoned for farming. Forest means tree-covered surface, not public ownership or protected status. Those questions require current county GIS, parcel, planning, or regulatory records.
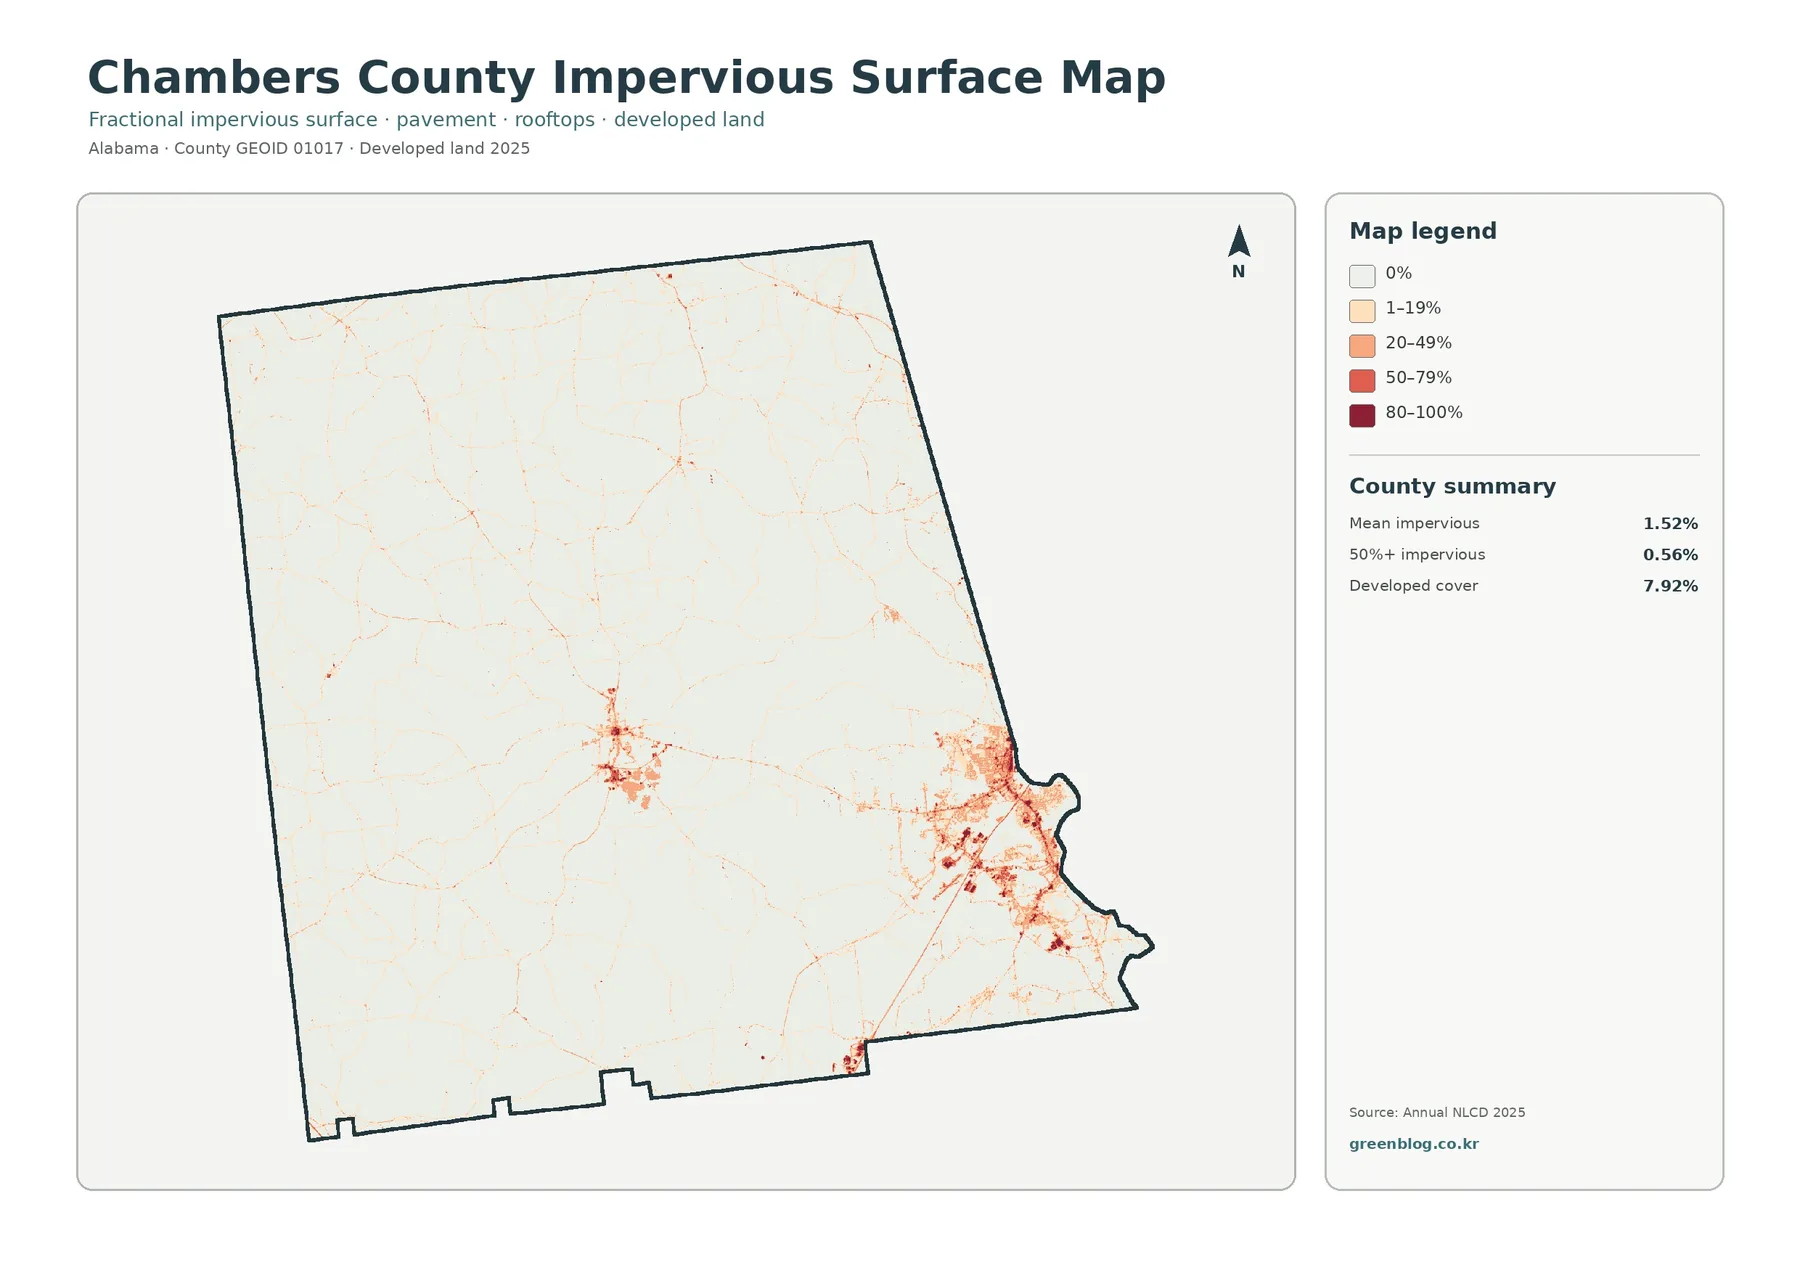
Impervious surfaces cluster most strongly in the east
Impervious surface means pavement, rooftops, parking areas, and similar hard surfaces where rainwater cannot readily soak into the ground. Chambers County’s mean impervious value is 1.52%, and 0.56% of the county is mapped at 50% impervious or greater. Developed land is 7.92%, a larger number because developed classes can include lawns, trees, soil, and other permeable surfaces within lower-density neighborhoods. The two measures describe related but different things.
The strongest impervious colors are concentrated on the eastern side, with another smaller cluster near the interior. Lanett and Valley are located in eastern Chambers County, close to the Georgia line, while LaFayette forms an interior center. Those locations help explain why the map shows a large eastern group of hard surfaces and a separate central group. Thin linear traces also extend between and away from these centers, although the raster layer does not label individual roads.
The Chambers County Highway Department says it maintains about 443 miles of paved roads, 341 miles of unimproved dirt roads, and 144 bridge structures. That county information is useful background for understanding why a largely rural county can still contain many linear hard-surface traces. The impervious map is not a road inventory, however. A line-like pattern may follow a transportation route, but identifying a specific road requires a road map or GIS layer.
This layer is useful for introducing runoff and development concepts because it separates hard surfaces from the much broader land-cover categories. A darker impervious value can indicate a place where rooftops and pavement are concentrated, but it does not by itself establish flood risk. Drainage depends on elevation, soils, streams, stormwater infrastructure, and rainfall as well. The map works best as a screening and comparison tool rather than a stand-alone engineering or hazard map.
Water and wetlands add a distinct eastern edge
Wetlands account for 6.14% of the county summary and water for 1.17%. Those percentages are much smaller than forest or agriculture, but the classes are visually important because they form recognizable features instead of blending evenly across the county. The northeastern and eastern edge contains the broadest water area, with wetland colors close to portions of the shoreline. Smaller wet or water features also appear inside the county, sometimes as narrow or broken shapes at this scale.
West Point Lake provides a useful geographic reference for the eastern water pattern. The land-cover map does not show lake levels, legal wetland boundaries, stream names, or flow conditions, so it should not be used as a substitute for hydrologic or regulatory mapping. A teal wetland cell is a land-cover classification, not an automatic statement that the location falls inside a legally regulated wetland boundary.
Comparing the general map with the forest-and-farmland view can still reveal useful landscape relationships. Some shore and wetland areas sit next to broad forest cover, while other places are closer to open rural land or developed surfaces. That is useful for environmental education and for choosing where a more detailed aerial-photo or field review may be worthwhile. It is a county-scale overview, not a site inspection.
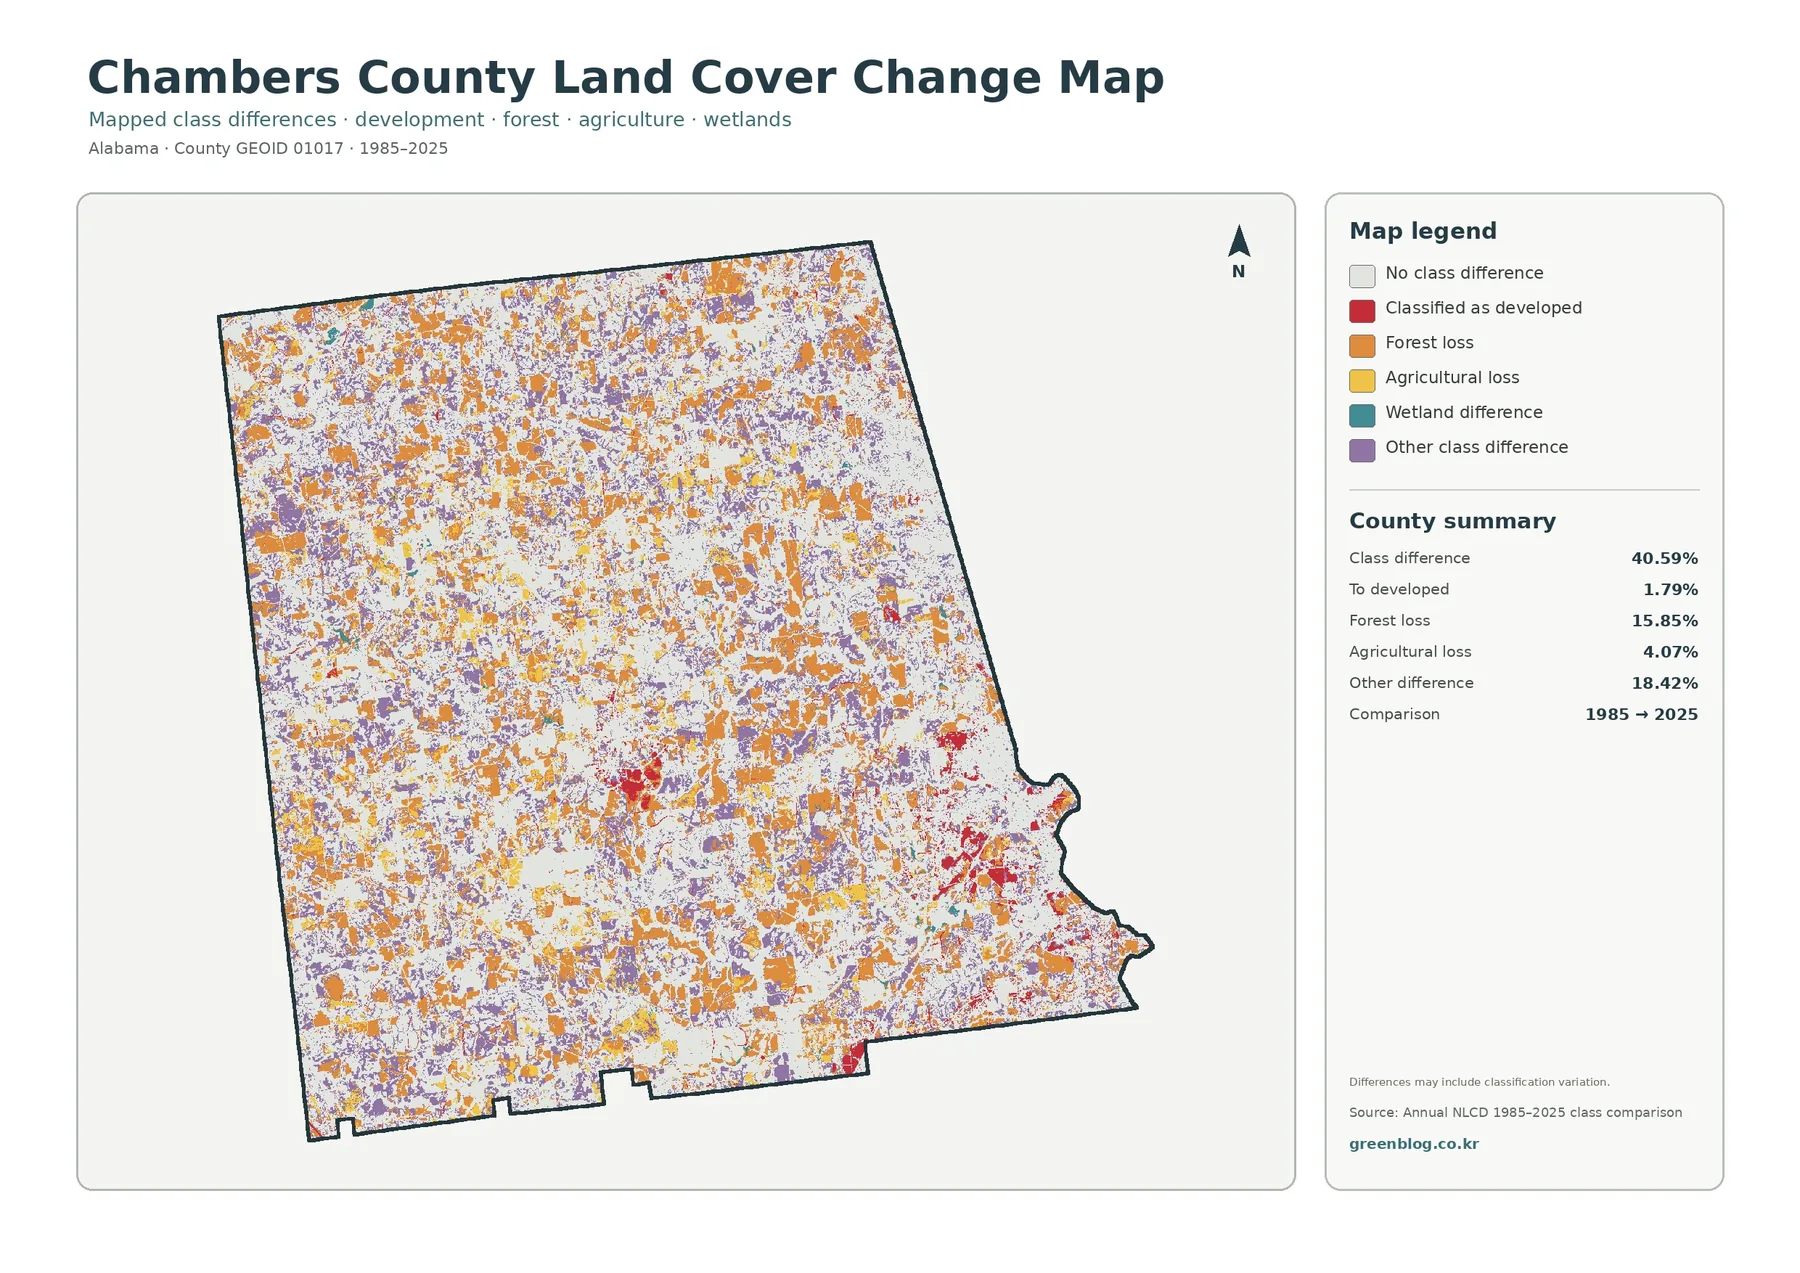
How to interpret the 40.59% class difference from 1985 to 2025
The change map compares the 1985 and 2025 classifications and reports a class difference across 40.59% of Chambers County. The summary separates 1.79% classified as developed, 15.85% forest loss, 4.07% agricultural loss, and 18.42% other class difference. The legend also identifies wetland difference as a separate mapped category. White areas indicate no class difference between the two endpoints, while colored patches mark locations where the assigned classes differ.
Orange forest-loss patches are widely scattered, and purple other-difference areas also occur throughout the county. Red developed-change areas are more noticeable around the eastern settlement pattern and near the interior developed center. Agricultural-loss colors appear in smaller pieces across parts of the forest-and-open-land mosaic. The map therefore does not suggest one single front of change; it shows many different class transitions distributed around the county.
The 40.59% figure should not be read as proof that 40.59% of the ground was physically transformed in one simple way. The map itself notes that differences can include classification variation. Image conditions, mixed pixels, changes in classification, temporary vegetation conditions, and actual surface change can all contribute to an endpoint difference. The layer is valuable for locating places that deserve a closer look, but it cannot explain the cause or exact date of every change by itself.
The same caution applies to the 15.85% forest-loss summary. It means cells classified as forest in the earlier comparison were assigned to a different class by 2025; it does not say that every one of those cells was cleared for development. Some could move into shrub, grass, agriculture, developed, or another category. Agricultural loss at 4.07% should likewise be treated as a class transition, not an automatic conclusion that farming permanently ended there.
A practical way to compare all four map views
For a quick county overview, start with the general land-cover map and identify the broad forest, agricultural, developed, wetland, and water pattern. Move next to the forest-and-farmland view when the goal is to understand how woods and open rural land fit together. If the eastern or central developed areas are the focus, use the impervious layer to separate hard surfaces from the broader developed-land classification.
The change map is easier to interpret after the present-day pattern is familiar. Find a location on the 2025 map first, then check the same part of the change layer. This approach makes the difference between “developed land in 2025” and “classified as developed between the two endpoint maps” much clearer. The two concepts are related, but they are not interchangeable.
In a classroom or presentation, choosing the map that matches the question usually works better than displaying every class at once. The forest-and-farmland view is good for rural-cover comparisons, the impervious layer is direct for pavement and rooftops, and the change view is useful for discussing how classifications can differ across decades. When showing the change map, include the limitation that endpoint differences do not identify a cause.
For a preliminary report, the four-map sequence can help narrow the next research step. A visible cluster on one map can be checked on another, then compared with county GIS, Census boundaries, aerial imagery, or year-by-year Annual NLCD data. That workflow uses the maps as evidence for where to investigate further rather than treating a single raster image as a final answer about a parcel or development decision.
Download the four original JPG maps
The download ZIP contains four original JPG files: the 2025 land-cover map, forest-and-farmland map, impervious-surface and developed-land map, and 1985–2025 class-difference map. Each JPG is 2480×1754 pixels, larger than the 1800-pixel-wide WebP previews shown in the article. Keeping the same county extent across the files makes side-by-side comparisons straightforward in a document or slide deck.
The asset manifest does not mark these files as meeting an A3 high-resolution reference, so large-format printing should be checked before final output. At ordinary document and presentation sizes, the original JPGs provide a useful saved version of the map layouts and legends. Enlarging the image does not create finer ground detail than the underlying land-cover data contains.
The files can also be used for county-to-county comparison, as long as the year, legend, and measurement are kept clear. A report might compare forest share and development concentration across counties or place the present-day and change maps next to each other. Keeping the original legend visible is important because similar colors can represent different concepts in the general, impervious, and change views.
Limits to remember when zooming into a 30-meter raster
Annual NLCD land cover is raster data. In simple terms, the landscape is divided into grid cells and each cell receives a representative land-cover class or value. At 30-meter spatial resolution, one cell can contain a mixture of trees, lawn, road, roof, water, or bare soil, yet it must be summarized for mapping. That is why a colored boundary should not be expected to match a parcel line, field edge, or stream bank exactly.
Narrow roads, small ponds, individual buildings, and thin streams can be smaller than a cell and may blend with surrounding cover. Zooming farther into the JPG makes the pixels larger on the screen but does not improve the spatial accuracy of the source data. Parcel ownership, zoning, buildability, road right-of-way, and regulated wetland boundaries require current local or agency data rather than this county-scale land-cover map.
The 2025 map is also a snapshot of the classification for that year. Construction, timber harvest, vegetation recovery, crop changes, and other changes after the observation year are not represented. The 1985–2025 comparison uses two endpoints and therefore cannot show every intermediate transition during the forty-year period. Annual NLCD layers and aerial photography are better tools when the timing of a change matters.
Used with those limits in mind, the maps are useful because they quickly separate broad questions. They can show where forest dominates, where farms and open cover are mixed with woods, where hard surfaces are concentrated, and where endpoint classifications differ. Those patterns can guide a more detailed review without pretending that the raster provides parcel-level legal or engineering information.
Frequently Asked Questions
What is the largest land-cover class in Chambers County in 2025?
Forest is the dominant 2025 class at 55.32%. Agriculture follows at 13.74%, with grassland at 8.09%, developed land at 7.92%, shrubland at 7.46%, wetlands at 6.14%, and water at 1.17%. The percentages describe countywide share, while the maps show where those classes actually occur and whether they are concentrated or fragmented.
Why is developed land 7.92% while mean impervious surface is only 1.52%?
Developed land is a broader land-cover category that can include lawns, trees, soil, and other permeable surfaces around homes and businesses. Impervious surface measures hard cover such as pavement and rooftops. A low-density developed area can therefore be classified as developed without having a high impervious percentage, so the two values should not be expected to match.
Does the 40.59% change value mean that much of the county was developed?
No. The 40.59% value is the share with a different land-cover class between the 1985 and 2025 comparison. Only 1.79% is summarized as classified to developed in that comparison. The overall difference can include forest, agricultural, wetland, other class transitions, and some classification variation, so additional time-series evidence is needed to explain causes.
What is included in the downloadable ZIP?
The ZIP includes four original 2480×1754 JPG maps: general 2025 land cover, forest and farmland, impervious surface and developed land, and 1985–2025 class difference. The files are larger than the article previews, but the package does not mark them as meeting an A3 high-resolution reference, so large printing should be tested first.
Map File Information
Chambers County Land Cover Maps Four original JPG maps: 2025 land cover, forest and farmland, impervious surface and developed land, and 1985–2025 class difference
- Included Files: Use only the versions confirmed in the article and supplied images
- File Type: Use the confirmed download contents
- Intended Use: Printing, education, presentations, and map-based projects
Related Maps
- Autauga County Alabama Land Cover Map
- Baldwin County Alabama Land Cover Map
- Barbour County Alabama Land Cover Map
Sources and reference links
- MRLC Annual NLCD Data – official access to Annual NLCD and related land-cover products.
- USGS Annual NLCD Land Cover Classification – explanation of the land-cover classification system.
- U.S. Census Bureau TIGER/Line Shapefiles – county boundary and geographic reference data.
- Chambers County Commission – official county government information, including road and bridge resources.
- Alabama Cooperative Extension System – Chambers County – local extension contacts for forestry, natural resources, agriculture, and related topics.
Green Map creates custom-edited map images using open geographic data sources such as geoBoundaries, Natural Earth, OpenStreetMap, and government open data.
These maps are edited visual materials, not raw data files, and are provided for education, documents, presentations, and graphic reference.