Population in Alabama is not distributed in one simple statewide pattern. A county can have a large number of residents but still contain extensive low-density land, while another county can have fewer residents yet rank much higher in people per square mile. City population adds another layer because a Census place measures people inside a defined place boundary rather than an entire county. This map set separates those questions instead of combining them into one number.
The supplied 2024 ACS 5-year material lists Alabama at 5,086,768 residents. The county-density map also gives about 50,651 square miles of land and a statewide average near 100 people per square mile. That average is a useful reference, but it hides substantial geographic variation. The detailed map shows compact high-density clusters around major urban areas and broad lower-density zones across much of the state.
Table of Contents
Detailed tract density shows where residents are actually concentrated
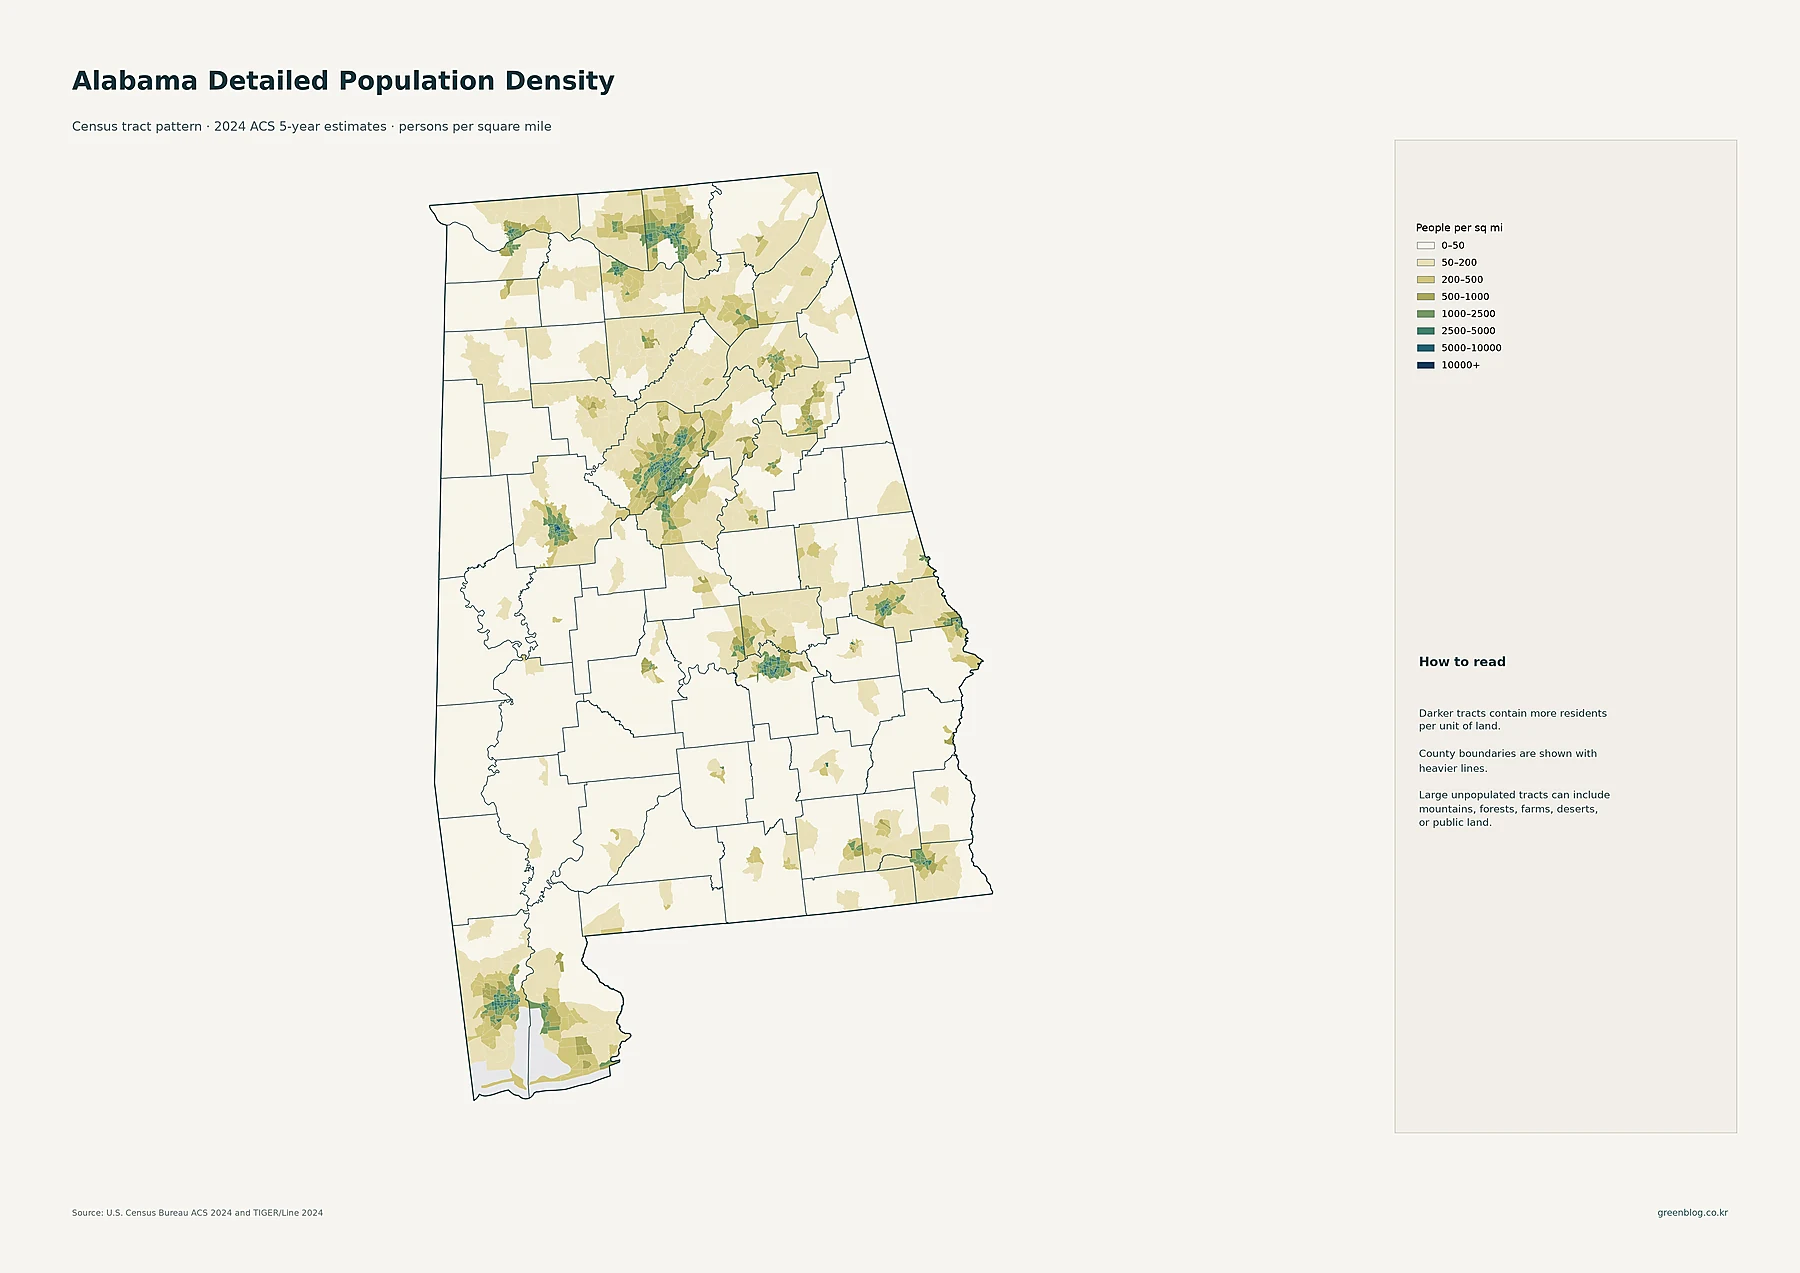
The first map divides Alabama into census tracts rather than assigning one average value to an entire county. Its legend runs from 0–50 people per square mile through 50–200, 200–500, 500–1,000, 1,000–2,500, 2,500–5,000, 5,000–10,000, and 10,000 or more. County boundaries remain visible as heavier outlines, making it possible to see how much density can vary inside the same administrative area.
The strongest concentration is visible in central Alabama around Birmingham, with another prominent cluster in the north around Huntsville. Mobile creates a distinct dense area in the southwest. Smaller but still visible concentrations appear around Montgomery, Tuscaloosa, Auburn–Opelika, Dothan, and several other urban centers. Large portions away from those clusters fall into the lighter categories. For readers trying to locate compact settlement rather than compare county averages, this is the most informative map in the set.
The major-city map gives names and scale to those clusters
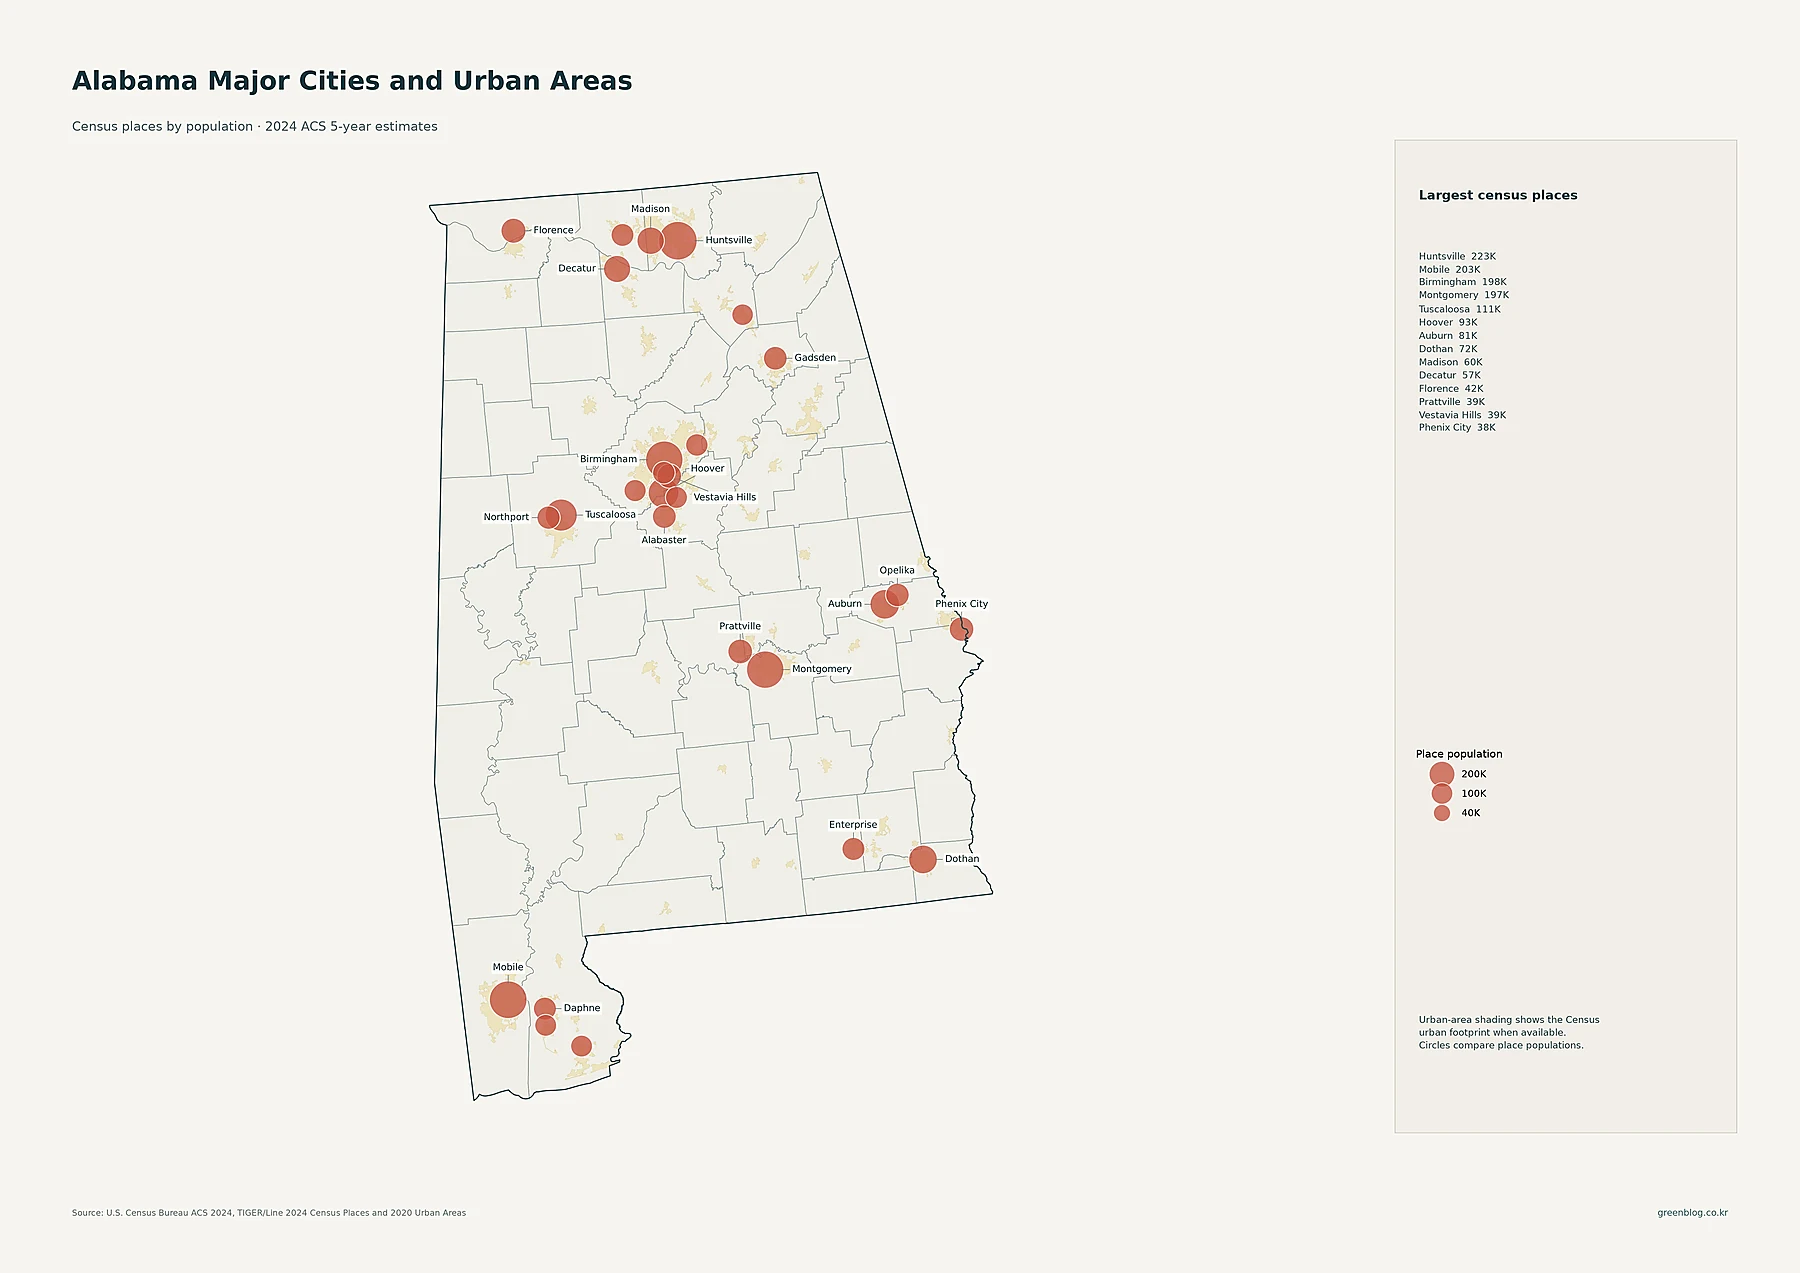
Circle size on this map represents total Census place population, not density. The supplied place table lists Huntsville at 222,791 residents, Mobile at 203,416, Birmingham at 198,173, and Montgomery at 197,494. Tuscaloosa follows at 111,038. Other large places include Hoover at 92,642, Auburn at 80,594, Dothan at 71,514, Madison at 60,106, and Decatur at 57,361.
The geography matters as much as the ranking. Huntsville, Madison, and Decatur form a visible northern grouping. Birmingham sits in a tight central cluster with Hoover and Vestavia Hills. Auburn and Opelika appear together in the east, and Mobile and Daphne stand out near the Gulf Coast. Comparing this map with the tract-density map helps connect anonymous dark tracts with recognizable population centers without assuming that every urban-area polygon has the same density.
County population totals measure size, not crowding
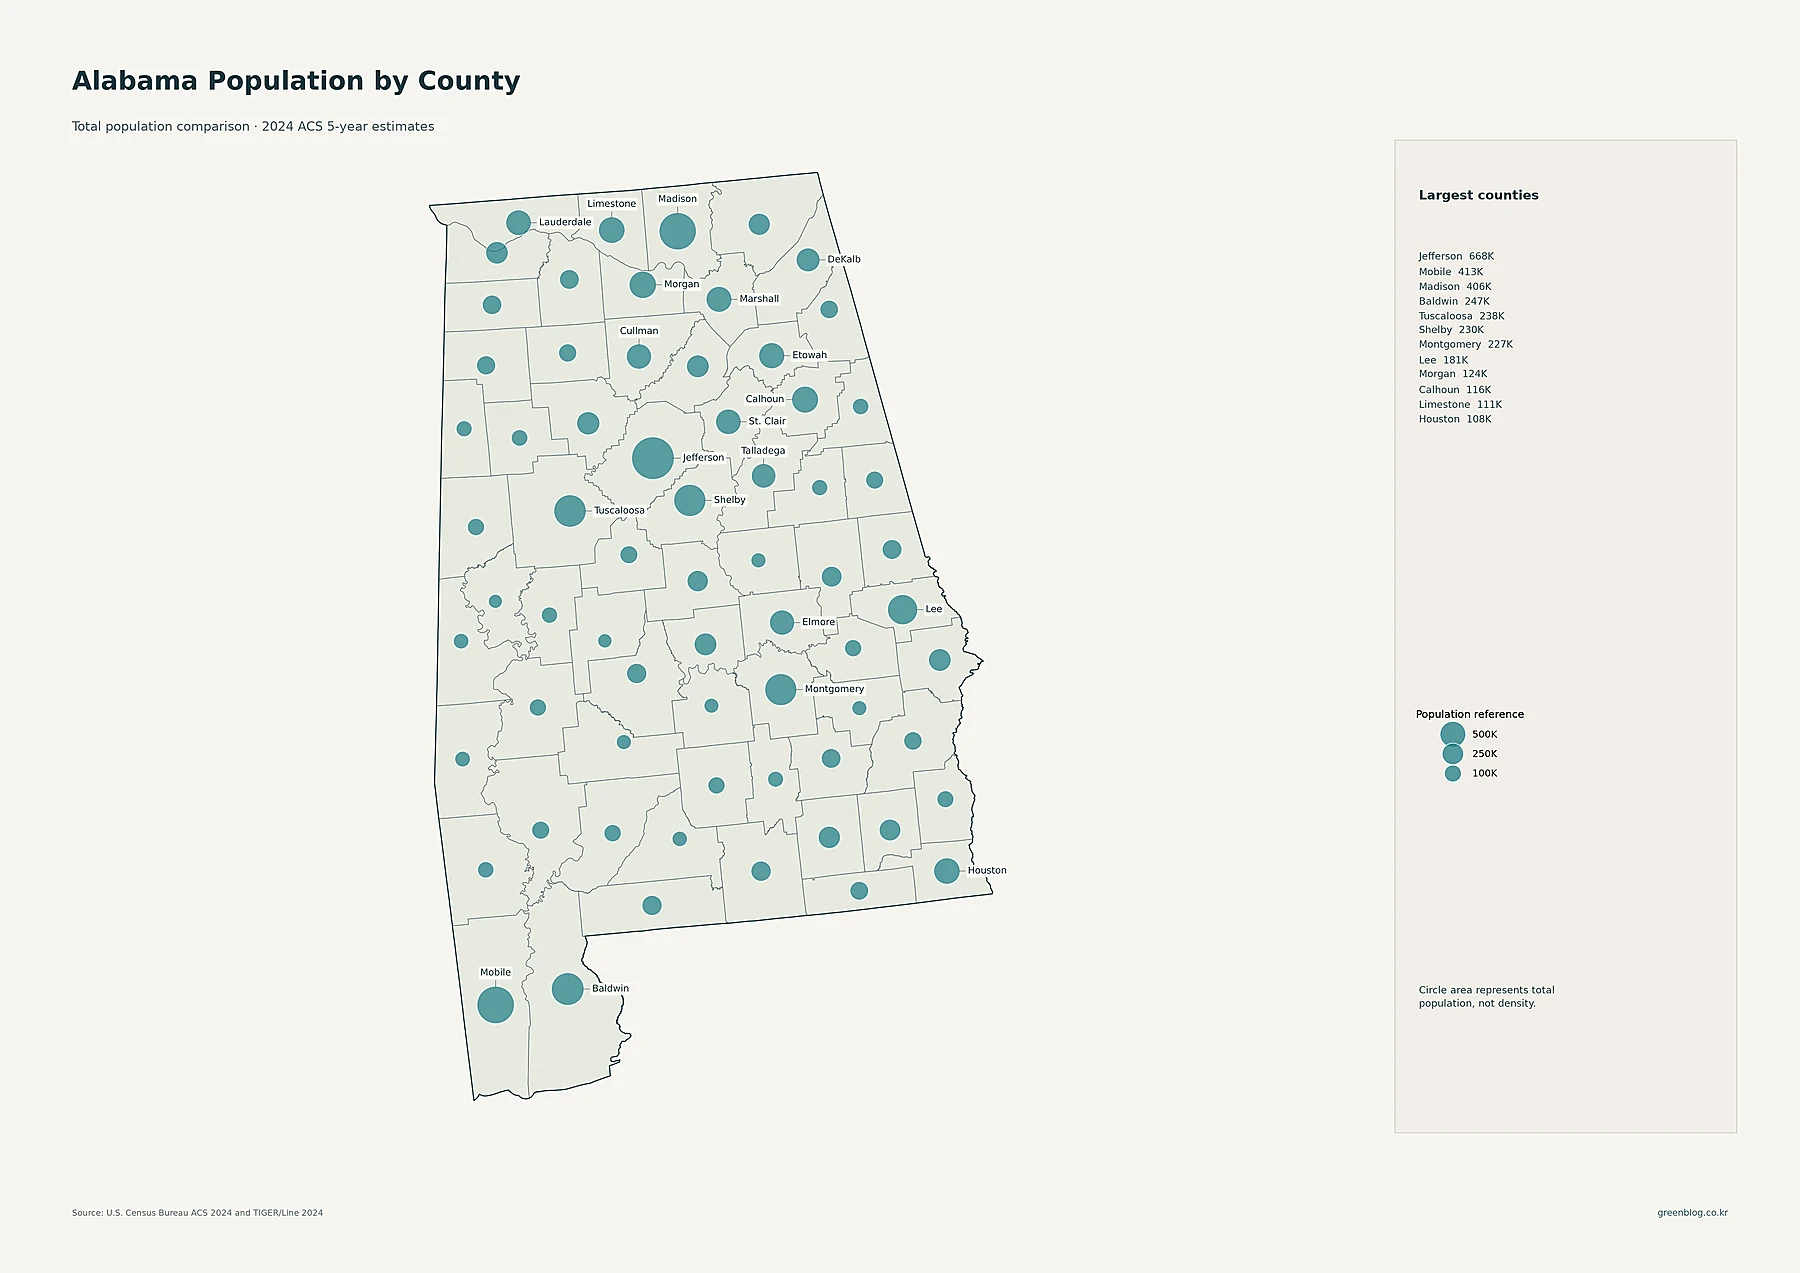
Jefferson County has the largest 2024 estimated population in the supplied county file at 667,755. Mobile County follows at 412,590 and Madison County at 405,718. Baldwin County has 246,989 residents, Tuscaloosa County 237,552, Shelby County 230,211, and Montgomery County 226,718. The largest circles therefore identify the counties containing the most residents, but they do not account for land area.
Baldwin and Lee illustrate the difference well. Baldwin has a much larger 2024 population, yet its density is about 155.4 people per square mile. Lee County has 181,134 residents but a density of about 298.1 people per square mile. Total population answers “how many people live in this county?” Density answers “how closely are those residents distributed over the county’s land?” Using both prevents a large geographic county from being mistaken for an especially dense one.
| County | 2024 estimated population | Density per sq. mi. | 2010–2020 change |
|---|---|---|---|
| Jefferson | 667,755 | 600.7 | +2.5% |
| Madison | 405,718 | 506.1 | +15.9% |
| Mobile | 412,590 | 335.6 | +0.4% |
| Lee | 181,134 | 298.1 | +24.2% |
| Shelby | 230,211 | 293.1 | +14.3% |
| Baldwin | 246,989 | 155.4 | +27.2% |
The 2010–2020 change map answers a historical question
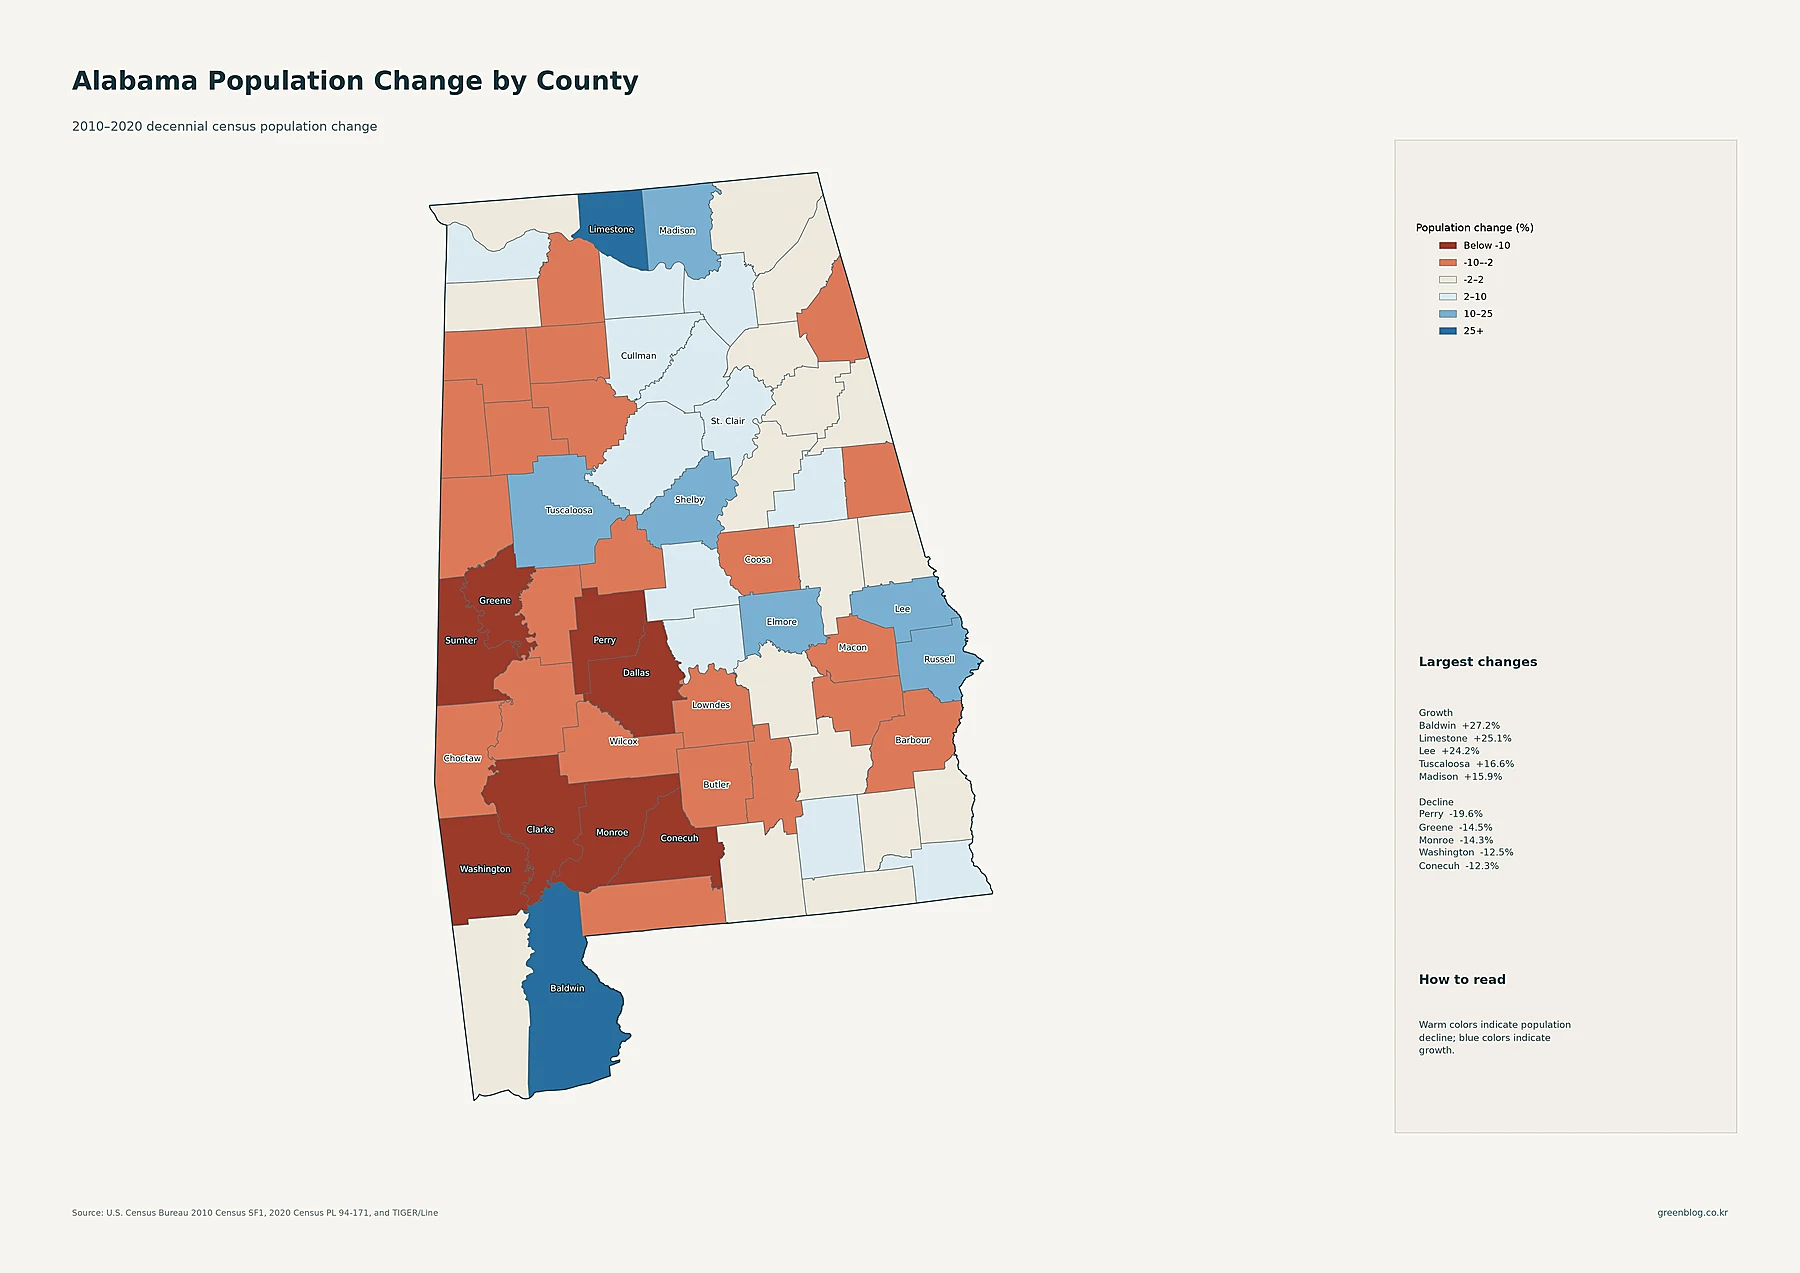
This map should not be treated as a 2024 growth map. It compares population counts from the 2010 and 2020 decennial censuses. Baldwin County records the largest percentage increase in the supplied data at about 27.2%. Limestone County is next at 25.1%, followed by Lee at 24.2%, Tuscaloosa at 16.6%, Madison at 15.9%, and Shelby at 14.3%. Their blue shading creates several clear growth areas: Limestone and Madison in the north, Tuscaloosa and Shelby in the central portion of the state, Lee in the east, and Baldwin along the Gulf Coast.
The largest percentage decline is Perry County at about -19.6%. Greene is about -14.5%, Monroe -14.3%, Washington -12.5%, Conecuh -12.3%, and Dallas -12.2%. Several western and southwestern counties therefore form a visible band of warm decline colors. The map establishes direction and magnitude, but it does not establish causes. Explanations involving migration, employment, housing, universities, military facilities, or retirement patterns would require separate evidence.
County density produces a different statewide ranking
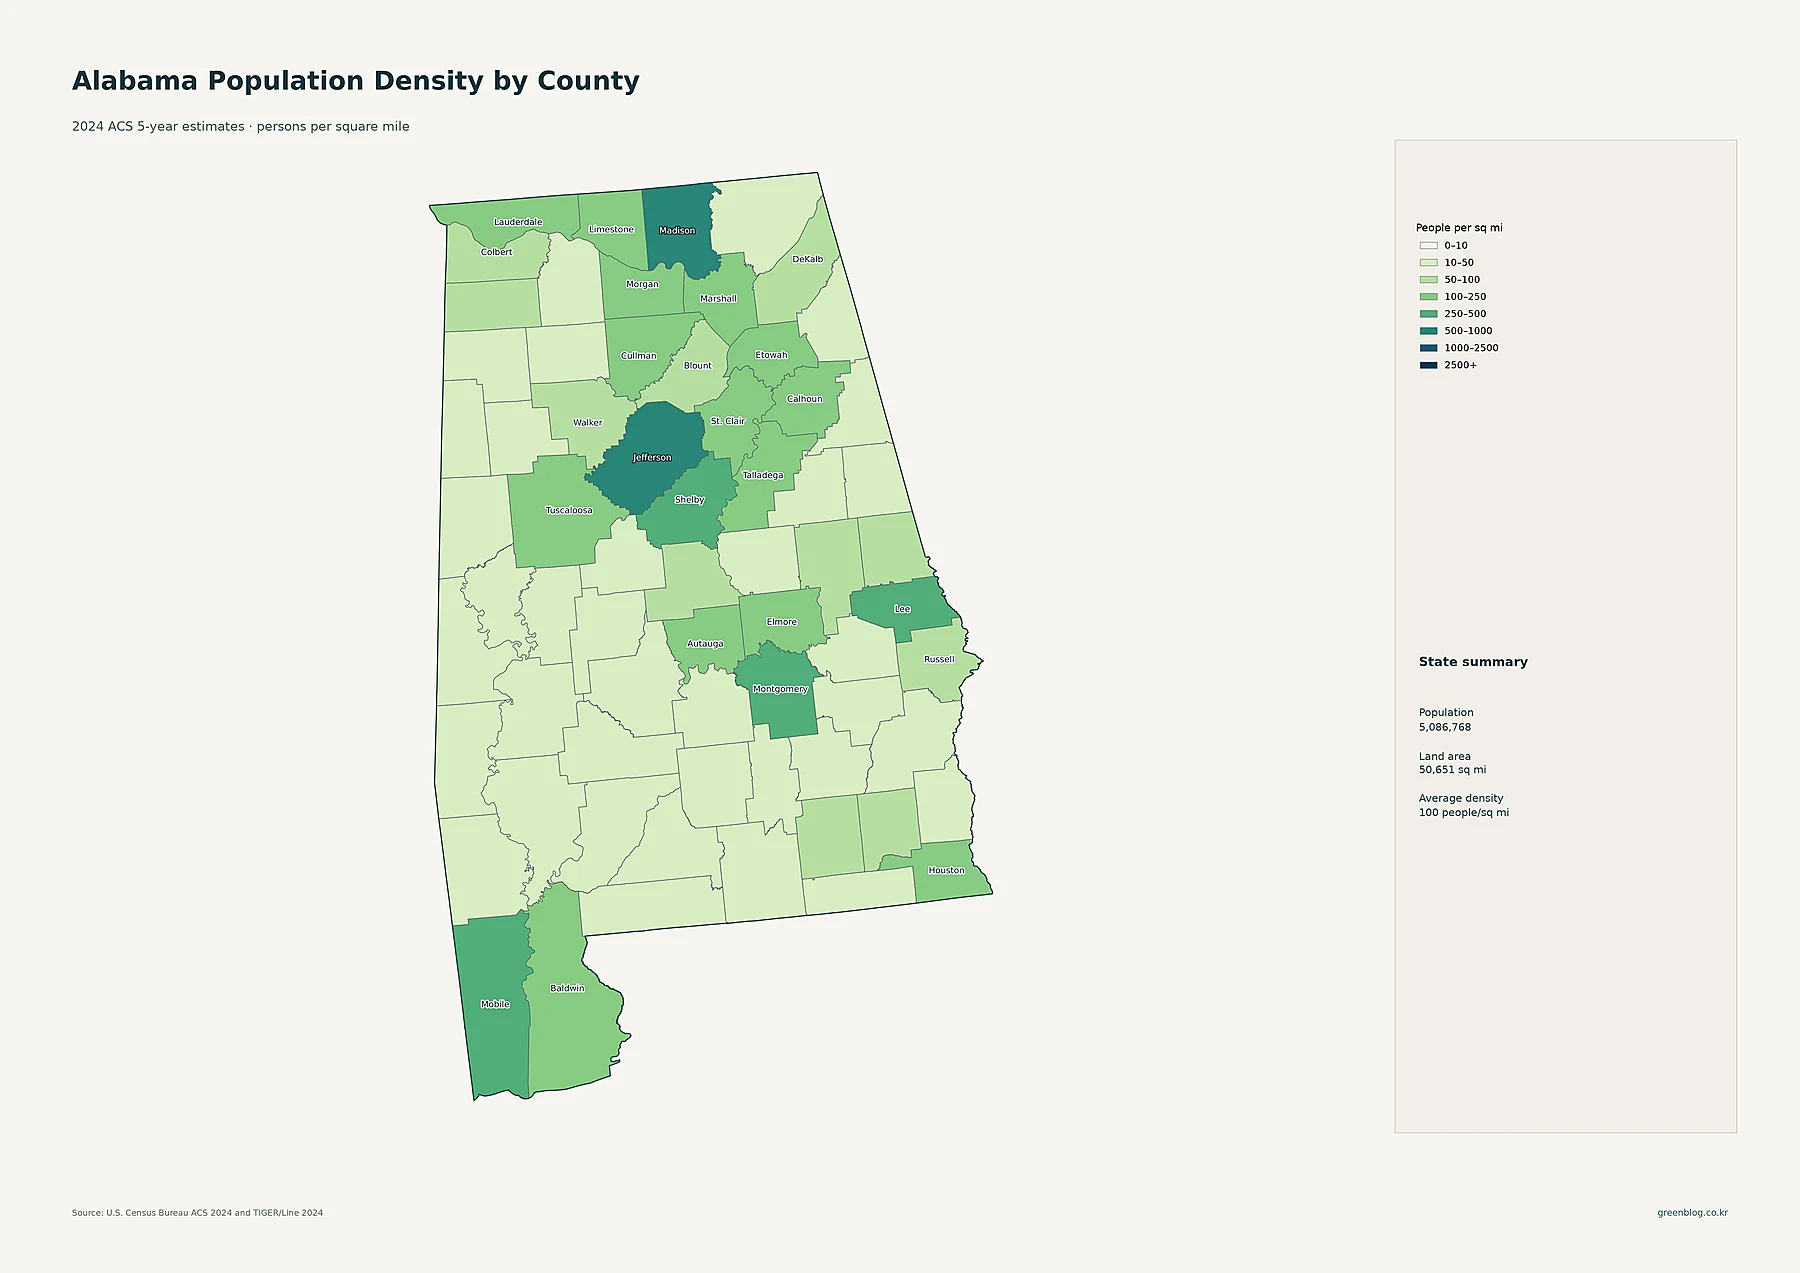
Jefferson County ranks highest in the supplied density table at about 600.7 people per square mile, with Madison County at about 506.1. Mobile is about 335.6, Lee 298.1, Shelby 293.1, and Montgomery 288.7. Morgan is about 214.7, Limestone 197.4, Etowah 192.7, and Calhoun 191.6. Those values explain the darker county shading concentrated around several of Alabama’s major population centers.
At the low end, Perry County is about 11.2 people per square mile, Wilcox about 11.5, Greene about 11.5, Sumter about 13.1, and Conecuh about 13.3. The statewide contrast is therefore substantial. A single Alabama average near 100 people per square mile cannot describe both the densest urban counties and the sparsest rural counties particularly well.
The county and tract maps are complementary rather than interchangeable. The county map is better for a quick comparison of all 67 counties because every county receives one density value. The tract map is better for seeing how settlement is arranged inside those counties. A relatively dense county can still contain broad low-density outer areas, while a lower-density county may contain one compact town that stands out sharply against its surroundings.
How to read the five maps as one population profile
A useful sequence is to start with the tract-density map when the question is where people are concentrated. Move to the major-city map to identify the named places behind those clusters. Then compare county population totals with county density so that population size is not confused with people per unit of land. Finish with the 2010–2020 change map when the question shifts from current distribution to historical direction.
The maps also show why one ranking rarely tells the whole story. Baldwin combines a large 2024 population with the strongest 2010–2020 percentage growth among Alabama counties in the supplied data, yet it is less dense than Jefferson, Madison, Mobile, Lee, Shelby, or Montgomery. Madison combines high density with strong decennial growth. Mobile has one of the largest county populations and one of the largest Census places, but its 2010–2020 county change was only about +0.4%. Each map contributes a different piece of the picture.
The 2024 ACS 5-year estimates are survey estimates compiled across multiple years rather than a single-day population count. Geography in the current maps uses 2024 TIGER/Line material. For research, planning, or citation work that depends on an exact number, these maps work best as an overview; the corresponding Census Bureau table should be checked for the specific county, tract, or Census place.
Download the Alabama population map collection
Alabama Population Map Collection
The ZIP contains the detailed tract-density map, major cities and urban areas, county population totals, 2010–2020 county change, and county population density.
Frequently asked questions
Which Alabama county has the highest population density in this dataset?
Jefferson County is highest at about 600.7 people per square mile in the supplied 2024 ACS-based county table. Madison County follows at about 506.1, with Mobile, Lee, Shelby, and Montgomery also ranking relatively high.
Is Huntsville larger than Birmingham on the city map?
Yes. The supplied 2024 ACS 5-year Census place data lists Huntsville at 222,791 residents and Birmingham at 198,173. This is a comparison of Census place populations, not metropolitan-area populations.
Does the population-change map show change through 2024?
No. It compares the 2010 and 2020 decennial censuses. The other population and density maps use 2024 ACS 5-year estimates, so the time periods should remain separate when interpreting the set.
Related Maps
Official data sources
- U.S. Census Bureau — American Community Survey (ACS)
- U.S. Census Bureau — 2024 TIGER/Line Shapefiles
- U.S. Census Bureau — 2020 Census
- U.S. Census Bureau — 2010 Census
Green Map creates custom-edited map images using open geographic data sources such as geoBoundaries, Natural Earth, OpenStreetMap, and government open data. These maps are edited visual materials, not raw data files, and are provided for education, documents, presentations, and graphic reference.