Escambia County has a strong north-to-south land-cover contrast in the 2025 data. Forest is the largest class at 25.92%, but the broad developed area in the south is nearly as large at 23.66%. Wetlands account for 20.26%, water for 11.44%, and agriculture for 11.09%. The four maps on this page separate those patterns into a general land-cover view, a forest-and-farmland view, an impervious-surface view, and a 1985–2025 class-difference view.
The WebP images are intended for quick on-page comparison, while the four original JPG maps are available together in one download below. They are useful for seeing how the wooded and agricultural north differs from the more developed southern part of the county, and for comparing that urban footprint with bays, wetlands, and coastal water. These are land-cover maps, not zoning, parcel, ownership, flood, or permitting maps.
Table of Contents
One county, two very different visual patterns in the 2025 overview
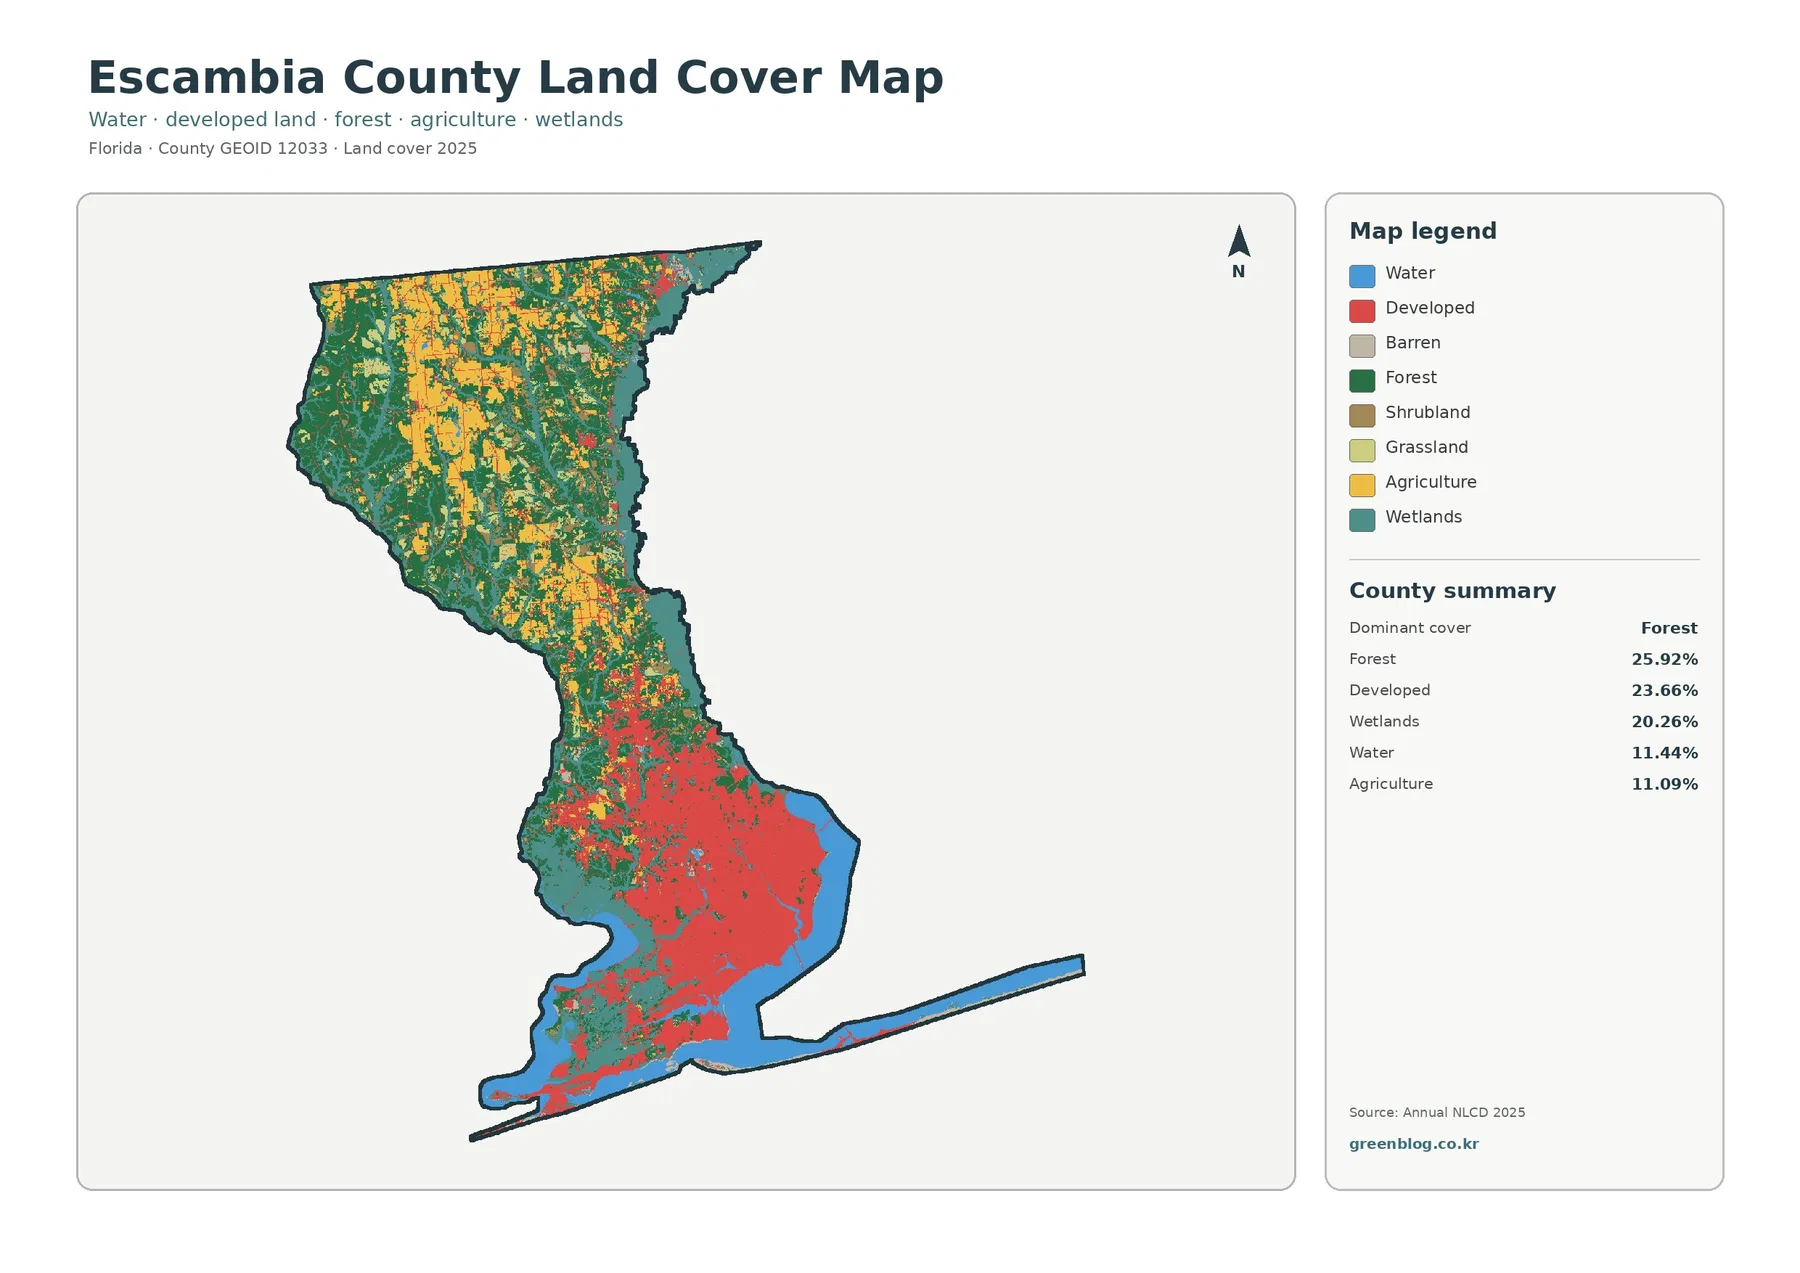
The most useful feature of the general map is not simply the ranking of the percentages. Forest leads at 25.92%, yet the green class is spread mainly through the northern and middle parts of the county rather than forming one uniform blanket. Yellow agricultural patches repeatedly interrupt those wooded areas. Moving south, the color balance changes quickly as developed land becomes much more continuous and water begins to occupy a larger share of the visible landscape.
Developed cover represents 23.66% of the county. Red areas form a broad concentration in the south, with smaller lines and clusters extending northward. Because that developed surface is spatially concentrated, it can look more dominant on the page than its countywide percentage alone would suggest. The pattern is a reminder that a single average or class share can hide a large internal difference between the northern and southern parts of a county.
Wetlands make up 20.26%, and water adds another 11.44%. Blue water is especially prominent along the southern and eastern edges and around the long coastal and bay shapes. Teal wetland areas border water in many places but also appear inland. Water and wetlands should not be treated as one class: open water identifies exposed water surface, while wetland classifications can include vegetated areas strongly influenced by water.
Agriculture accounts for 11.09%. Its yellow patches are much more common in the northern half, where they sit among forest, wetlands, grassland, and shrubland. Grassland is 3.44% and shrubland is 2.73%, so neither creates the main county pattern. They are more useful for understanding the smaller transitions among forest, farmed ground, open vegetation, and wet areas.
This overview is the best place to begin because it keeps all of those classes in the same frame. It answers the broad question of where the county changes from a forest-and-farm landscape to a heavily developed one, while also showing that water and wetlands remain important in the developed south. The class boundaries are raster classifications, however, not survey lines. A small colored patch should not be interpreted as a legal property or regulatory boundary.
Hard surfaces reveal the southern urban footprint more clearly than the general map
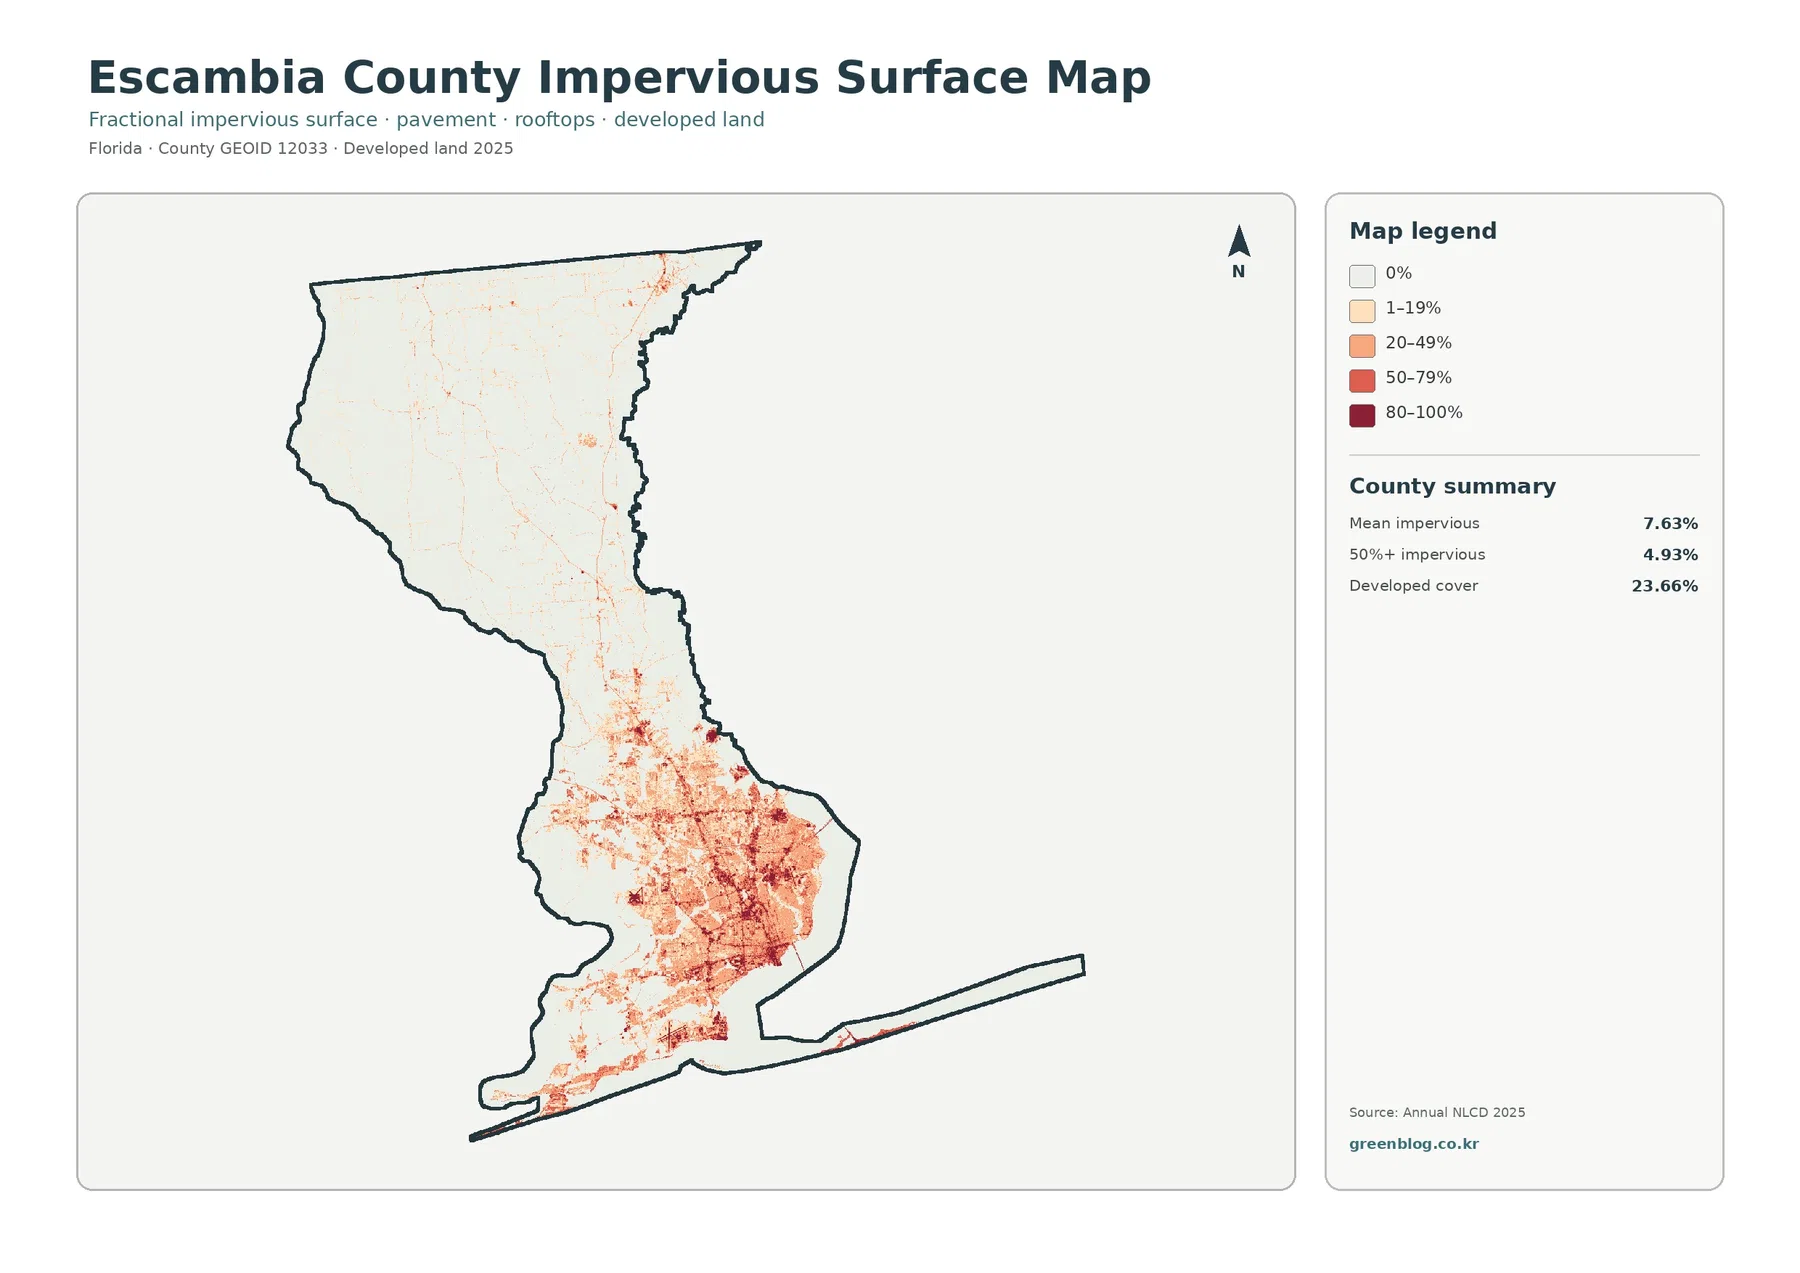
Escambia County’s mean imperviousness is 7.63%, and 4.93% of the mapped area is at least 50% impervious. Those figures are much lower than the 23.66% developed-cover share because the two measurements answer different questions. Developed land cover can include lawns, trees, open soil, and other permeable surfaces mixed with buildings and pavement. Imperviousness focuses on the harder surfaces that shed rather than absorb water.
The strongest red tones are concentrated in the southern part of the county. A dense network of darker cells surrounds the main developed area, while the northern half is mostly pale with occasional lines or small clusters. This is one of the clearest maps for showing why the countywide mean should not be used to describe every part of Escambia County. The average combines a highly urbanized southern area with extensive forest, agriculture, wetlands, and lower-density land farther north.
The 4.93% figure for areas at or above 50% imperviousness isolates the more heavily paved and roofed portions of the county. It is not the percentage of commercial or industrial land, and it cannot be converted directly into building coverage. A neighborhood can be classified as developed while still containing substantial tree canopy and lawns, and a road corridor can have high imperviousness without representing a large developed polygon by itself.
Escambia County’s Natural Resources Management Department works across water quality, land management, marine resources, conservation, and related environmental programs. That local context matters because the impervious map shows hard surfaces close to bays, wetlands, and drainage areas in the southern county. The map can help explain where urban surfaces are concentrated, but official environmental review still requires the county’s current regulatory, drainage, wetland, and permitting information.
For a presentation, pairing the impervious map with the general land-cover map is especially effective. The overview establishes the size of the developed class; the impervious layer then separates the most intensely hardened surfaces from the broader developed footprint. That comparison is more informative than treating every red developed cell as equally paved.
Forest and farmland define the northern half when urban colors are muted
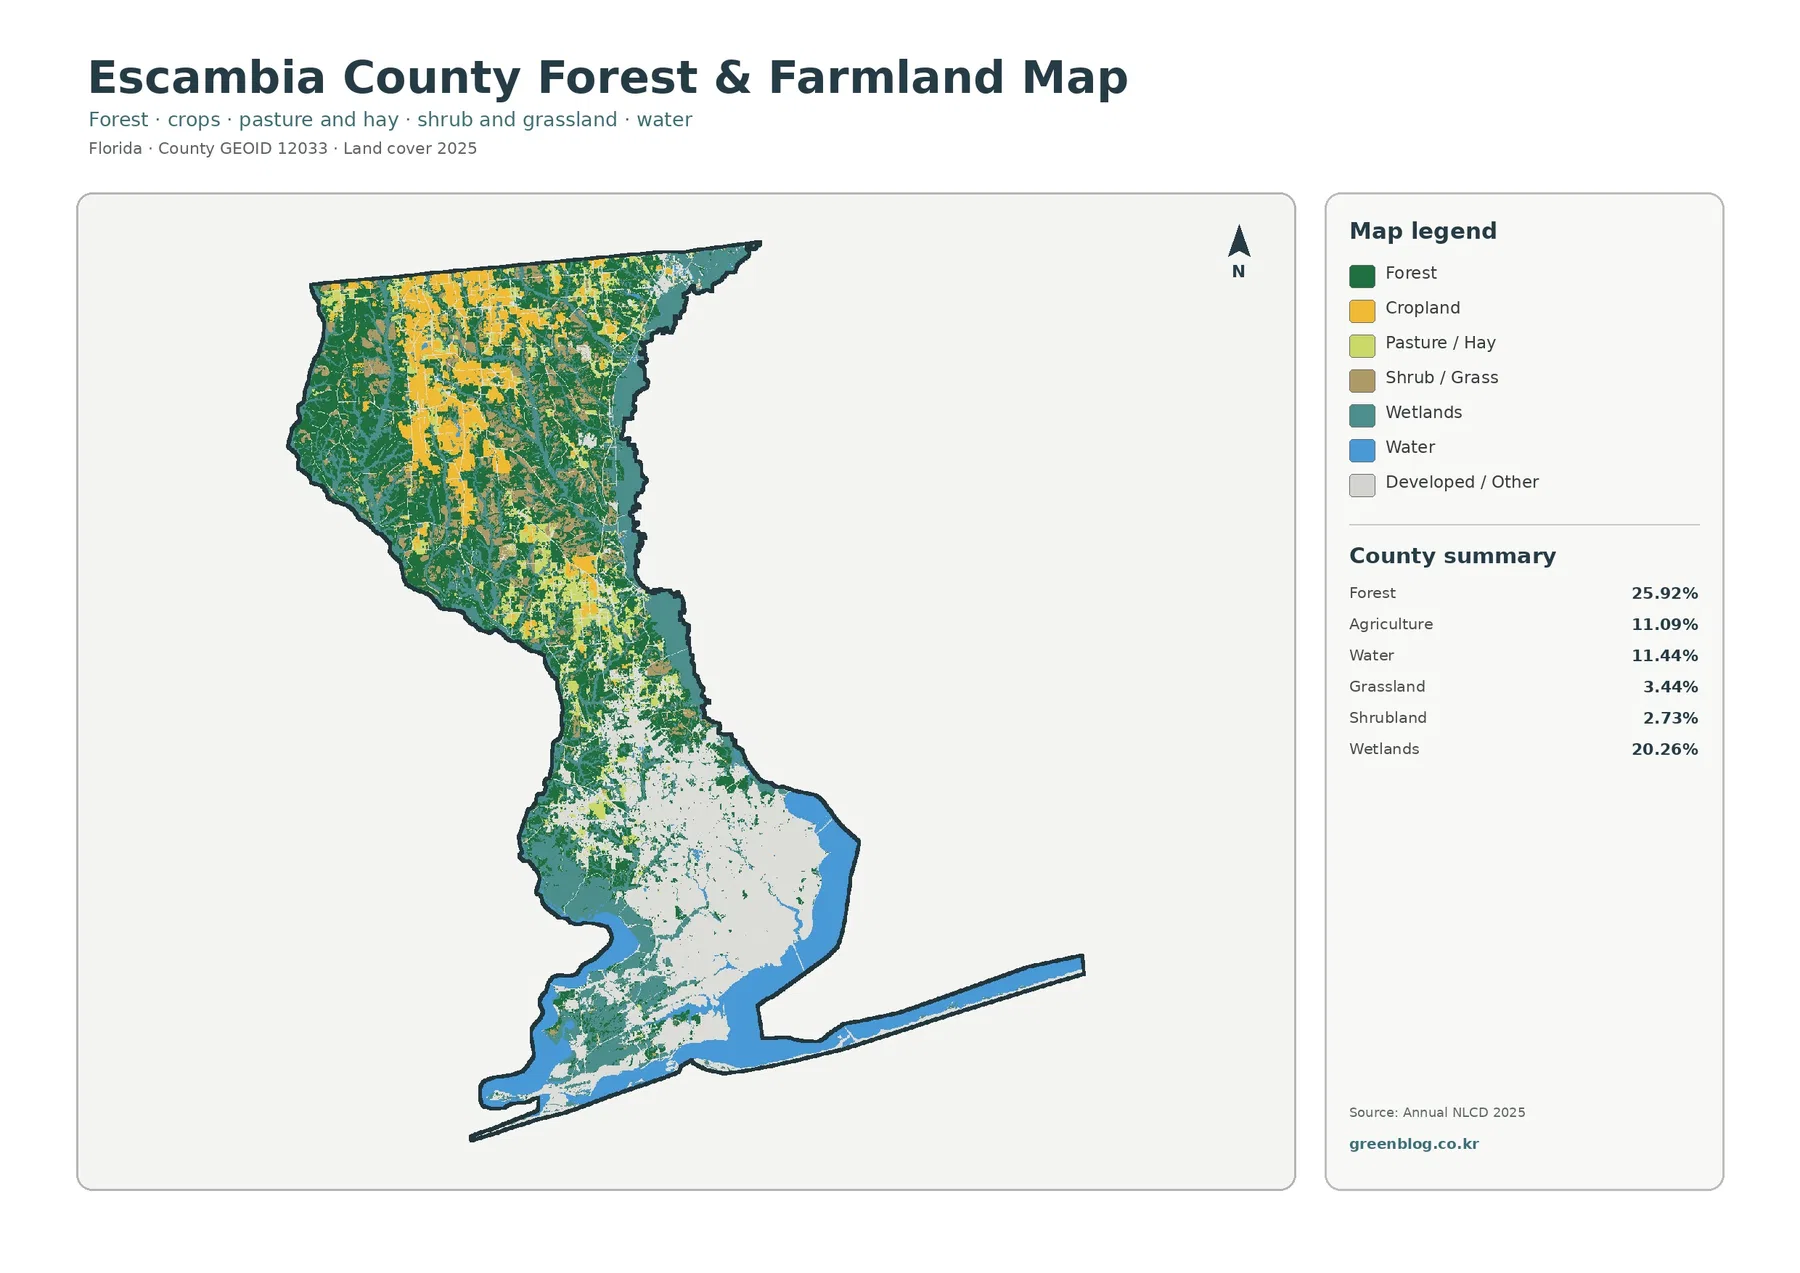
Removing the visual weight of the developed class changes the way Escambia County looks. Forest becomes the obvious background across much of the north, where the 25.92% forest share forms broad green blocks. Agricultural land at 11.09% appears as repeated yellow patches within and beside those wooded areas. The result is not a single farm belt or one continuous forest, but a patchwork of working land, forest, wetlands, and smaller open-vegetation classes.
Agricultural cover is noticeably more frequent in the northern and north-central portions than in the heavily developed south. The supplied summary gives one agriculture total, so the map should not be used to invent separate percentages for cropland and pasture/hay. Its stronger use is spatial: it shows where agricultural cover occurs and how often it borders forest and wetland classes.
Grassland contributes 3.44% and shrubland 2.73%. These classes appear in smaller pieces rather than defining the countywide pattern. They can mark open or lower-stature vegetation between larger land-cover types, but the classification does not identify a management practice, ownership, or specific plant community for each cell.
Wetlands remain highly visible in this specialized map. Their 20.26% share extends through more than the coastal fringe, appearing among forested and agricultural areas as well. That matters when describing the north: it is not simply a dry upland landscape of woods and farms. Wet areas repeatedly break up the green and yellow pattern and help explain why the county’s natural cover is more varied than the two largest northern classes suggest.
UF/IFAS Extension Escambia County maintains agriculture and small-farm resources for local producers and residents. That county-specific source provides useful background for the agricultural patches visible in the northern map. Annual NLCD, however, does not identify individual farms, crops, production totals, or ownership. Those questions require agricultural records or local field information rather than a land-cover raster.
Pensacola Bay watershed context helps explain why development, water, and wetlands meet in the south
The southern pattern is easier to understand with local geography in mind. Escambia County describes Bayou Chico as part of the Pensacola Bay watershed in south-central Escambia County, with portions of its drainage basin inside the City of Pensacola and adjacent unincorporated areas. That official description fits the broad map pattern in which developed surfaces, open water, and wetland cover occur close together rather than in separate parts of the county.
The county’s Jones Swamp Wetland Preserve program provides another local example. Escambia County explains that the preserve protects wetlands in the Jones Creek watershed and supports downstream water-quality improvement toward Bayou Chico and Pensacola Bay. The teal cells on the land-cover map are not preserve boundaries, but the program illustrates why wetland cover can remain important even near a large urban area.
Farther southwest, Perdido Key adds a barrier-island setting to the county’s coastal landscape. Escambia County’s habitat conservation program discusses beach, dune, wildlife habitat, and development on the key. On the countywide map, the long narrow coastal shape and surrounding water are visible at a much smaller scale. The land-cover layer cannot show the detailed conservation boundaries, but it can place those coastal environments in the broader county pattern.
These local references are useful for interpretation, not for substituting one map for another. A wetland-class cell is not automatically a regulated wetland boundary, and a developed cell does not provide zoning or development rights. Escambia County Planning and Zoning and Natural Resources Management publish the appropriate local information for those legal and administrative questions.
The 1985–2025 layer locates class differences, not a simple forty-year growth rate
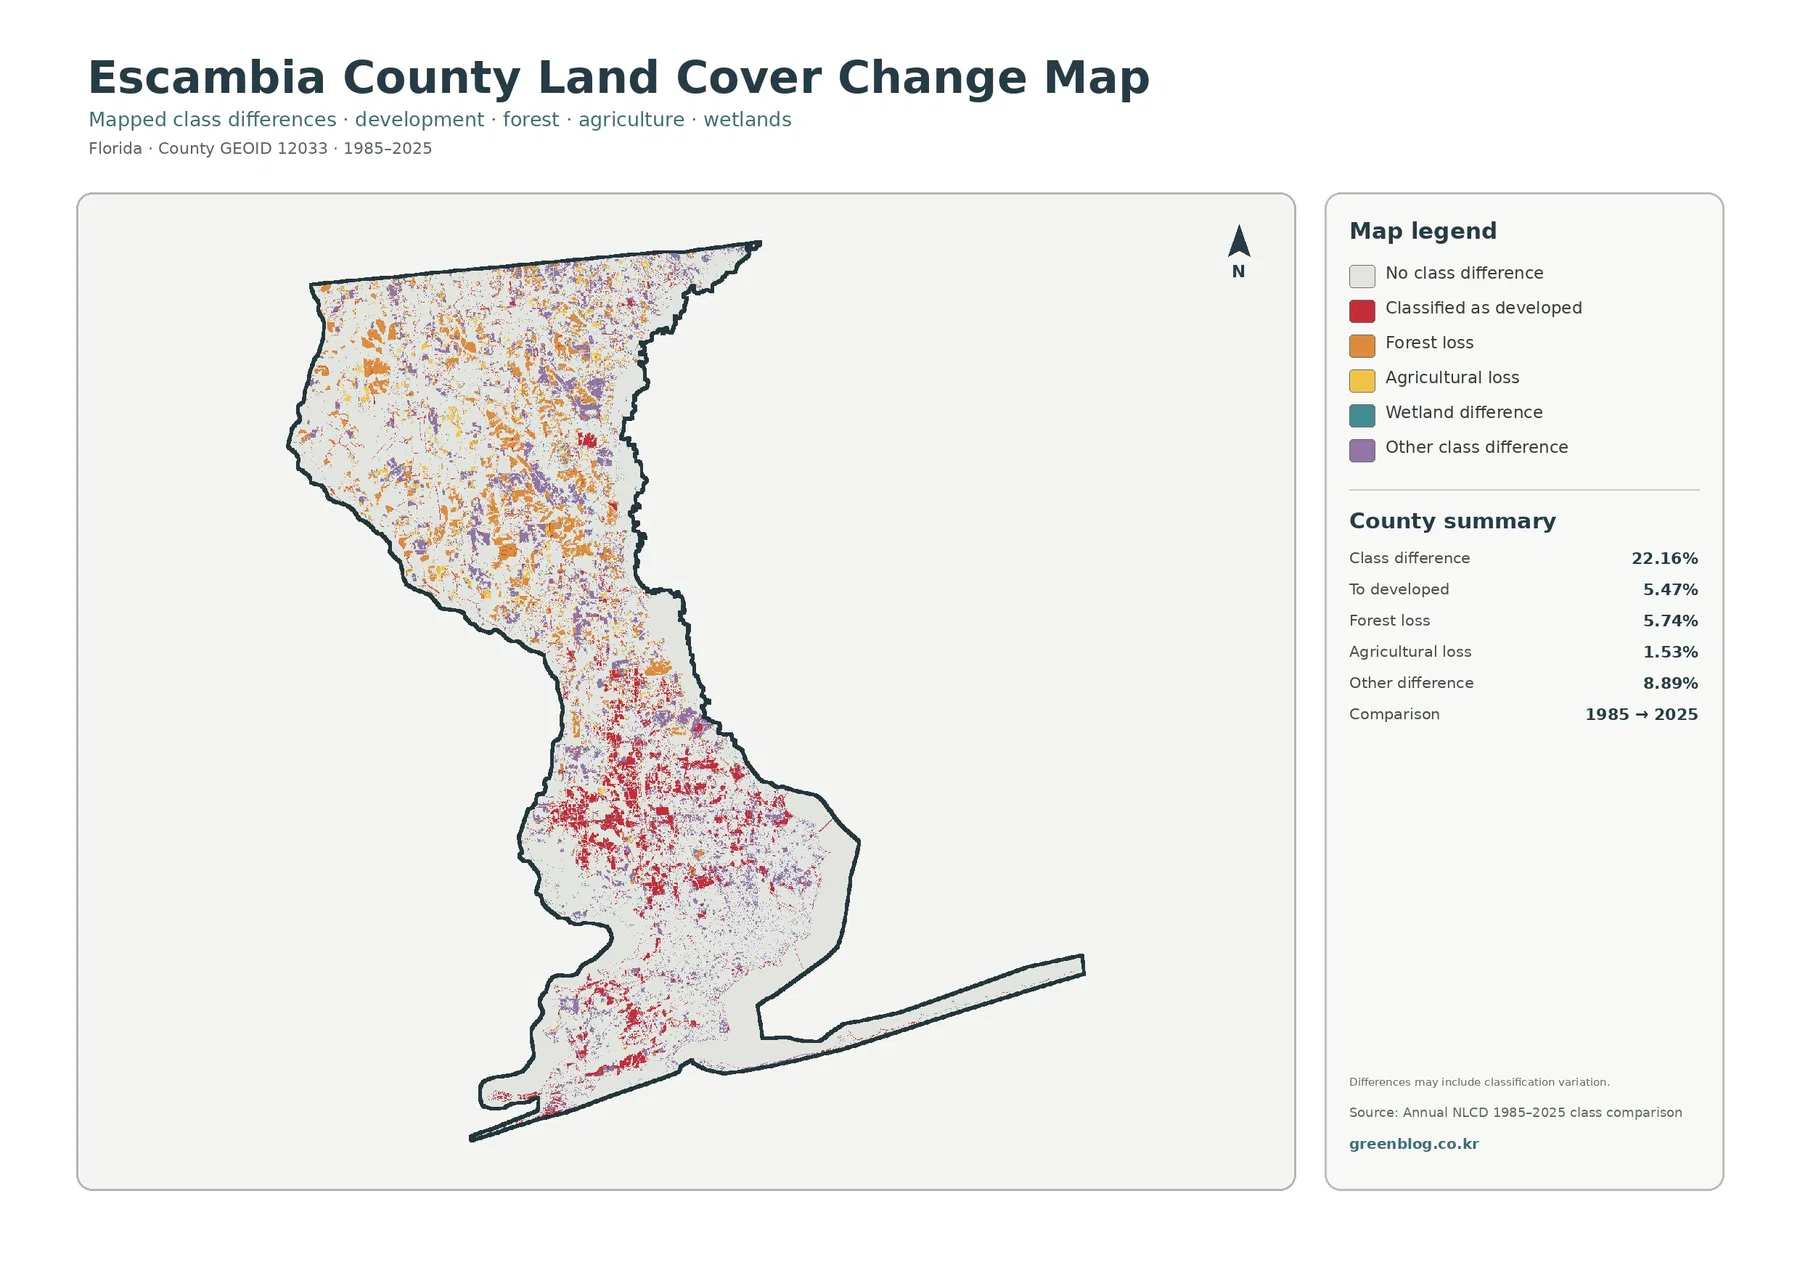
The comparison map reports a 22.16% overall class difference between 1985 and 2025. That number should not be described as the percentage of Escambia County that was physically transformed. The map itself warns that classification variation may be included. Differences in imagery, classification methods, mixed pixels, and the way boundaries are assigned can change a cell’s class even when the ground change is more subtle.
The to-developed category is 5.47%. Red change cells are concentrated most strongly in and around the southern developed area, with smaller occurrences farther north. This statistic is not the same as saying developed land increased by exactly 5.47 percentage points. The 23.66% developed-cover figure describes the 2025 condition, while 5.47% identifies cells that are classified as developed in the comparison category.
Forest loss is 5.74%, a share slightly larger than the to-developed category. Orange cells are spread through many northern and central locations rather than forming one single block. Their cause cannot be assigned from this map alone. Some locations may reflect conversion to another cover class, management or clearing, while others may be affected by classification differences. A cause-and-timing question needs intermediate-year Annual NLCD layers, aerial imagery, or local land records.
Agricultural loss is 1.53%, and other class difference is 8.89%. Wetland difference has its own legend color but no separate percentage in the supplied summary, so a precise wetland-change figure should not be estimated from the image. The safest use of the map is to identify places where the two endpoint classifications disagree and then examine those areas with more detailed time-series information.
Reading the change layer after the current maps helps avoid a common mistake. A red change cell can be checked against the 2025 land-cover map, while an orange forest-loss cell can be compared with the current forest-and-farmland view. This turns the change map into a guide for follow-up questions instead of treating every colored cell as a fully documented historical event.
How to use the four maps for county comparisons without mixing the statistics
For a quick Escambia County profile, start with the five large 2025 shares: forest 25.92%, developed 23.66%, wetlands 20.26%, water 11.44%, and agriculture 11.09%. Those figures describe the current classification. Mean imperviousness at 7.63% and the 4.93% share above 50% imperviousness describe hard-surface intensity, not land-cover area. The 22.16% class-difference figure belongs to a separate two-date comparison.
A classroom exercise can ask students to explain why developed cover is much higher than mean imperviousness. Another activity can compare the northern forest-and-farm pattern with the southern urban-and-water pattern. Because both examples use visible features from the supplied maps, they encourage map reading rather than memorization of percentages.
For a county-to-county comparison, keep the source year and classification system consistent. Two Florida counties can have similar developed shares but very different imperviousness, wetland cover, or water area. Likewise, a county with more forest may have that forest in one large block or in many smaller patches. The map pattern and the percentages should be considered together.
When the purpose is printing or a presentation, one large map is usually easier to read than four tiny maps on the same page. Use the general view as the anchor, then add the specialized layer that answers the next question. The forest-and-farmland layer works well for rural land patterns, while the impervious layer is better for development intensity and the change layer for locating endpoint differences.
Scale, classification, and date limits to remember before zooming in
Annual NLCD is designed for broad land-cover analysis rather than parcel-level decisions. Real landscapes contain narrow roads, tree strips, lawns, buildings, drainage features, fields, and wetland edges that can occur within a small area. A raster classification simplifies those mixtures into mapped classes. Boundary areas are therefore especially likely to look cleaner on the map than they do on the ground.
Enlarging the JPG makes the legend and small patches easier to see, but it does not create finer source detail. Individual property lines, small streams, building footprints, narrow wetland boundaries, and farm boundaries can be generalized. Survey, parcel, zoning, wetland, flood, or engineering questions should use the current datasets designed for those purposes.
The 2025 map is a snapshot for that classification year. Clearing, construction, regrowth, restoration, or flooding after the source period may not appear. The 1985–2025 map is also an endpoint comparison rather than a record of every event over forty years. A site that changed more than once can only show the relationship between the two selected classifications in this layer.
Download the four original JPG map files
The ZIP contains the four original JPG maps used for this article: the 2025 general land-cover map, the forest-and-farmland map, the impervious/developed-land map, and the 1985–2025 land-cover change map. Each file emphasizes a different question, so choosing the map that matches the topic usually produces a clearer printout or slide than shrinking all four into one small layout.
Use the general map for the countywide pattern, the forest-and-farmland view for the northern green and agricultural landscape, the impervious layer for the southern hard-surface concentration, and the change map for identifying places where the two endpoint classifications differ. The JPG files can be enlarged for easier reading of labels and legend categories, subject to the source-resolution limits described above.
Frequently Asked Questions
What is the largest 2025 land-cover class in Escambia County?
Forest is the largest class at 25.92%. Developed land follows at 23.66%, wetlands at 20.26%, water at 11.44%, agriculture at 11.09%, grassland at 3.44%, and shrubland at 2.73%. Forest is most visually important in the north, while developed land is strongly concentrated in the south.
Why does Escambia County have 23.66% developed cover but only 7.63% mean imperviousness?
Developed land can contain both hard and permeable surfaces, including pavement, rooftops, lawns, trees, and open ground. Imperviousness measures the hard-surface portion. The countywide mean is 7.63%, while 4.93% of the mapped area is at least 50% impervious, showing that the most hardened surfaces are concentrated within a larger developed footprint.
Does the 22.16% class difference mean that 22.16% of the county physically changed between 1985 and 2025?
No. It means 22.16% of mapped cells have different endpoint classifications, and the map warns that classification variation may be included. The supplied categories report 5.47% to developed, 5.74% forest loss, 1.53% agricultural loss, and 8.89% other difference. Determining the exact cause and date of change requires additional annual layers or local records.
Map File Information
The four original JPG land-cover maps for Escambia County, Florida are included together in one ZIP file.
- Included Files: Use only the versions confirmed in the article and supplied images
- File Type: Use the confirmed download contents
- Intended Use: Printing, education, presentations, and map-based projects
Related Maps
- Alachua County Florida Land Cover Map
- Baker County Florida Land Cover Map
- Bay County Florida Land Cover Map
Sources and References
- MRLC Annual NLCD Data – source data for the 2025 land-cover and 1985–2025 comparison layers
- USGS Annual NLCD Land Cover Classification – definitions for forest, developed land, wetlands, agriculture, water, and related classes
- Escambia County Jones Swamp Wetland Preserve – local wetland and water-quality context for the Jones Creek and Pensacola Bay area
- Escambia County Perdido Key Habitat Conservation Plan – official coastal habitat and development context for Perdido Key
- Escambia County Bayou Chico Restoration – official local context for the south-central Pensacola Bay watershed and Bayou Chico
- UF/IFAS Extension Escambia County Agriculture & Small Farms – county-specific agriculture and small-farm information
Green Map creates custom-edited map images using open geographic data sources such as geoBoundaries, Natural Earth, OpenStreetMap, and government open data.
These maps are edited visual materials, not raw data files, and are provided for education, documents, presentations, and graphic reference.