Alachua County’s 2025 land-cover pattern is unusually varied for a single county. Forest is the largest class at 33.66%, followed by agriculture at 24.13%, wetlands at 17.23%, developed land at 13.78%, and water at 4.24%. The central Gainesville area forms the largest developed concentration, broad agricultural cover occupies much of the west, and the eastern and southeastern parts of the county contain extensive forest, wetlands, and lakes. The result is a map where urban, rural, and water-rich landscapes sit close together rather than forming one uniform surface.
This page provides four views of the same county: 2025 land cover, forest and farmland, impervious/developed land, and a 1985–2025 land-cover change map. The WebP images are designed for quick comparison on the page, while the four original JPG maps are available together in one ZIP download. Land cover describes what physically covers the ground. It does not establish zoning, parcel ownership, development rights, conservation status, or a legal wetland boundary.
Table of Contents
Gainesville sits between a farm-rich west and a wetter, more forested east
The county’s broad pattern becomes clear when the central developed area is used as a reference point. Gainesville appears as a large red concentration, with smaller developed clusters elsewhere. To the west, yellow agricultural cover becomes much more continuous. East and southeast of Gainesville, dark green forest, teal wetlands, and blue water occupy a larger share of the map. This east–west contrast is more useful than treating Alachua County as simply an urban county or a rural county, because both conditions are prominent within the same boundary.
Alachua County’s Environmental Protection Department identifies Newnans Lake, Orange Lake, Lake Wauberg, Paynes Prairie, and several creeks within its water-resource work. That official geography helps explain the large water and wetland shapes visible on the eastern and southern parts of the supplied maps. The map itself is not a regulatory hydrology layer, however. Wetland-colored cells and open-water classes are generalized land-cover categories, so permitting or property decisions require the appropriate county, state, or federal dataset.
The county’s Alachua County Forever program also provides useful local context. It protects environmentally and agriculturally significant lands and manages a network of nature preserves. That mission fits a county where forest, agriculture, and wetlands together account for most of the mapped surface. The program boundary should not be confused with the NLCD colors. A forest pixel may be privately owned, and agricultural cover does not mean that a parcel is enrolled in a farmland-protection program.
Forest leads the 2025 county summary at 33.66%
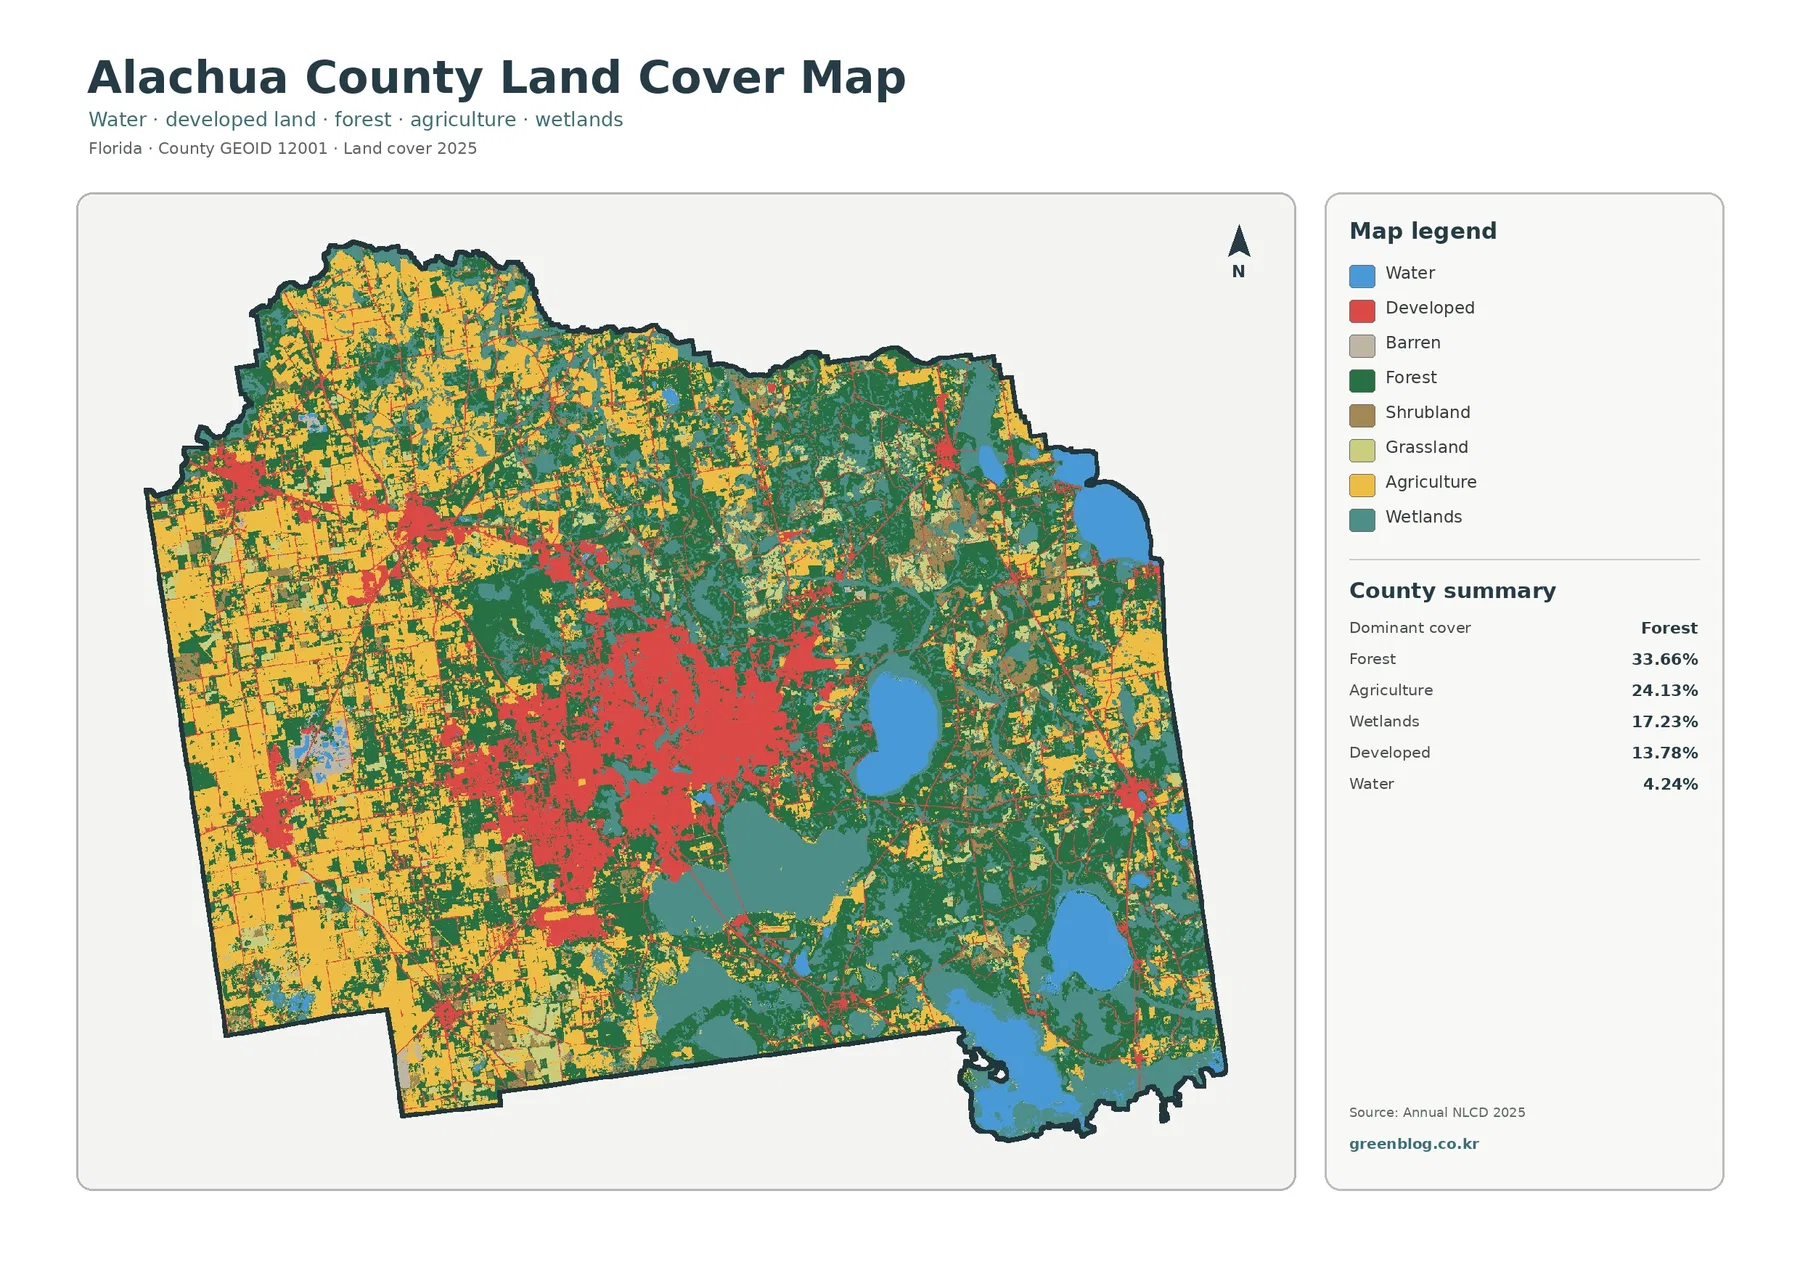
Forest is the largest single class at 33.66%. It forms broad areas east and southeast of Gainesville and remains common around the central developed zone and across the northern part of the county. The pattern is not one uninterrupted forest block. Instead, woodland appears in large and small pieces between farms, wetlands, lakes, and built-up areas. That arrangement is important for readers interested in habitat or conservation because it shows how natural cover remains interwoven with developed and agricultural land.
Agriculture accounts for 24.13% and is the second-largest class. Its strongest concentration is on the western side, where yellow cover forms broad connected areas and continues through parts of the northwest and southwest. County planning and conservation material treats agriculturally significant land as an important local resource, which supports the interpretation that farming is a major part of the landscape. The 24.13% value is still a land-cover estimate, not a count of farms, harvested acres, agricultural revenue, or land protected for farming.
Wetlands at 17.23% are a major part of the county rather than a narrow fringe. They are especially prominent in the east and southeast, where they surround or connect with large water bodies, but smaller wetland patterns also occur through other parts of the county. Water covers 4.24%, reflecting the county’s many lakes. Because the supplied map does not label individual lakes, the official county water-resource pages are a better source when a project needs precise names and watershed boundaries.
The forest-and-farmland view makes the west–east contrast easier to see
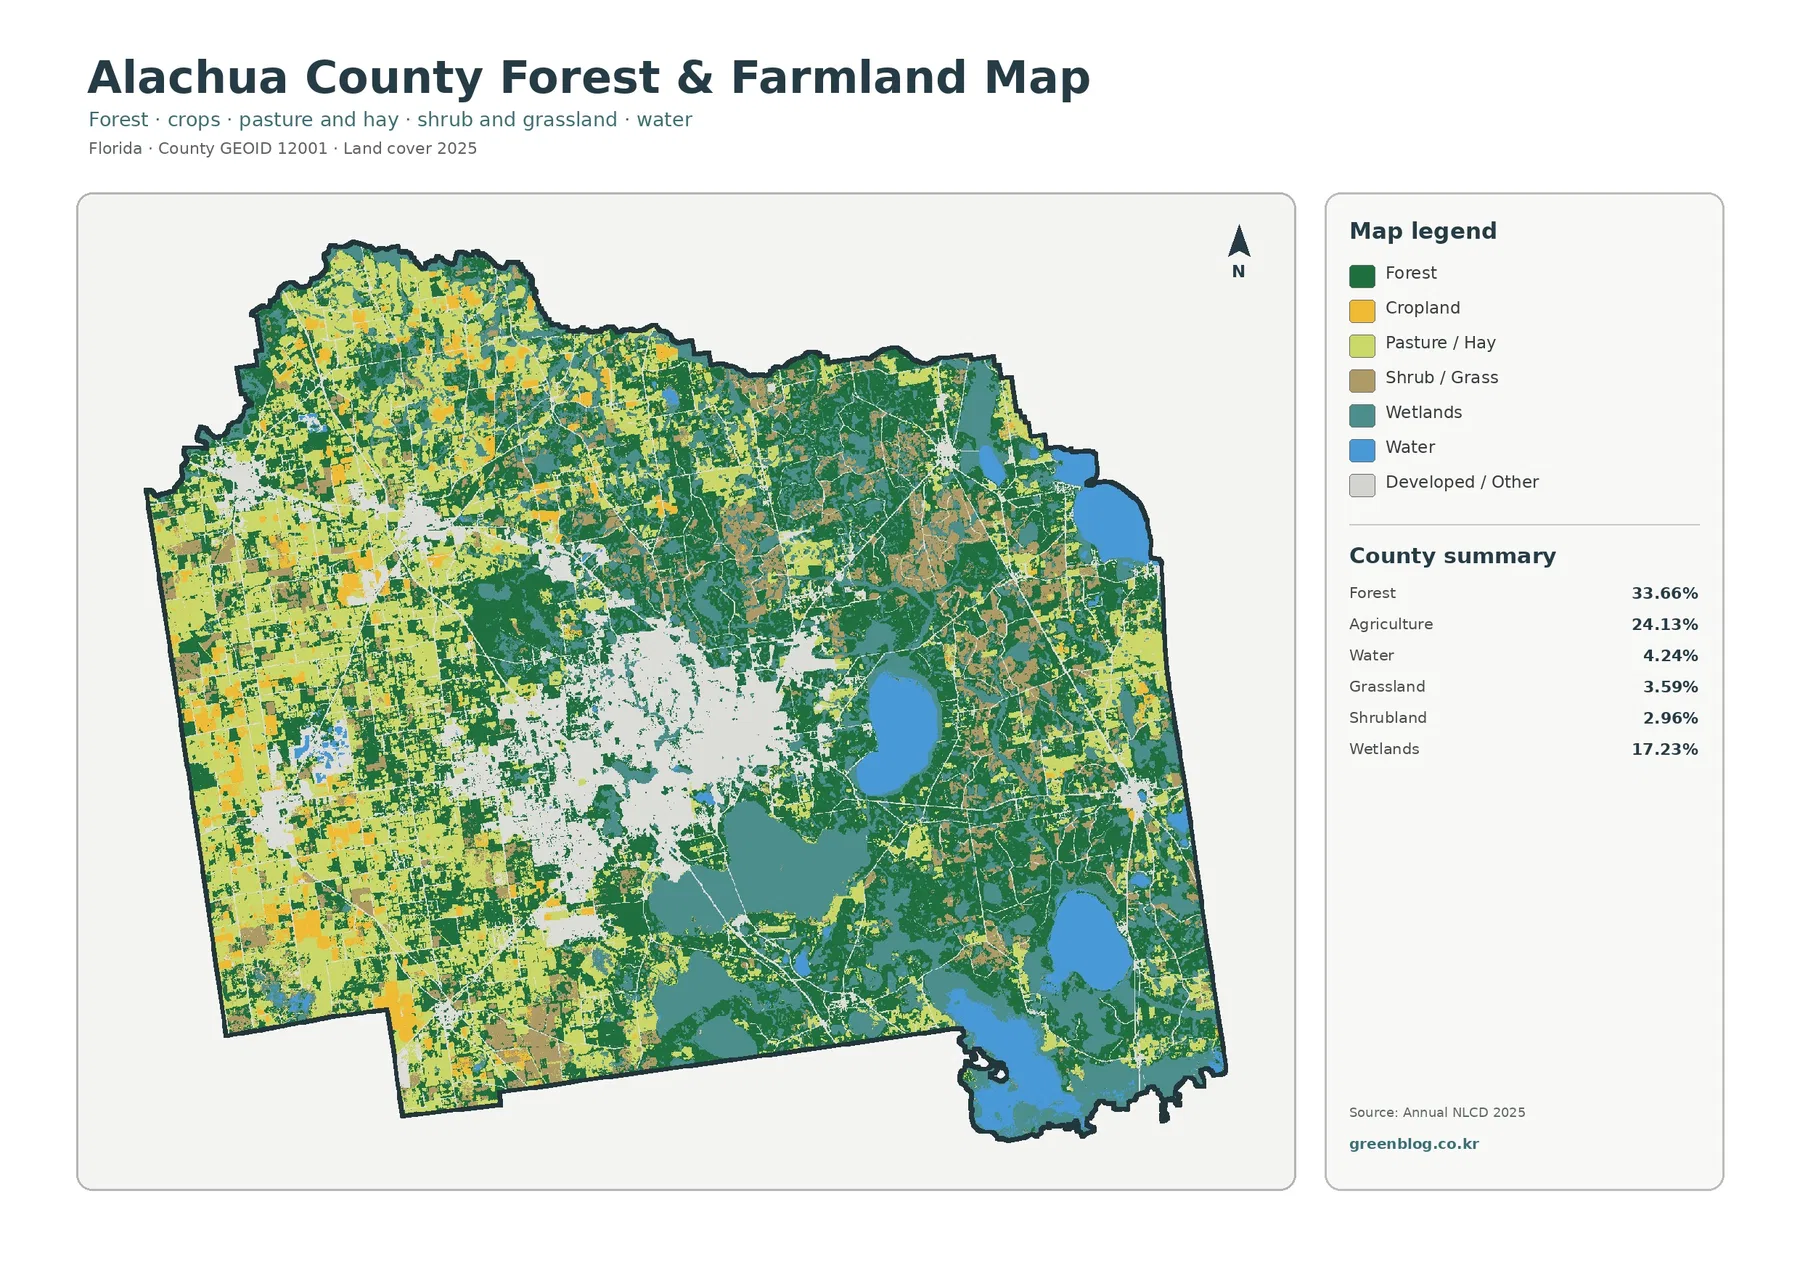
Removing most developed detail from the foreground gives the second map a different purpose. Forest at 33.66% and agriculture at 24.13% become the main visual competitors, while wetlands and water remain easy to trace. The summary also reports grassland at 3.59% and shrubland at 2.96%. Western Alachua County is dominated by agricultural colors, while the east contains more extensive forest and wetland cover. This is the clearest map for discussing the county’s rural landscape without letting the Gainesville urban area dominate the page.
The pale developed/other area around Gainesville also reveals how abruptly land cover changes outside the urban core. Forest and farmland begin close to the built-up area, and wetlands become more common toward the east. That proximity matters when using the map for watershed lessons, environmental education, or regional planning graphics because it demonstrates that city growth, farms, forest, and wetlands are not isolated systems. The map shows their location together, but it does not prove that one class caused changes in another.
Alachua County’s Conservation Element specifically addresses wetlands, surface waters, floodplains, groundwater resources, and conservation lands. A land-cover map is useful as an initial visual screen for those topics, especially when broad forest and wetland areas need to be located quickly. It cannot replace the official layers used for environmental review. A dark-green forest cell says nothing by itself about ownership or protection status, and a teal wetland cell should not be treated as a surveyed wetland line.
Developed land is 13.78%, but mean impervious cover is only 3.90%
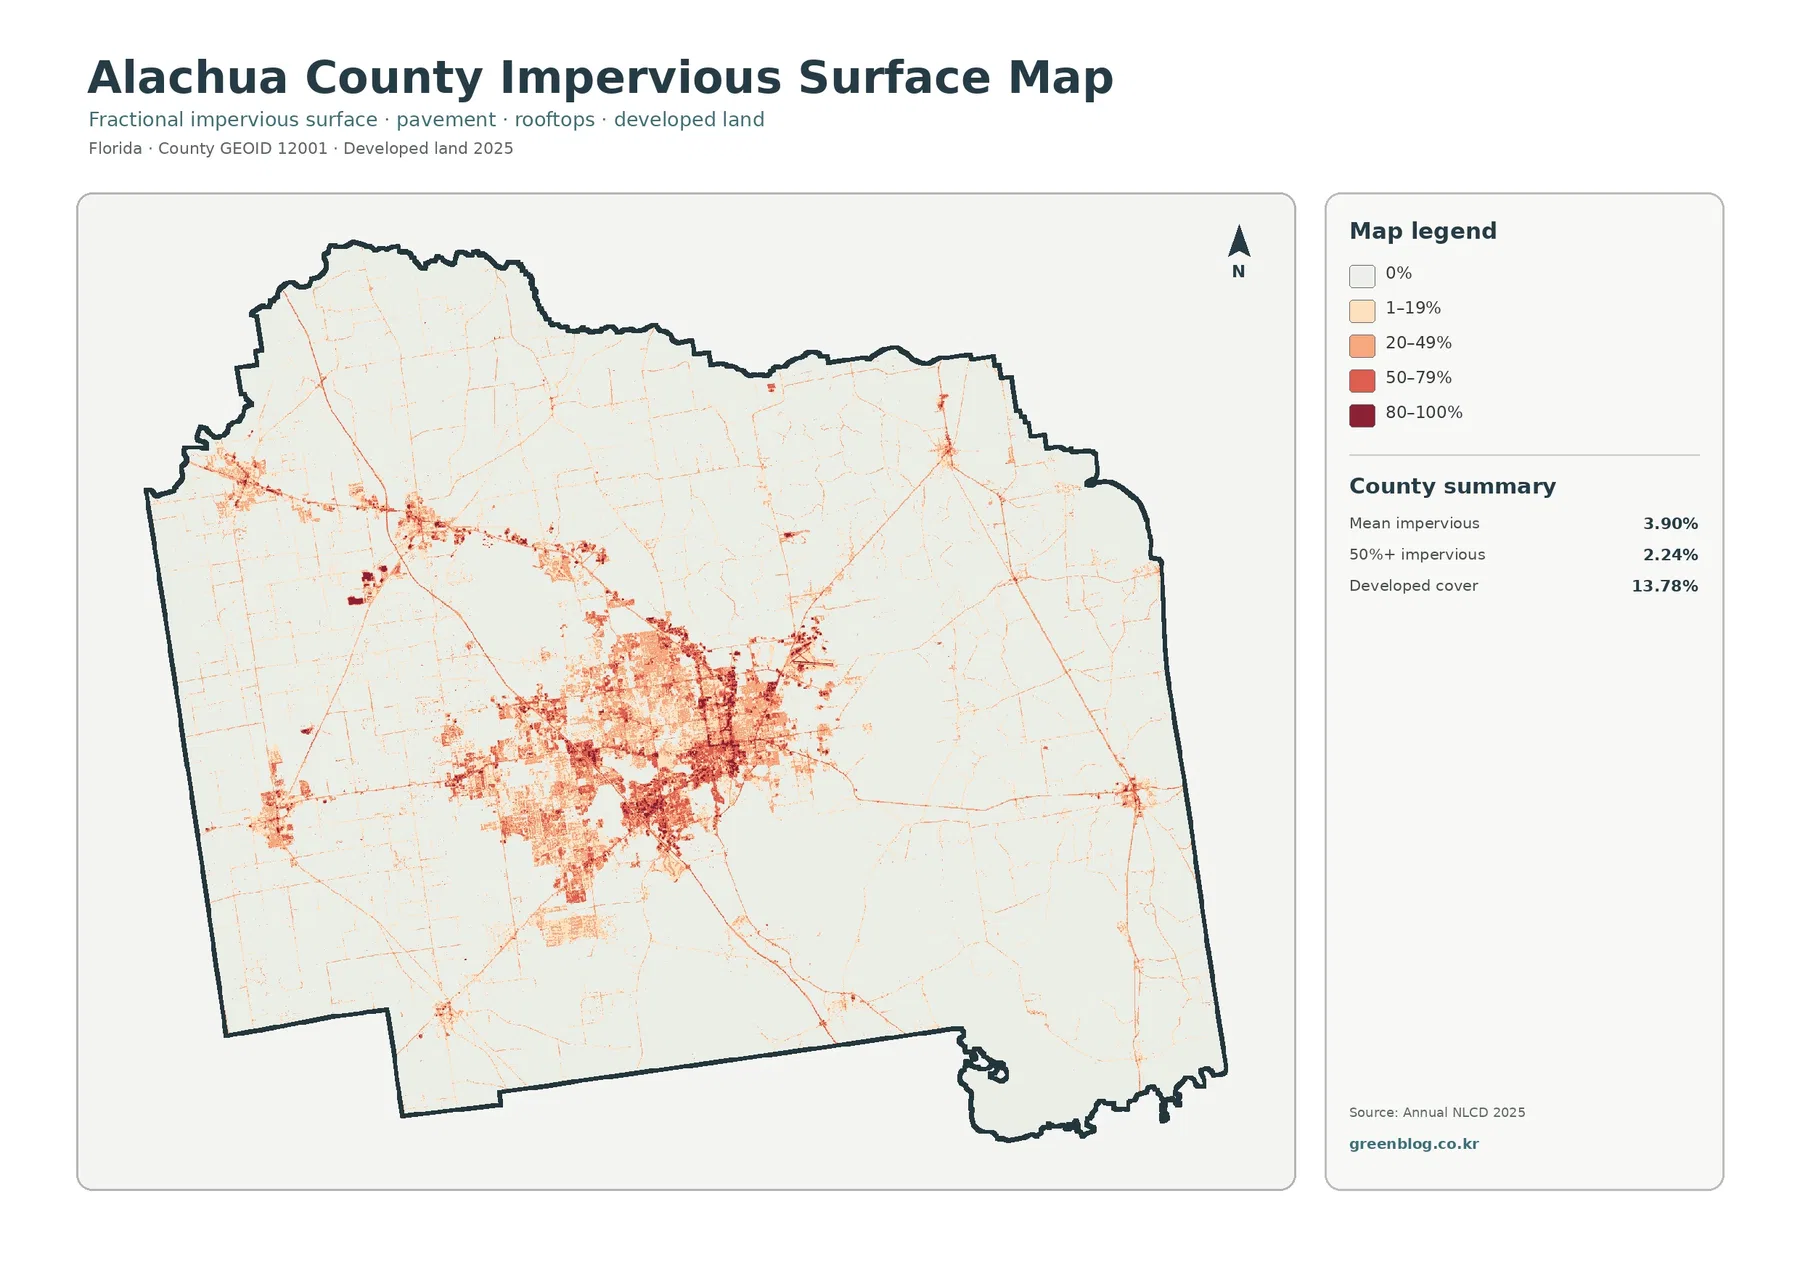
Impervious surface means hard cover such as pavement, parking lots, and rooftops where water does not readily soak into the ground. Alachua County’s mean impervious cover is 3.90%, and 2.24% of the county falls in cells with at least 50% impervious cover. Those figures are much lower than the 13.78% developed-land share because developed land can also contain lawns, trees, bare soil, and other surfaces that still absorb water. The two measurements describe related but different aspects of urbanization.
The strongest impervious concentration forms around Gainesville, where darker red tones create a large central cluster. Smaller concentrations occur elsewhere, and thin linear features connect some developed areas. Those lines likely correspond to transportation and settlement corridors, but the image does not label roads, so individual routes should not be named from this map alone. A municipal or road-level statistic would also require the original impervious raster clipped to the correct boundary rather than a visual estimate from the county image.
Alachua County and the City of Gainesville cooperate on urban stormwater and creek programs, making the impervious map useful as a background layer for water-quality discussions. More pavement and rooftops can change how quickly rainfall reaches drainage systems, but this image cannot calculate flood risk or pollutant loading. Those questions also depend on rainfall, drainage infrastructure, soils, topography, and watershed boundaries. The map is best used to identify areas that deserve a closer look with those additional datasets.
The 1985–2025 map reports a 27.06% class difference, not a 27.06% development rate
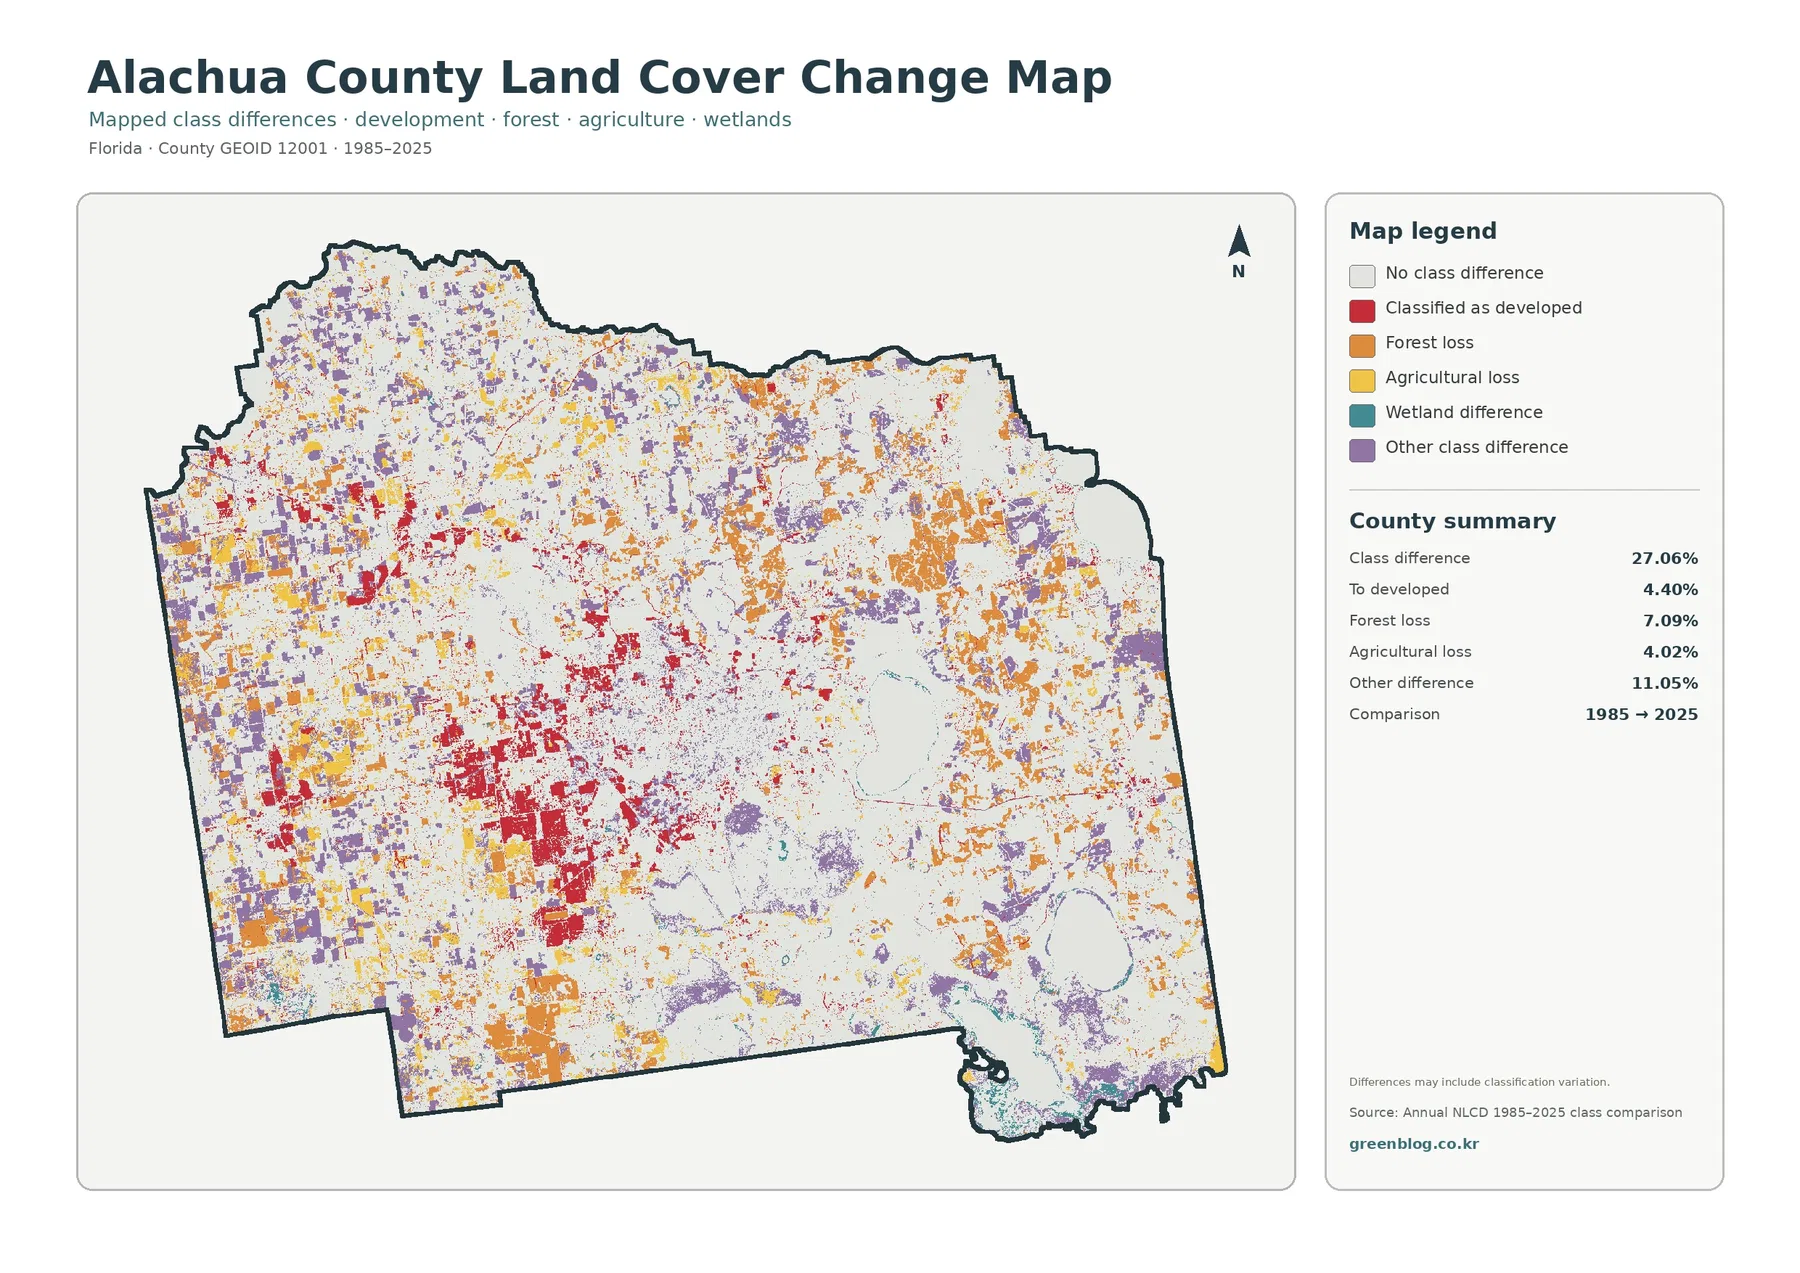
The change map reports that 27.06% of mapped cells have a different land-cover class in 2025 than in 1985. The summary separates several categories: 7.09% forest loss, 4.40% changed to a class mapped as developed in 2025, 4.02% agricultural loss, and 11.05% other class differences. Red developed-change cells are particularly visible around Gainesville and several smaller western locations, while orange forest-loss cells are scattered broadly across the county. The west also contains many mixed change colors within agricultural areas.
The 27.06% figure must not be read as “27.06% of the county was developed.” It is the total share of cells whose class differs between the two dates. Some differences can reflect real landscape change, while others can be affected by classification methods, imagery, mixed pixels, or small boundary shifts. Even the 4.40% developed-change category should be treated as a mapped comparison rather than a permit or construction record. A development history needs aerial photography, planning records, or parcel-level information.
Forest loss at 7.09% and agricultural loss at 4.02% deserve the same caution. Those categories indicate that a cell was forest or agriculture in the earlier classification and something else in 2025. The map does not say exactly when the change occurred or why. Development, forestry, agricultural rotation, hydrologic change, restoration, and classification variation can produce different outcomes. The practical value of this layer is locating clusters for follow-up rather than assigning a cause from color alone.
Lakes, wetlands, and conservation lands add important context east of Gainesville
The county’s official creeks-and-lakes material includes Newnans Lake, Orange Lake, Lake Wauberg, Paynes Prairie, and associated watersheds. Those references help explain why the eastern and southeastern map is so different from the farm-rich west. Blue water, teal wetlands, and dark-green forest form large connected areas, while the central Gainesville developed zone creates a distinct break between those natural surfaces and western agriculture.
Newnans Lake is a useful example of why local sources matter. Alachua County describes the lake and its watershed in detail and notes extensive forest and wetland cover within that watershed. The county also manages or partners in conservation lands around several natural areas. These facts provide geographic context for the map, but they do not change the countywide NLCD percentages. A watershed value, preserve acreage, and county land-cover share are separate measurements and should stay labeled as such.
The same caution applies around Paynes Prairie and other wet areas. The raster classification can indicate where wetlands are broadly concentrated, but a legal or ecological assessment needs more precise sources. For classroom use, the map works well for comparing where forest, wetlands, water, farms, and development meet. For environmental review, it should serve as a starting layer followed by official wetland, floodplain, conservation, and parcel information.
Choose the map according to the question, then keep the legend visible
The general land-cover map is the strongest first image for a county profile because it keeps the five major percentages and the full class pattern together. The forest-and-farmland map is better when the topic is agriculture, conservation, or habitat because built-up areas recede visually. The impervious map is the clearest choice for development intensity and stormwater context. The change map should usually come last, after the reader understands the 2025 pattern, so the 1985–2025 colors have a clear reference point.
The supplied asset manifest records each original JPG at 2480 by 1754 pixels. The package does not mark these files as meeting its A3 high-resolution reference, so very large printing should be tested before final use. For reports and presentations, preserve the original aspect ratio and keep the legend and County summary visible. Cropping those elements can remove the exact percentages and definitions needed to interpret the image correctly.
Thirty-meter cells and countywide percentages set the scale of interpretation
Annual NLCD is designed for consistent regional and national land-cover comparison and is commonly delivered on a Landsat-based 30-meter grid. A single raster cell may contain a road edge, trees, a yard, part of a field, and wet ground at the same time. The land-cover product assigns a class to that cell, while the impervious product estimates hard-surface percentage. Enlarging the map cannot create parcel-level detail that was absent from the original data.
The dates attached to the maps also matter. The land-cover, forest-and-farmland, and impervious views describe 2025, while the change layer compares 1985 with 2025. Construction, farm conversion, forest management, wetland restoration, or other changes after the 2025 observation period may not appear. Projects that need current conditions should pair these maps with newer aerial imagery and county or state records.
Finally, every percentage shown here is countywide. The supplied maps do not provide separate statistics for Gainesville, Newberry, Alachua, High Springs, individual watersheds, or neighborhoods. A dark impervious cluster in Gainesville therefore does not have a 3.90% value simply because that is the county mean. Smaller-area statistics require a new calculation using the correct boundary and the original raster data.
Frequently Asked Questions
What is the largest land-cover class in Alachua County in 2025?
Forest is the largest class at 33.66%. Agriculture follows at 24.13%, wetlands at 17.23%, developed land at 13.78%, and water at 4.24%.
Why is developed land 13.78% while mean impervious cover is only 3.90%?
Developed classes can include lawns, trees, soil, and other surfaces that still absorb water. Impervious cover measures hard surfaces such as pavement and rooftops separately, so the countywide mean is lower.
Does the 27.06% 1985–2025 class difference mean 27.06% of Alachua County was developed?
No. It is the share of mapped cells with a different land-cover class between the two dates. The map identifies 4.40% as changes classified as developed in 2025, and some differences may include classification variation.
Sources and reference material
- MRLC Annual NLCD Data – land-cover and impervious-source data
- USGS Annual NLCD Land Cover Classification – class definitions and interpretation
- U.S. Census Bureau TIGER/Line Shapefiles – county boundary reference
- Alachua County Forever – local land-conservation and natural-resource context
- Alachua County Creeks and Lakes – official lake, creek, and watershed context
- Alachua County Conservation Element – wetlands, surface waters, floodplains, and conservation planning context
Map File Information
Download the four original JPG maps in one ZIP: 2025 land cover, forest and farmland, impervious/developed land, and the 1985–2025 land-cover change map.
- Included Files: 4 JPG maps
Related Maps
Green Map creates custom-edited map images using open geographic data sources such as geoBoundaries, Natural Earth, OpenStreetMap, and government open data.
These maps are edited visual materials, not raw data files, and are provided for education, documents, presentations, and graphic reference.