Sussex County has a strongly mixed 2025 land-cover pattern rather than a single dominant landscape. Agriculture is the largest class at 37.81%, followed by wetlands at 22.81%, developed land at 19.19%, forest at 13.71%, and water at 4.79%. Farmland spreads broadly through the interior and western side, while the eastern part of the county contains much larger wetland and water areas. Developed cover also becomes more concentrated in several eastern clusters, creating a sharp contrast between the county’s agricultural interior and its coastal side.
Four map views cover 2025 land cover, forest and farmland, impervious/developed land, and land-cover change from 1985 to 2025. The WebP images are optimized for on-page viewing, and four JPG maps are available together in one ZIP download. Land cover describes what is physically covering the ground, such as crops, forest, wetlands, water, or developed surfaces. It is not a zoning map, parcel-ownership record, or legal wetland delineation.
Table of Contents
A county split between broad farmland and a water-rich eastern edge
Sussex County’s main internal contrast separates broad agricultural areas from the water-rich eastern side. Yellow agricultural cover occupies much of the west, center, and south, but the pattern changes as the map approaches the coast and the Inland Bays. Teal wetlands and blue water expand across the eastern side, while red developed areas form larger and more frequent clusters there. Forest remains important, yet it appears mainly as irregular blocks woven among farms, wetlands, and settlement rather than as one continuous countywide belt.
Delaware DNREC identifies the Inland Bays and Atlantic Ocean Basin in southeastern Sussex County and lists Rehoboth Bay, Indian River Bay, Little Assawoman Bay, and their tributary watersheds within that basin. That official geography helps explain why water and wetlands occupy such a complicated shape on the eastern side of these maps. The land-cover classes are still descriptive rather than regulatory. A wetland-colored cell does not replace a jurisdictional wetland boundary, and the map does not define water-quality buffers or construction setbacks.
Sussex County’s comprehensive planning material also treats farmland, forest, wetlands, surface waters, and floodplains as major resource concerns. That context aligns with a mapped pattern in which agriculture and wetlands are among the county’s largest surface classes. Planning policy and land-cover classification, however, answer different questions. A field shown as agriculture is not automatically enrolled in a preservation program, and a forest pixel does not identify ownership, management status, or conservation priority.
What the 2025 land-cover map says at county scale
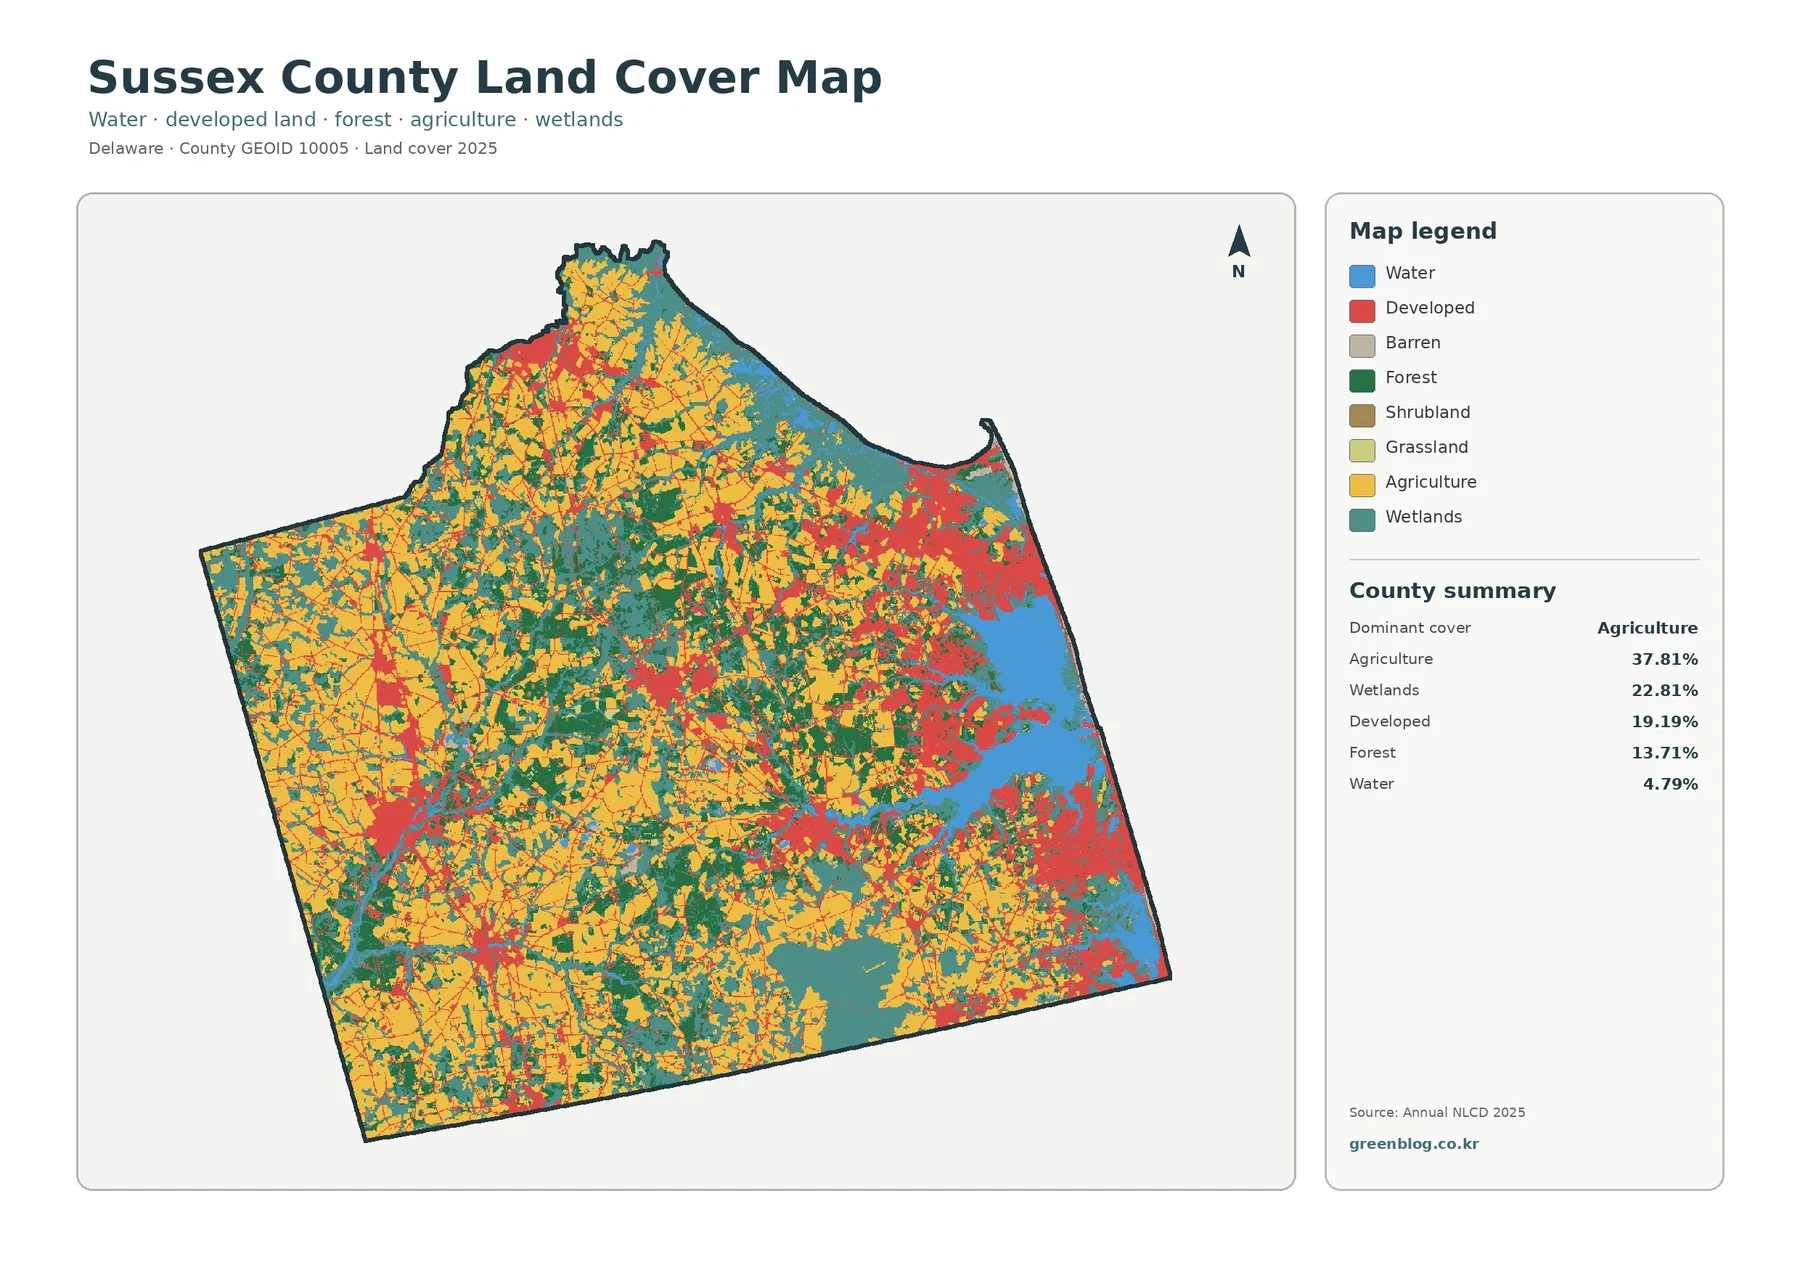
Agriculture at 37.81% is the clearest countywide signal. It forms broad, connected areas through the western and central portions of the map and remains prominent farther south. The Delaware Department of Agriculture’s statewide statistics also identify Sussex as the Delaware county with the largest number of farms in the 2022 Census of Agriculture summary. That outside context supports the interpretation that farming is a major part of the county’s present-day landscape, while the 37.81% value remains the map’s own countywide figure.
Wetlands make up 22.81%, a remarkably large second-place class. They occupy broad eastern areas near the bays and coast, then continue inland as narrower bands and patches associated with low ground and drainage features. DNREC reports that roughly half of Delaware’s wetlands are located in Sussex County and describes several distinctive wetland communities around the Inland Bays. Those statements explain the regional importance of the teal areas without turning the map into a regulatory wetland inventory.
Developed land accounts for 19.19%. Red cover is especially noticeable on the eastern side, with additional clusters in the northwest, center, and south. The developed category is broader than pavement and rooftops. It may include lawns, trees, soil, and other pervious surfaces inside built-up settings. That distinction matters because the impervious map reports a countywide mean of only 6.27%, far below the 19.19% developed share.
Separating working farmland, forest, wetlands, and open water
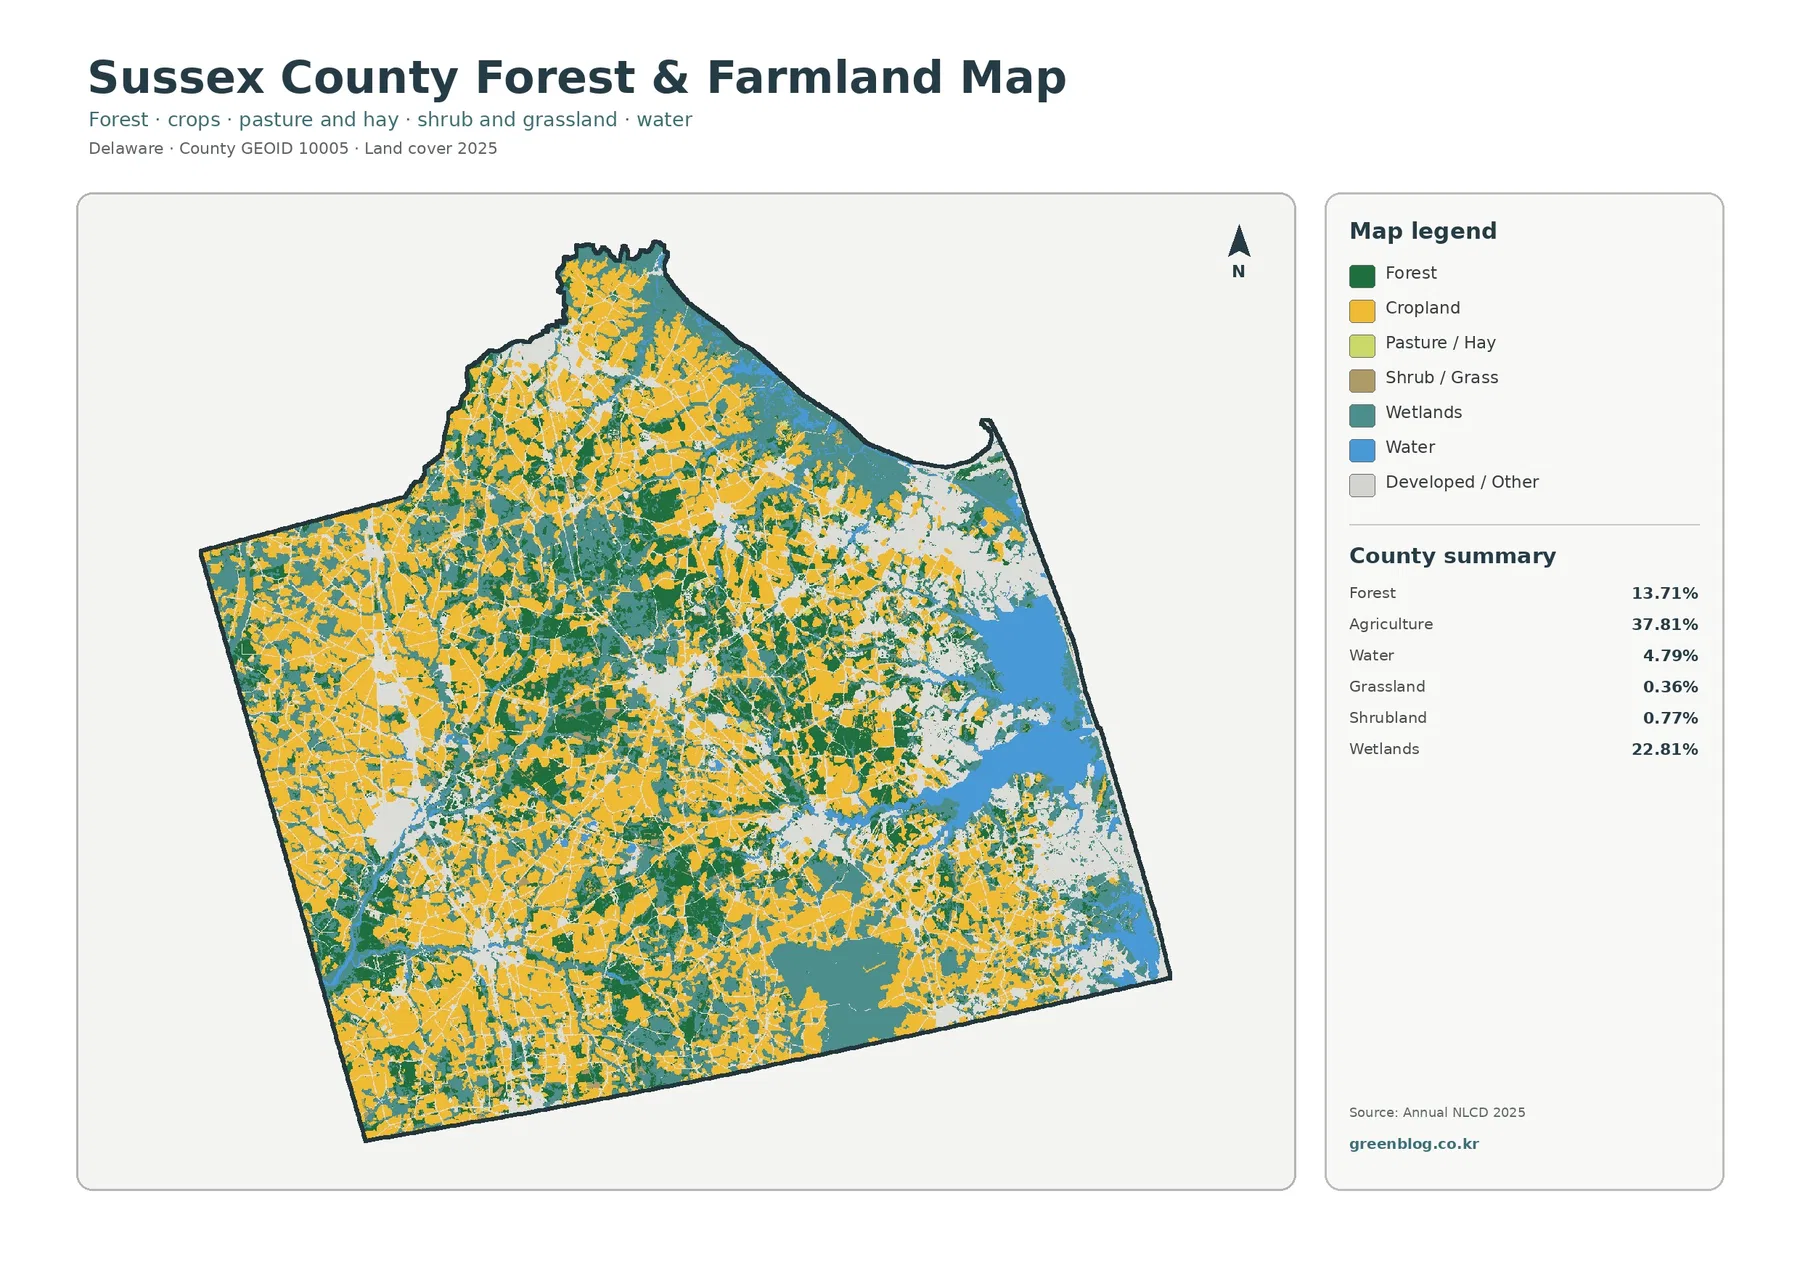
The forest-and-farmland map removes much of the visual competition from developed and miscellaneous classes, making the rural and natural pattern easier to follow. Agriculture remains 37.81%, forest is 13.71%, wetlands are 22.81%, and water is 4.79%. The summary also lists shrubland at 0.77% and grassland at 0.36%. Those smaller classes are real parts of the legend, but they have less influence on the countywide appearance than farmland and wetlands.
Across the western half, cropland repeatedly fills the spaces between forest blocks and narrow wetland corridors. Moving east, the teal wetland class becomes much more extensive and open water takes a larger visual role. That shift is one reason a simplified rural-cover map is useful here: it reveals that the coast is not simply a developed strip beside the ocean. Large wetland systems and inland waters occupy substantial areas behind and between developed places.
Forest at 13.71% appears as many irregular blocks rather than one unbroken tract. Some patches sit between agricultural areas; others border wetlands or lie within more mixed landscapes. The map cannot indicate which tracts are publicly owned, actively managed, protected, or particularly valuable for habitat. Forest management, conservation status, and parcel ownership come from separate datasets. Forest is best read as a significant but fragmented part of a county landscape otherwise dominated by agriculture and wetlands.
Where hard surfaces are concentrated inside the developed class
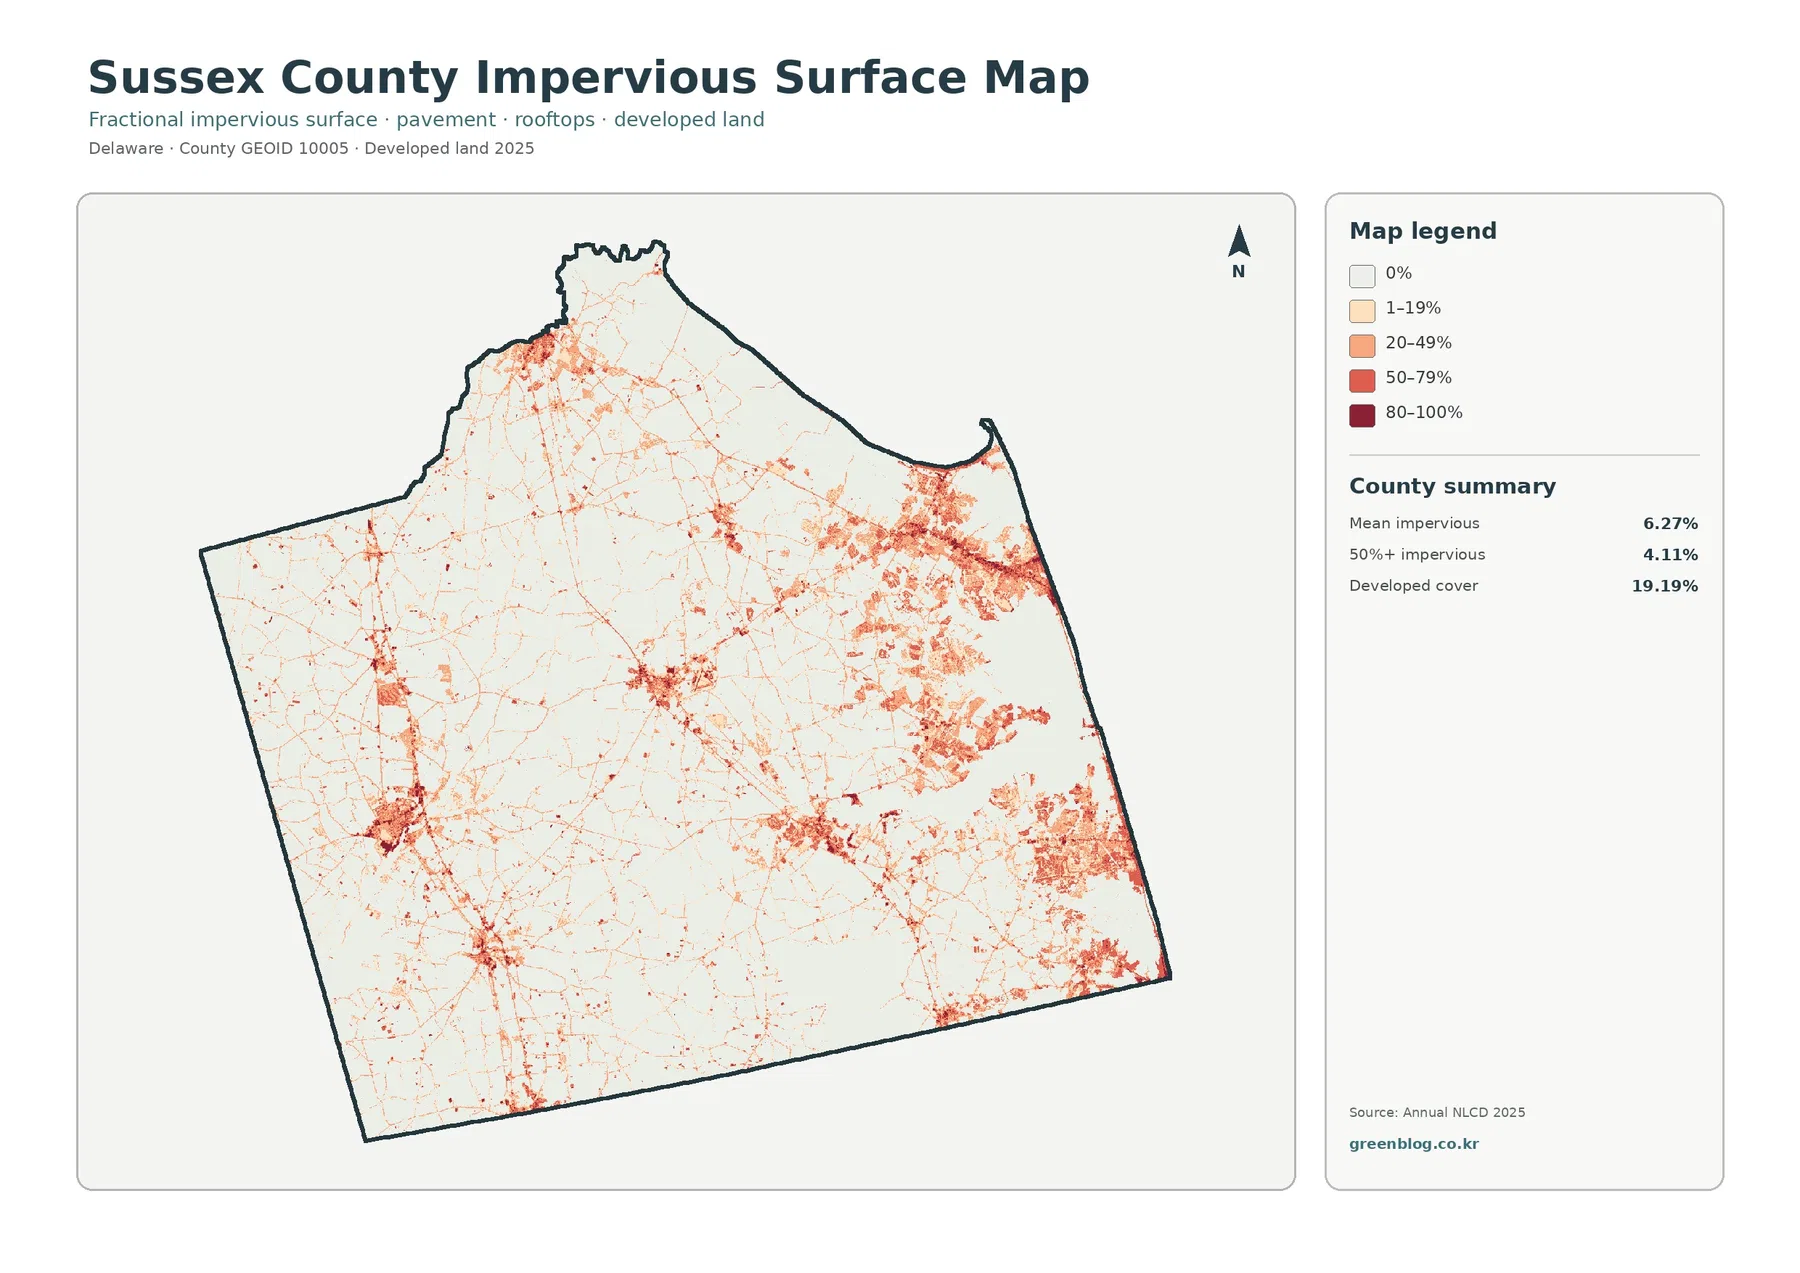
Impervious surface means hard ground such as pavement, parking areas, and rooftops where water does not readily soak into the soil. Sussex County’s mean impervious cover is 6.27%, and 4.11% of the county falls in areas mapped at 50% or more impervious. The pattern is not evenly distributed. Stronger clusters appear in the east, with other concentrated nodes in the northwest, center, and south, while large agricultural and wetland areas remain very light.
The gap between 19.19% developed land and 6.27% mean impervious cover is important. A developed land-cover cell can contain homes, yards, trees, lawns, and open soil, while the impervious layer estimates the fraction occupied by hard surfaces. Commercial districts, major roads, and dense built areas therefore tend to stand out more strongly than low-density residential landscapes. Reading both maps together gives a better picture of development intensity than either percentage alone.
This map provides stormwater and watershed context because hard surfaces are relevant to runoff. It does not calculate flood risk, drainage capacity, or pollutant loads on its own. Rainfall, soils, topography, drainage infrastructure, and watershed boundaries all matter. In a coastal county with extensive wetlands and Inland Bays, the impervious map is one layer of context rather than a final environmental assessment.
The 1985–2025 comparison highlights change across the east and several inland centers
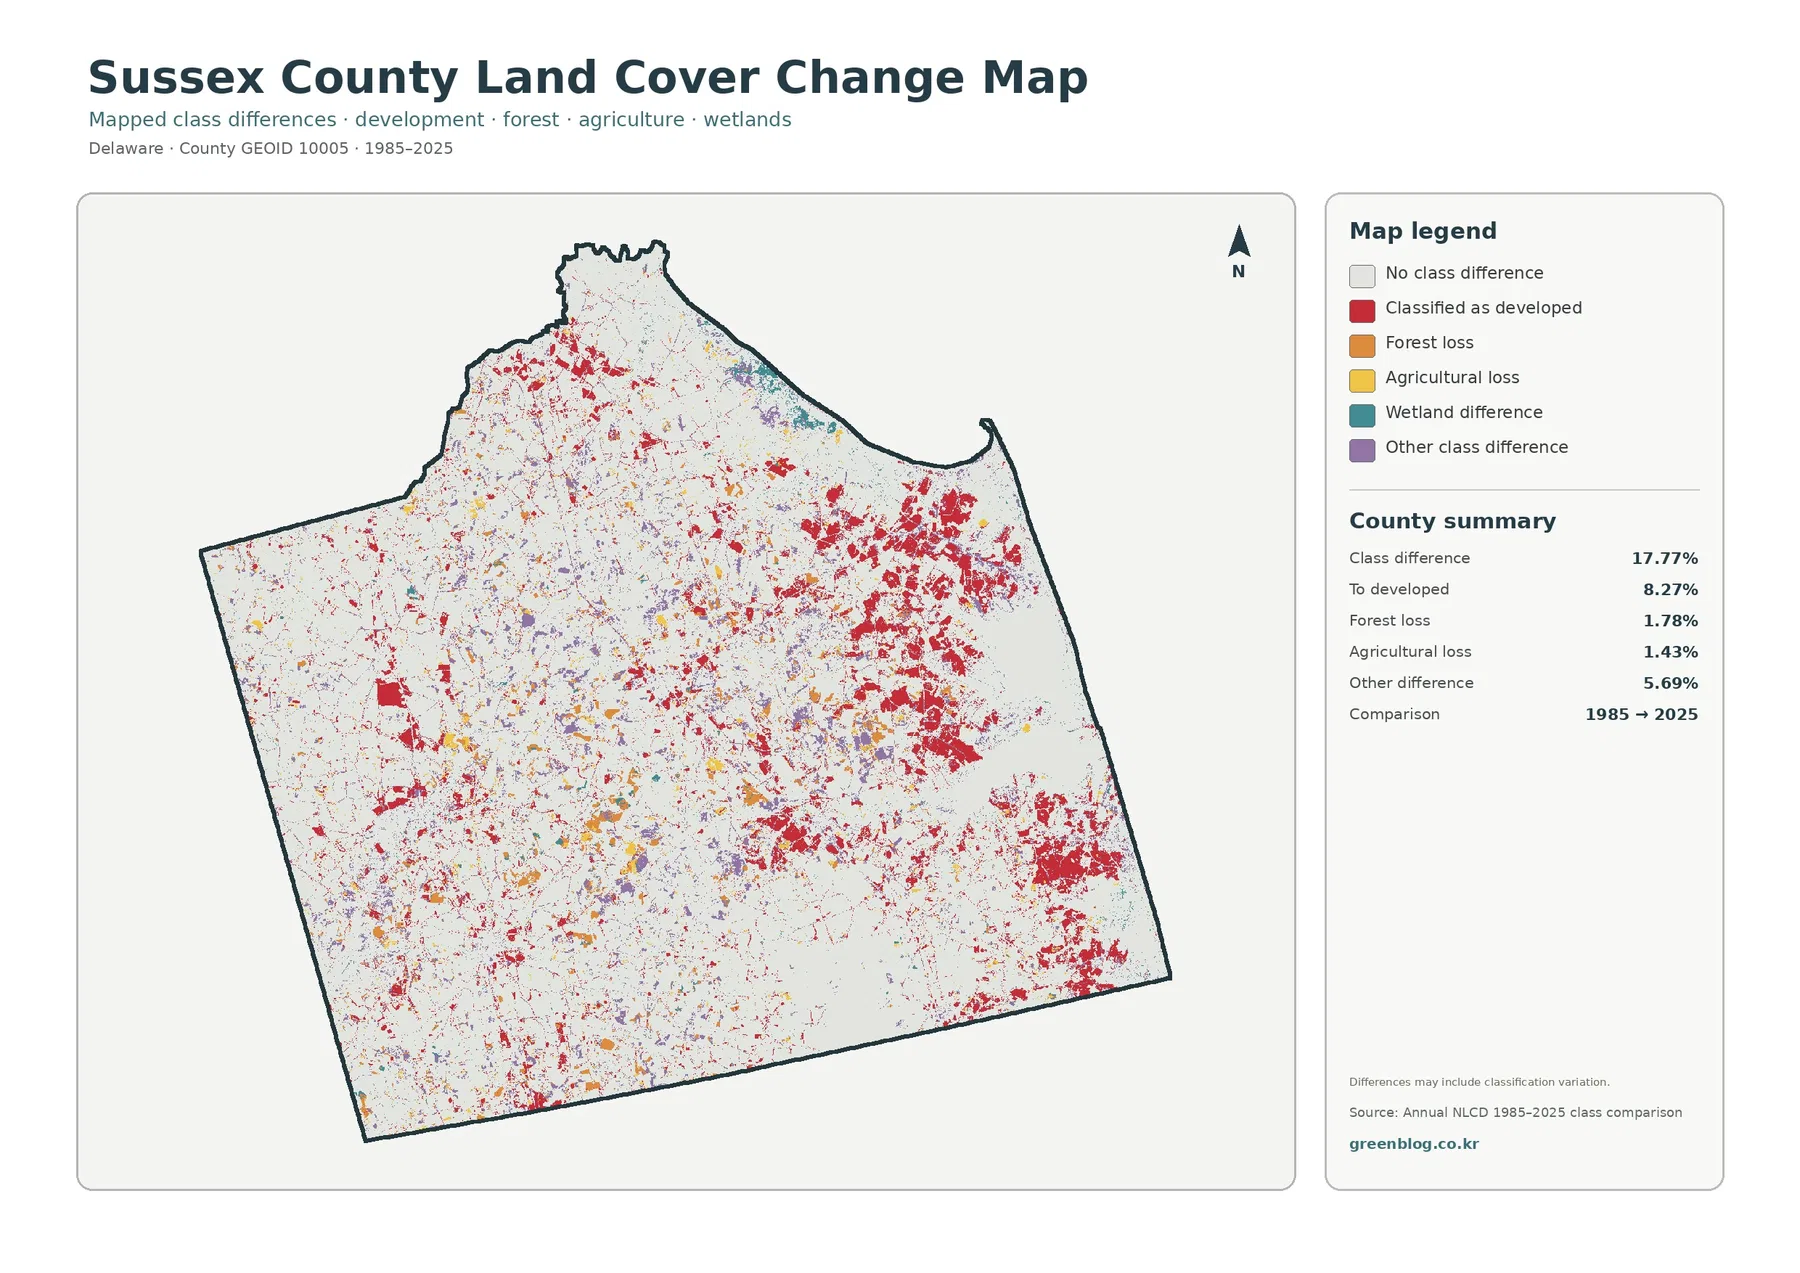
The change map reports a 17.77% class difference between 1985 and 2025. The largest named component is 8.27% classified as developed in 2025. Forest loss is listed at 1.78%, agricultural loss at 1.43%, and other difference at 5.69%. Red change cells are especially widespread in the eastern half of the county, but additional clusters appear in the northwest, center, and southern portions. The result is a much more dispersed change pattern than a single expanding urban core.
The 17.77% figure is not a documented development-growth rate. It is the share of mapped cells whose class differs between the two dates. Satellite observations, classification methods, mixed pixels, and small boundary shifts can all contribute to differences. The map itself warns that the comparison may include classification variation. The timing or cause of a specific land conversion depends on historical aerial imagery, development records, planning documents, or other evidence beyond the endpoint colors.
Even with that limitation, the comparison provides a county-scale screening view. Large red groups quickly identify places where 2025 developed classification differs from 1985. Orange forest-loss and yellow agricultural-loss cells point to other types of change, while wetland difference is mapped separately in the legend. The county summary does not provide a standalone wetland-difference percentage, so no separate percentage is estimated from the image. A precise wetland-change figure depends on analysis of the source data.
Why the Inland Bays matter when reading the eastern side
DNREC’s Inland Bays wetland assessment describes uncommon wetland communities around the bays and notes the importance of remaining tidal and non-tidal wetlands. Its statewide habitat material also says that Sussex County contains nearly half of Delaware’s wetlands. Those facts provide valuable context for the 22.81% wetland share on the 2025 map. The percentages are not interchangeable, however. The DNREC statement describes the county’s share of statewide wetland acreage, while 22.81% describes the share of Sussex County mapped as wetland in this land-cover product.
Developed land sits close to some of these water-rich landscapes, especially in the east. That visual relationship shows where environmental and development questions may overlap, but it does not prove that development caused a particular wetland condition or water-quality problem. DNREC’s Inland Bays programs examine nutrients, wastewater, runoff, and other factors through separate datasets and regulations. The land-cover map supplies location and surface context, not a complete diagnosis.
The same caution applies to agriculture. Broad cropland areas lie near streams, drainage corridors, and wetland patches throughout the interior. The map can show those classes side by side, but it cannot report farm ownership, crop type, nutrient-management practice, or preservation status. Farm ownership, crop practices, preservation status, and planning policy come from Delaware Department of Agriculture and county planning sources rather than land-cover colors alone.
Differences among the four Sussex County map views
The general land-cover map keeps the full legend and five major percentages together. The forest-and-farmland map reduces developed and miscellaneous classes to emphasize farming, forest, wetlands, and open water. The impervious map isolates hard-surface concentration, while the change map compares 1985 and 2025 endpoint classifications.
Each downloadable JPG measures 2480 by 1754 pixels. At very large print sizes, effective resolution decreases. The map’s aspect ratio, legend, and county summary preserve the context needed to interpret the colors and percentages.
The quoted values are tied to their observation dates. The land-cover, forest-and-farmland, and impervious maps describe 2025, while the change map compares 1985 with 2025. Construction, farm conversion, restoration, shoreline work, or vegetation changes after the 2025 observation period may not appear. Newer aerial imagery and local records provide information about conditions after the 2025 observation period.
Scale, classification, and countywide statistics
Annual NLCD is designed for consistent land-cover mapping across large areas. Its Landsat-based 30-meter grid is not a parcel survey. A single raster cell can contain part of a road, a yard, a field edge, trees, and wet soil at the same time, while the land-cover layer assigns a class and the impervious layer estimates a percentage. Enlarging the image does not create detail beyond the resolution of the source raster.
Legal and financial decisions rely on more specific official sources. Zoning, parcel boundaries, jurisdictional wetlands, floodplain status, building permits, and conservation easements are separate datasets. The map locates broad areas of interest but does not determine whether a parcel is buildable or whether a mapped wet area falls under a particular regulation. Those determinations come from the responsible county, state, or federal source.
The percentages on these maps are countywide values. These images present countywide patterns without municipal boundaries or separate statistics for coastal communities, inland towns, or individual watersheds. A strong red cluster in the east therefore cannot be assigned the county’s 19.19% developed share, and a farming district cannot automatically be given the county’s 37.81% agriculture value. Smaller-area statistics depend on a separate calculation using the proper boundary and source raster.
Frequently Asked Questions
What is the largest land-cover class in Sussex County in 2025?
Agriculture is the largest class at 37.81%. Wetlands follow at 22.81%, developed land at 19.19%, forest at 13.71%, and water at 4.79%.
Why does Sussex County have 19.19% developed land but only 6.27% mean impervious cover?
Developed land can include lawns, trees, soil, and other surfaces that still absorb water. Impervious cover measures hard surfaces such as pavement and rooftops separately, so the countywide mean is lower.
Does the 17.77% class difference mean Sussex County developed by 17.77% from 1985 to 2025?
No. It is the share of mapped cells with a different land-cover class between the two dates. The map identifies 8.27% as changes classified as developed in 2025, and some differences may include classification variation.
Sources and reference material
- MRLC Annual NLCD Data – land-cover and impervious-surface data reference
- USGS Annual NLCD Land Cover Classification – class definitions and interpretation
- USGS Annual NLCD Collection 1.2 Land Cover – Annual NLCD land-cover archive including 2025
- USGS: Annual NLCD Collection 1.2 Now Available – release notice stating that Annual NLCD extends through 2025
- USGS Annual NLCD Collection 1 Products, version 1.2 – official data release for the June 2026 Collection 1.2 product suite
- U.S. Census Bureau TIGER/Line Shapefiles – county boundary reference
- Sussex County Comprehensive Plan – local context for farmland, forests, wetlands, and natural resources
- DNREC Inland Bays Watershed Wetland Assessment – wetland context for southeastern Sussex County
- DNREC Habitat Condition – statewide and Sussex County wetland context
- Delaware Agricultural Statistics Bulletin – Sussex County farm and agriculture context
Map File Information
Download four JPG maps in one ZIP: 2025 land cover, forest and farmland, impervious/developed land, and the 1985–2025 land-cover change map.
- Included Files: 4 JPG maps
Related Maps
- Delaware County New York Land Cover Map
- Kent County Delaware Land Cover Map
- New Castle County Delaware Land Cover Map
Green Map creates custom-edited map images using open geographic data sources such as geoBoundaries, Natural Earth, OpenStreetMap, and government open data.
These maps are edited visual materials, not raw data files, and are provided for education, documents, presentations, and graphic reference.