New Castle County has the strongest developed-land share of Delaware’s three counties in this map set. The 2025 summary lists developed land at 45.72%, followed by agriculture at 21.84%, wetlands at 16.22%, forest at 13.31%, and water at 2.34%. The map is not uniform, however. Dense development dominates much of the north, while farmland and wetlands become increasingly important toward the southern half of the county.
This page includes four views: current land cover, forest and farmland, impervious surface with developed land, and mapped class differences between 1985 and 2025. The four original JPG maps are available together in one download. They can be used for county overviews, classroom work, planning context, environmental presentations, or side-by-side comparisons, but they should not be treated as zoning or parcel maps.
Table of Contents
A county where the landscape changes sharply from north to south
New Castle County occupies the northern end of Delaware and contains the state’s largest concentration of urban and suburban development. Wilmington and Newark are part of the northern county, while the landscape farther south contains much larger agricultural and wetland areas. The supplied maps do not draw municipal boundaries or label cities, so the colors should be read as countywide land-cover patterns rather than exact city statistics.
The contrast is especially clear because the northern third is filled with contiguous developed classes, while the southern portion contains broad yellow agricultural areas mixed with teal wetlands and smaller developed clusters. The middle of the county works as a transition between those two patterns. That makes a north-versus-south comparison more informative here than simply listing the county percentages.
New Castle County’s NCC2050 Comprehensive Plan, approved in 2022, provides useful planning background for growth, services, and environmental assets. It is a different product from Annual NLCD. A future land-use designation or zoning category tells the reader about policy and regulation, while land cover describes the physical surface observed and classified from remote-sensing data.
Development dominates the 2025 land-cover map, but not every part of the county
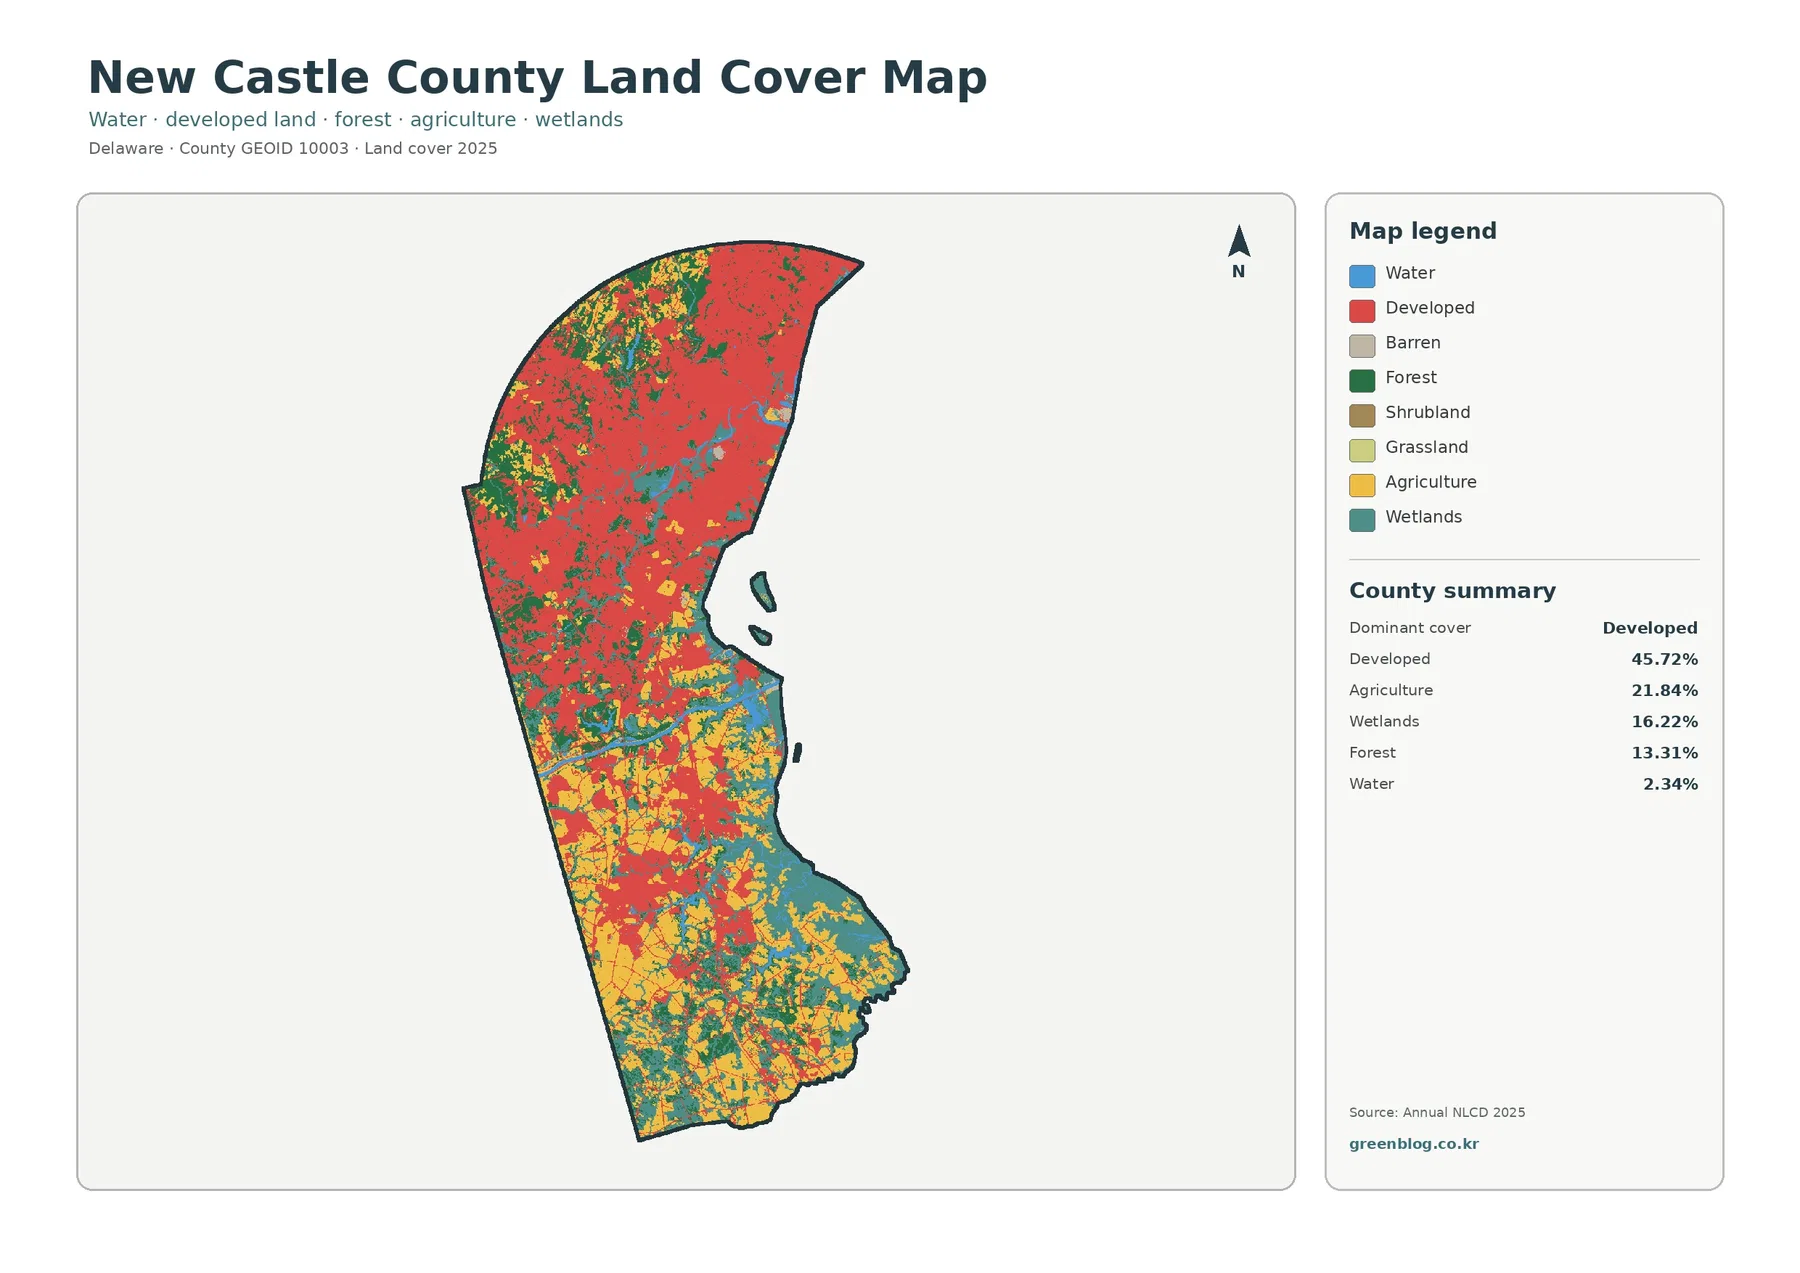
The general map is the best place to see the full contrast. Red developed classes cover most of the northern county and extend southward in several connected bands. Agriculture becomes much more prominent in the lower half, especially across broad interior areas. Wetlands occupy substantial areas in the south and along low-lying water-connected landscapes, while forest appears in scattered blocks rather than as one continuous countywide belt.
A developed share of 45.72% does not mean that nearly half of the county is roof or pavement. NLCD developed classes can include lawns, trees, and other pervious surfaces within residential and suburban settings. This distinction matters because the impervious-surface map reports a much lower countywide mean of 17.10%. The two measures answer related but different questions.
The general map is also useful for showing how mixed the southern county remains. Farmland, wetlands, forest patches, small water features, and developed areas sit next to one another. At this scale, many boundaries are generalized. A field edge, stream corridor, or neighborhood margin may occupy only part of a 30-meter raster cell, so the color on the map should be treated as a classified summary rather than a surveyed line.
The northern impervious pattern adds detail that the developed class cannot provide
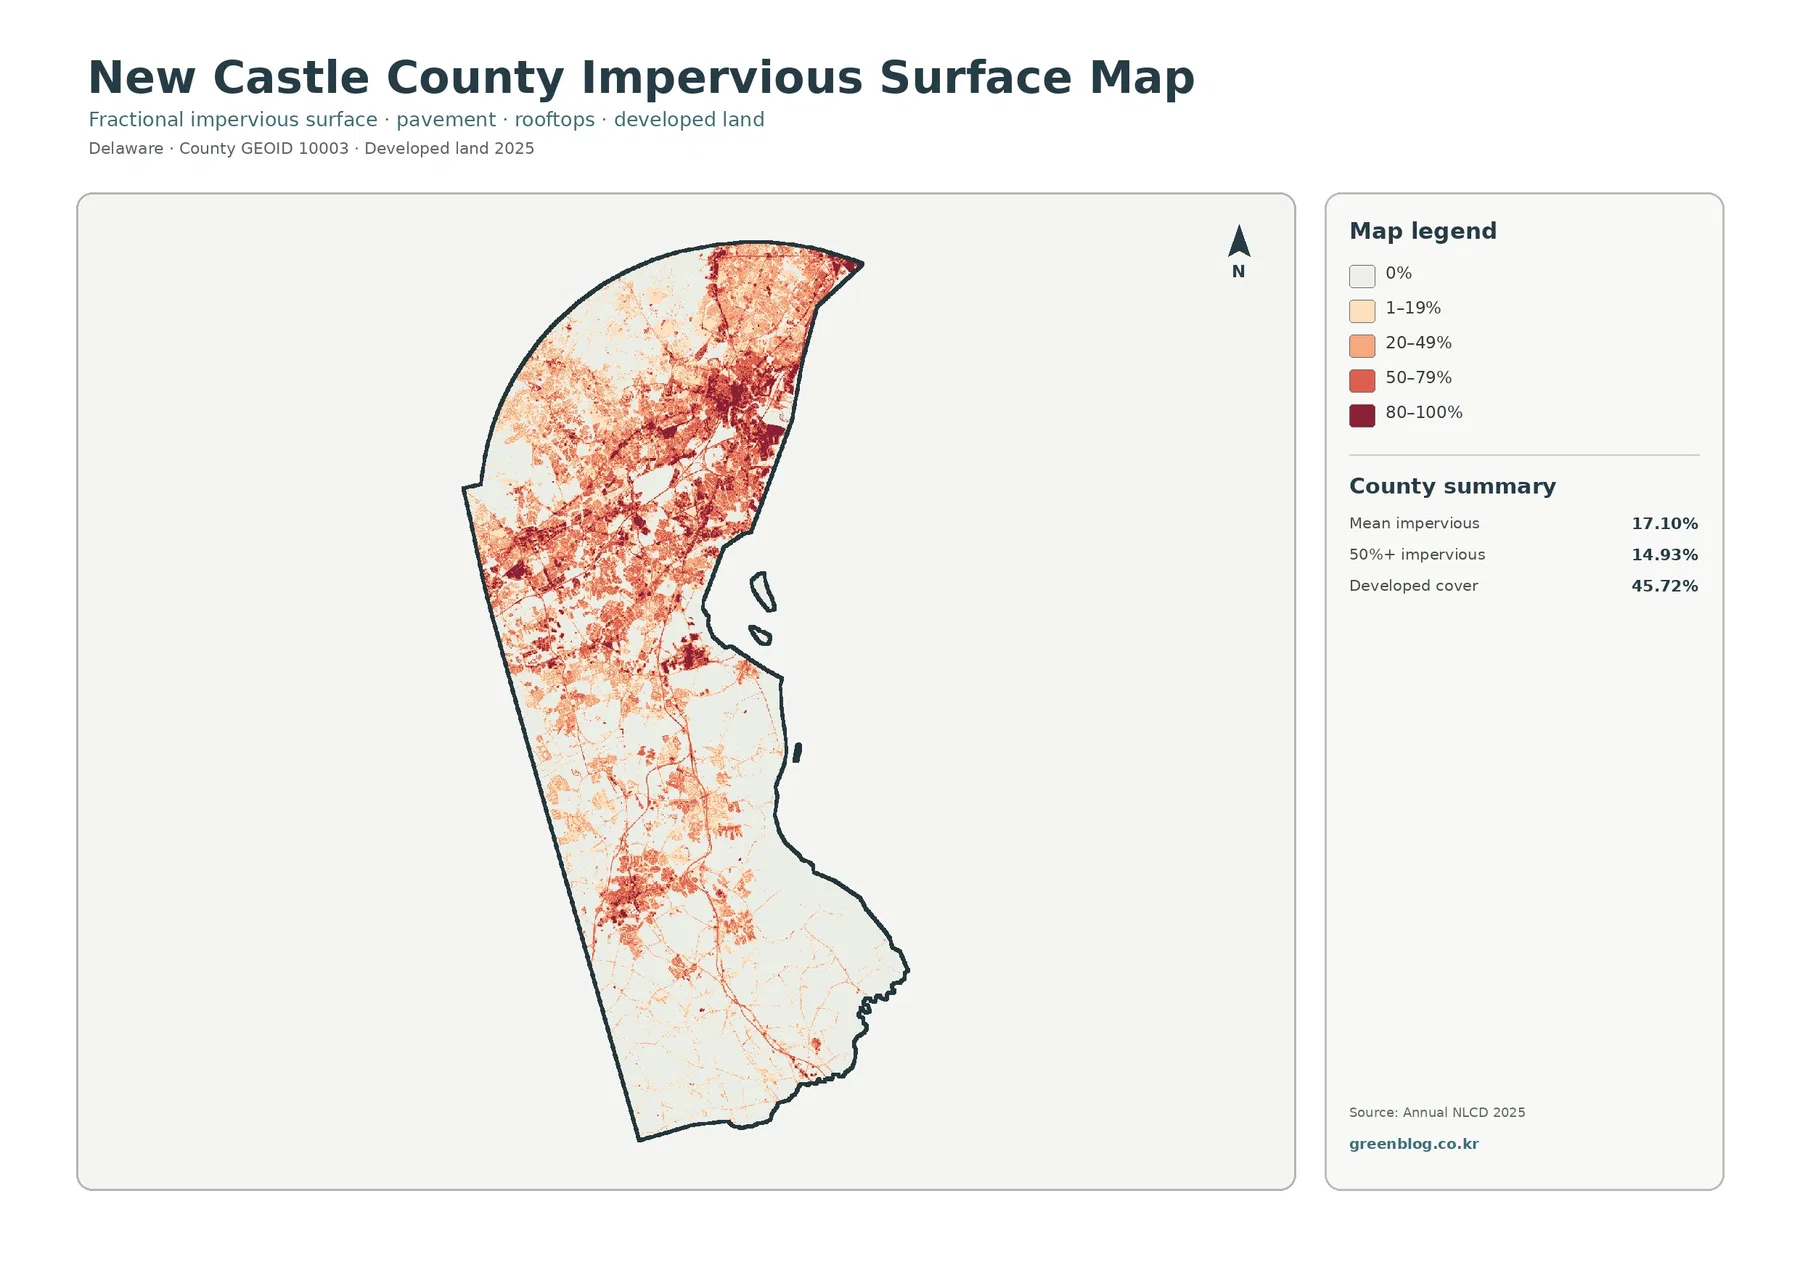
Impervious surface means pavement, rooftops, parking lots, and other surfaces that shed water rather than allowing it to soak into the ground. The countywide mean is 17.10%, and 14.93% of the county is mapped at 50% impervious or higher. The darkest and most continuous values are concentrated in the north, with additional clusters extending through the central county and around developed centers farther south.
This map makes the northern urban pattern much easier to distinguish from lower-density developed land. A suburban neighborhood may still be classified as developed on the land-cover map while containing substantial lawns and tree cover. A commercial district or transportation corridor can have a far higher impervious percentage. Comparing the two maps prevents a common mistake: assuming that every developed pixel has the same surface character.
Impervious cover can be relevant to stormwater, stream condition, and urban heat discussions, but the map alone cannot establish flood risk or water-quality impacts for a specific site. Drainage infrastructure, soil, slope, rainfall, stream geometry, and local engineering conditions also matter. The map is best used as a screening and comparison layer, not as a substitute for site analysis.
The county’s GreeNCC initiatives provide a local policy context for topics such as habitat protection, water quality, smart growth, and reducing impervious coverage. Those policies help explain why impervious surface is an important planning metric, but they should not be interpreted as the cause of any particular pattern shown on the 2025 map.
Farmland and wetlands become the defining features of the southern county
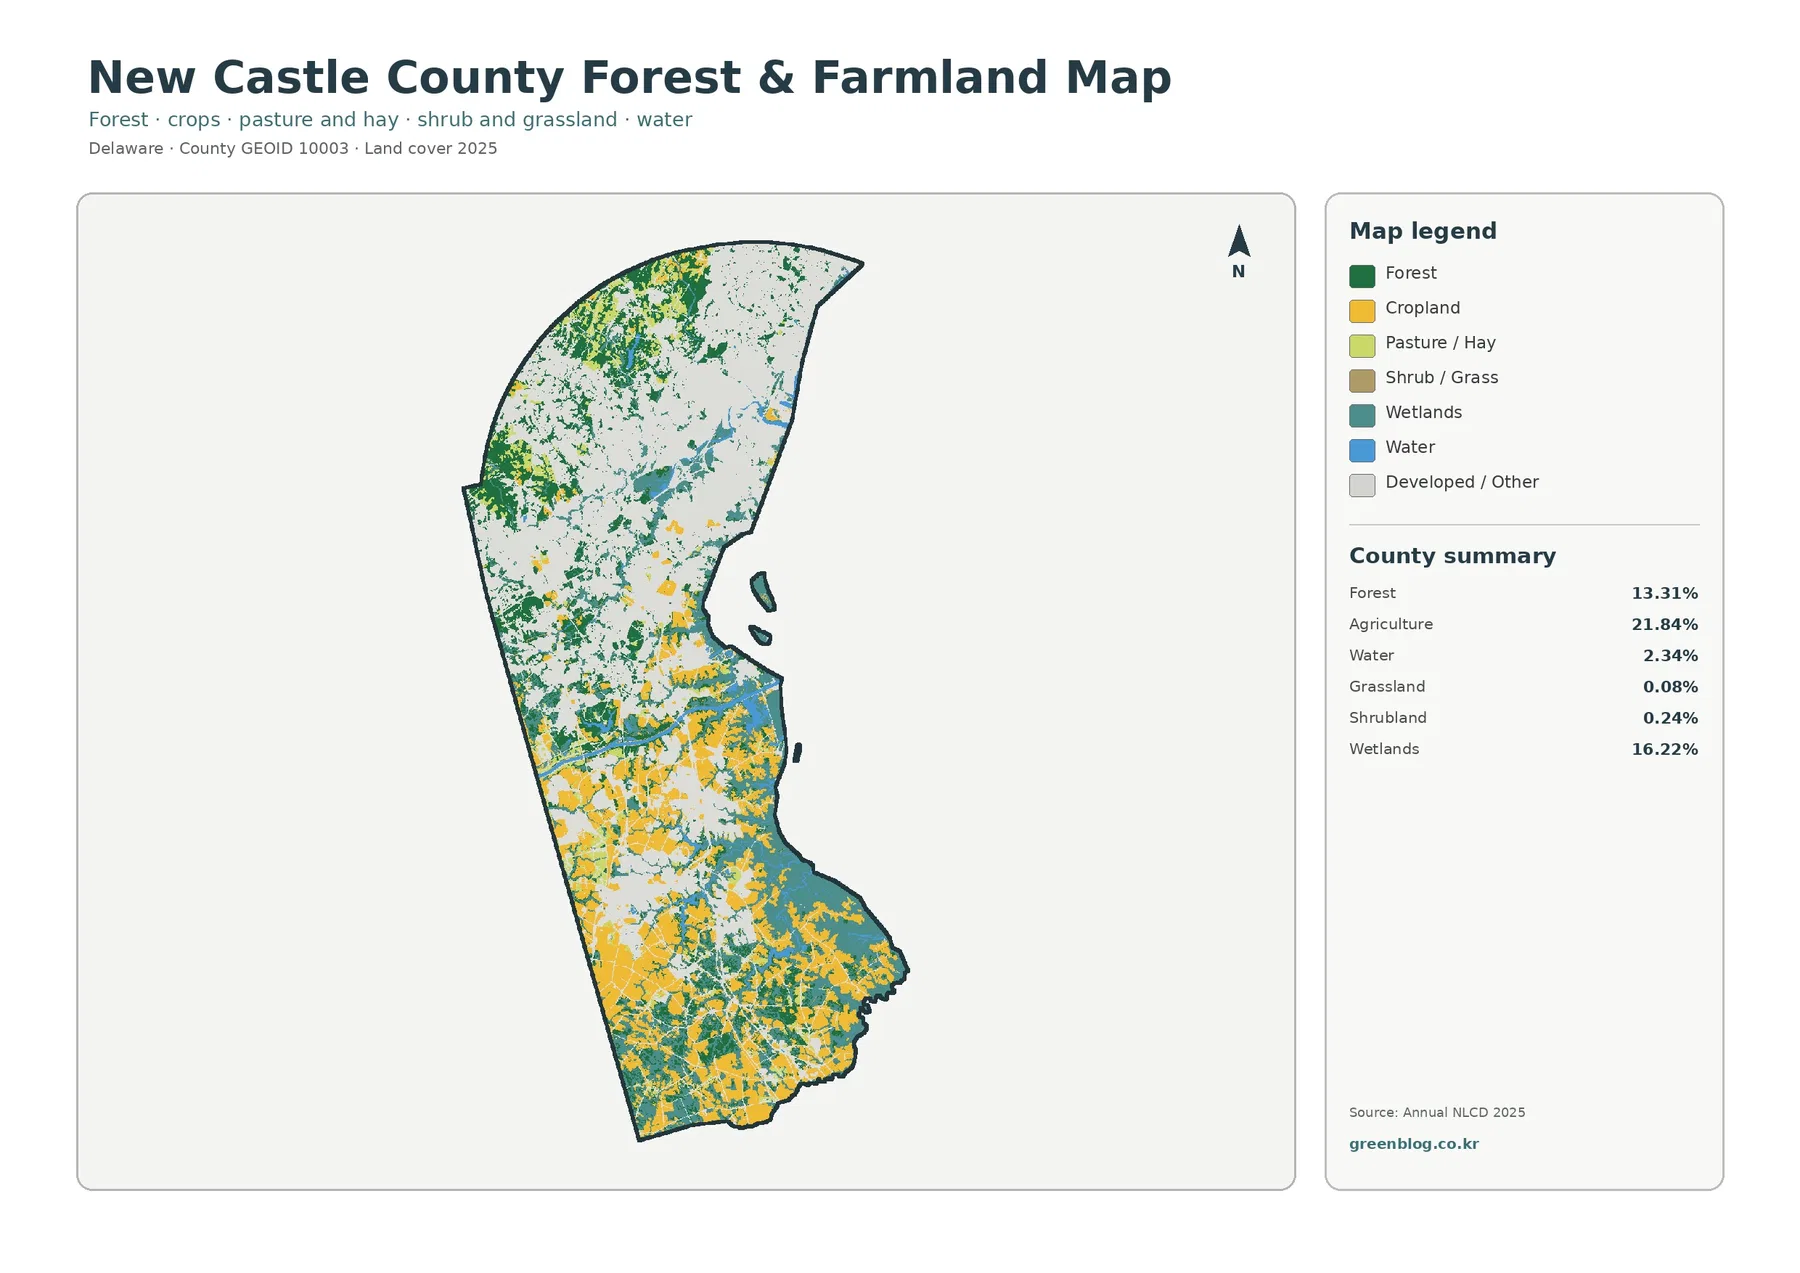
Removing most of the developed-color detail makes the southern landscape easier to read. Agriculture accounts for 21.84% of the county and forms broad blocks across the lower half. Wetlands account for 16.22% and are especially extensive toward the southeast and around water-connected lowlands. Forest covers 13.31%, appearing in larger patches in some western and central areas and in many smaller fragments among other land-cover types.
The map shows that southern New Castle County is not simply farmland. Wetlands occupy a large share, and forest, water, and developed centers interrupt the agricultural pattern. A distinct developed cluster is visible in the southern interior as well. Because the map does not include municipal lines, it is safer to describe that cluster by location rather than assign an exact land-cover percentage to a named town.
Wetland color on this map is a land-cover classification, not a regulatory wetland delineation. Anyone making a permitting, construction, property, or conservation decision needs the appropriate state and federal wetland resources plus field-level information. The same caution applies to agricultural land. Yellow pixels describe mapped surface cover; they do not identify preserved farmland, ownership, or a legal agricultural district.
Grassland and shrubland occupy only very small shares in the supplied summary, so they are not major countywide themes in this map. Focusing on developed land, agriculture, wetlands, and forest gives a more faithful picture of what is actually visible instead of giving minor classes the same weight as the dominant categories.
The 1985–2025 comparison contains a large mapped class difference
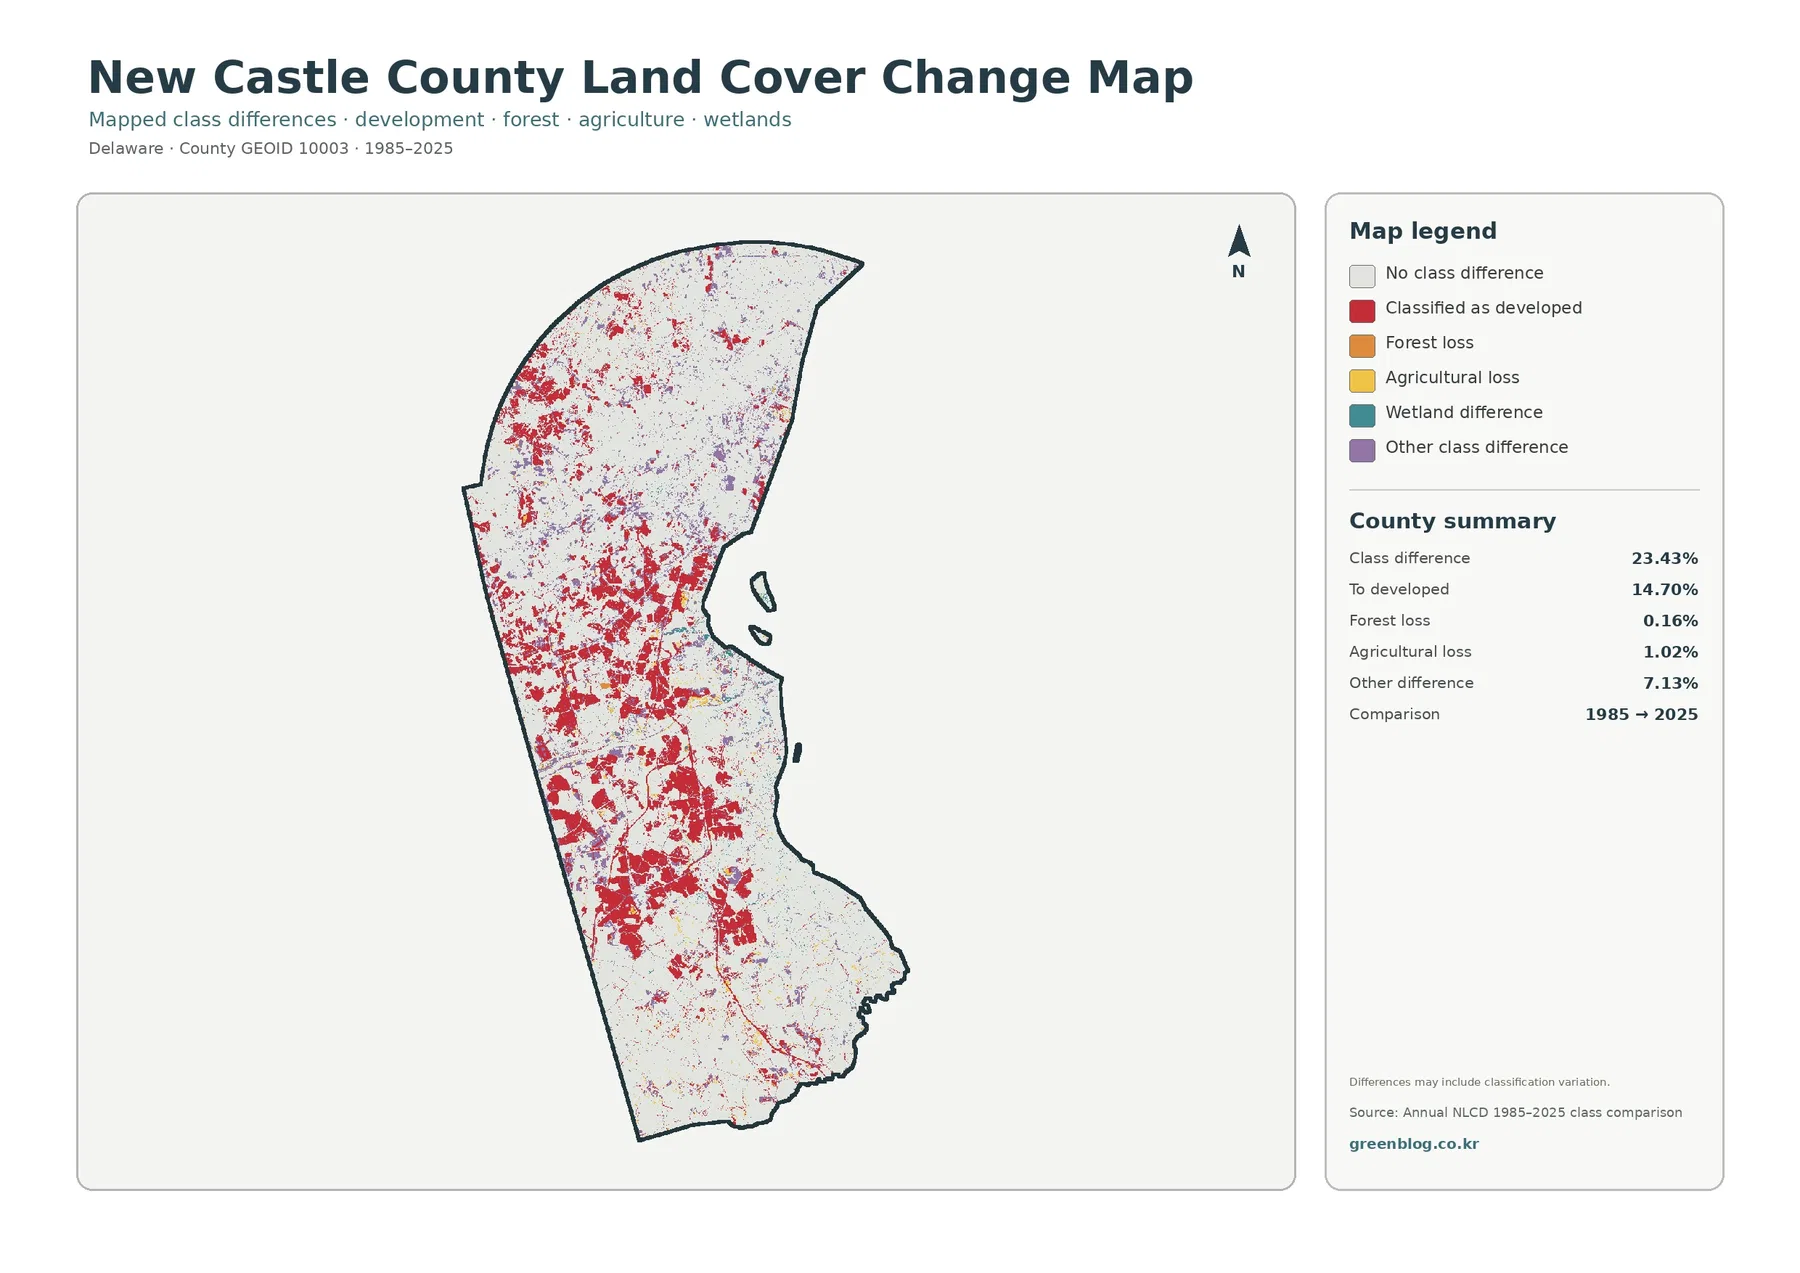
The change map reports a total class difference of 23.43% between 1985 and 2025. Of that area, 14.70% is shown as classified as developed in 2025. Agricultural loss is listed at 1.02%, forest loss at 0.16%, and other class differences at 7.13%. Red change areas are widespread through the northern and central county and also appear around several southern development clusters.
A 23.43% class difference should not be described as a 23.43% increase in development. It combines all mapped cells whose classes differ between the two comparison years. Sensor characteristics, classification methods, mixed pixels, and small boundary shifts can contribute to the result. The map itself notes that differences may include classification variation, which is why the numbers should be treated as a screening summary.
The 14.70% “to developed” category is more specific, but it still does not provide the year when each place changed or the reason for the change. Development records, historical aerial photography, and local planning files are necessary for that level of interpretation. What the map does well is point to locations where a closer look is likely to be productive.
How to choose the right map for a report or presentation
For a one-page county overview, start with the general land-cover map because it contains the broadest context. It immediately shows the urban north and the more agricultural, wetland-rich south. If the subject is farming, habitat, or natural resources, the forest-and-farmland map reduces visual clutter and makes those classes easier to compare.
Use the impervious map when the question is about built surfaces rather than the broader developed category. It is especially useful for explaining why a county can be 45.72% developed while its mean impervious surface is 17.10%. Use the change map when a historical comparison is necessary, but label it clearly as a 1985–2025 class comparison rather than a development-permit history.
The original JPG files are 2480×1754 pixels according to the supplied asset manifest. They are useful for documents, slides, and many classroom applications, but the package does not mark them as meeting its A3 high-resolution reference. If the maps will be enlarged substantially, check the legend and summary text at the intended output size before printing.
Limits to remember before using the maps for detailed decisions
Annual NLCD is designed for consistent regional and national comparison, not parcel surveying. Its 30-meter raster cells can contain several real-world surfaces at once. A narrow road, wetland edge, stream, yard, and tree canopy may share one cell, so the assigned class is a generalized representation. Enlarging the image does not create additional positional accuracy.
The 2025 maps also cannot show changes that occurred after the observation period. If a project depends on current construction, recent clearing, a new road, or a wetland restoration, supplement the map with newer aerial imagery and local records. For zoning, ownership, development rights, wetland permitting, or engineering, use the official datasets designed for those decisions.
Countywide percentages should not be copied into statistics for Wilmington, Newark, Middletown, or any other municipality. The supplied summary is calculated for the entire New Castle County boundary. Municipal figures require a separate analysis using the correct city or town boundary.
Frequently Asked Questions
What is the largest land-cover class in New Castle County?
Developed land is the largest 2025 class at 45.72%. Agriculture is 21.84%, wetlands 16.22%, forest 13.31%, and water 2.34%. The northern county is much more developed than the southern portion.
Why is developed land 45.72% while mean impervious cover is 17.10%?
Developed land can include lawns, trees, and other pervious surfaces within developed settings. Impervious cover measures rooftops, pavement, and similar surfaces separately, so its countywide average is lower.
Does the 23.43% 1985–2025 class difference mean development increased by 23.43%?
No. The 23.43% value includes all cells whose mapped class differs between the two years. The area classified as developed in 2025 within the change summary is 14.70%, and classification variation may also contribute to the comparison.
Sources and reference material
- MRLC Annual NLCD Data – source for Annual NLCD land-cover and impervious products
- USGS Annual NLCD Land Cover Classification – class definitions and interpretation of the 30 m land-cover product
- U.S. Census Bureau TIGER/Line Shapefiles – county boundary reference
- New Castle County NCC2050 Comprehensive Plan – local planning context for growth and environmental assets
- New Castle County GreeNCC – local environmental and land-use initiatives
Map File Information
The ZIP includes four original JPG maps: 2025 land cover, forest and farmland, impervious surface with developed land, and the 1985–2025 land-cover change comparison.
- Included Files: Use only the versions confirmed in the article and supplied images
- File Type: Use the confirmed download contents
- Intended Use: Printing, education, presentations, and map-based projects
Related Maps
Green Map creates custom-edited map images using open geographic data sources such as geoBoundaries, Natural Earth, OpenStreetMap, and government open data.
These maps are edited visual materials, not raw data files, and are provided for education, documents, presentations, and graphic reference.