You can download the complete Newton County map set here as four high-resolution A3 JPG files in one ZIP archive. Newton County lies east of Atlanta, with Covington as the main urban anchor, Oxford immediately to its northwest, Porterdale just to the southwest, and Newborn and Mansfield on the eastern side. I-20 and the US 278/State Route 12 corridor cross the northern part of the county, while the Yellow, Alcovy, Little, and South rivers divide the landscape into rolling ridges and valleys.
The maps reveal a county with two very different visual patterns. In the north, cities, major roads, and developed areas are concentrated around Covington and Oxford. Farther south, city labels become sparse and the map is dominated by long roads, streams, and wooded-looking terrain. The water and elevation maps add another layer to that contrast: the rivers occupy lower corridors, while higher ridges are especially common toward the north and northeast.
Table of Contents
Covington anchors the busy northern corridor
The general county map puts Covington near the north-central part of Newton County and shows it as the largest developed area on the page. Oxford is immediately northwest of Covington, while Porterdale sits to the southwest. Newborn and Mansfield are separated from that cluster on the eastern side. Outside the county boundary, Conyers appears to the west, Walnut Grove to the north, and Social Circle to the northeast, which helps place Newton County within the surrounding part of Georgia.
Roads reinforce the same north-heavy pattern. I-20 and the route marked 402 enter from the west and cross the county near Covington, while US 278 and State Route 12 run through the same broad east-west corridor. State Route 138 reaches northwestern Newton County, Route 81 bends through the west and southwest, and Routes 142 and 11 serve the eastern side. Routes 36, 162, and 212 appear farther south, where the road network spreads out and the city labels largely disappear.
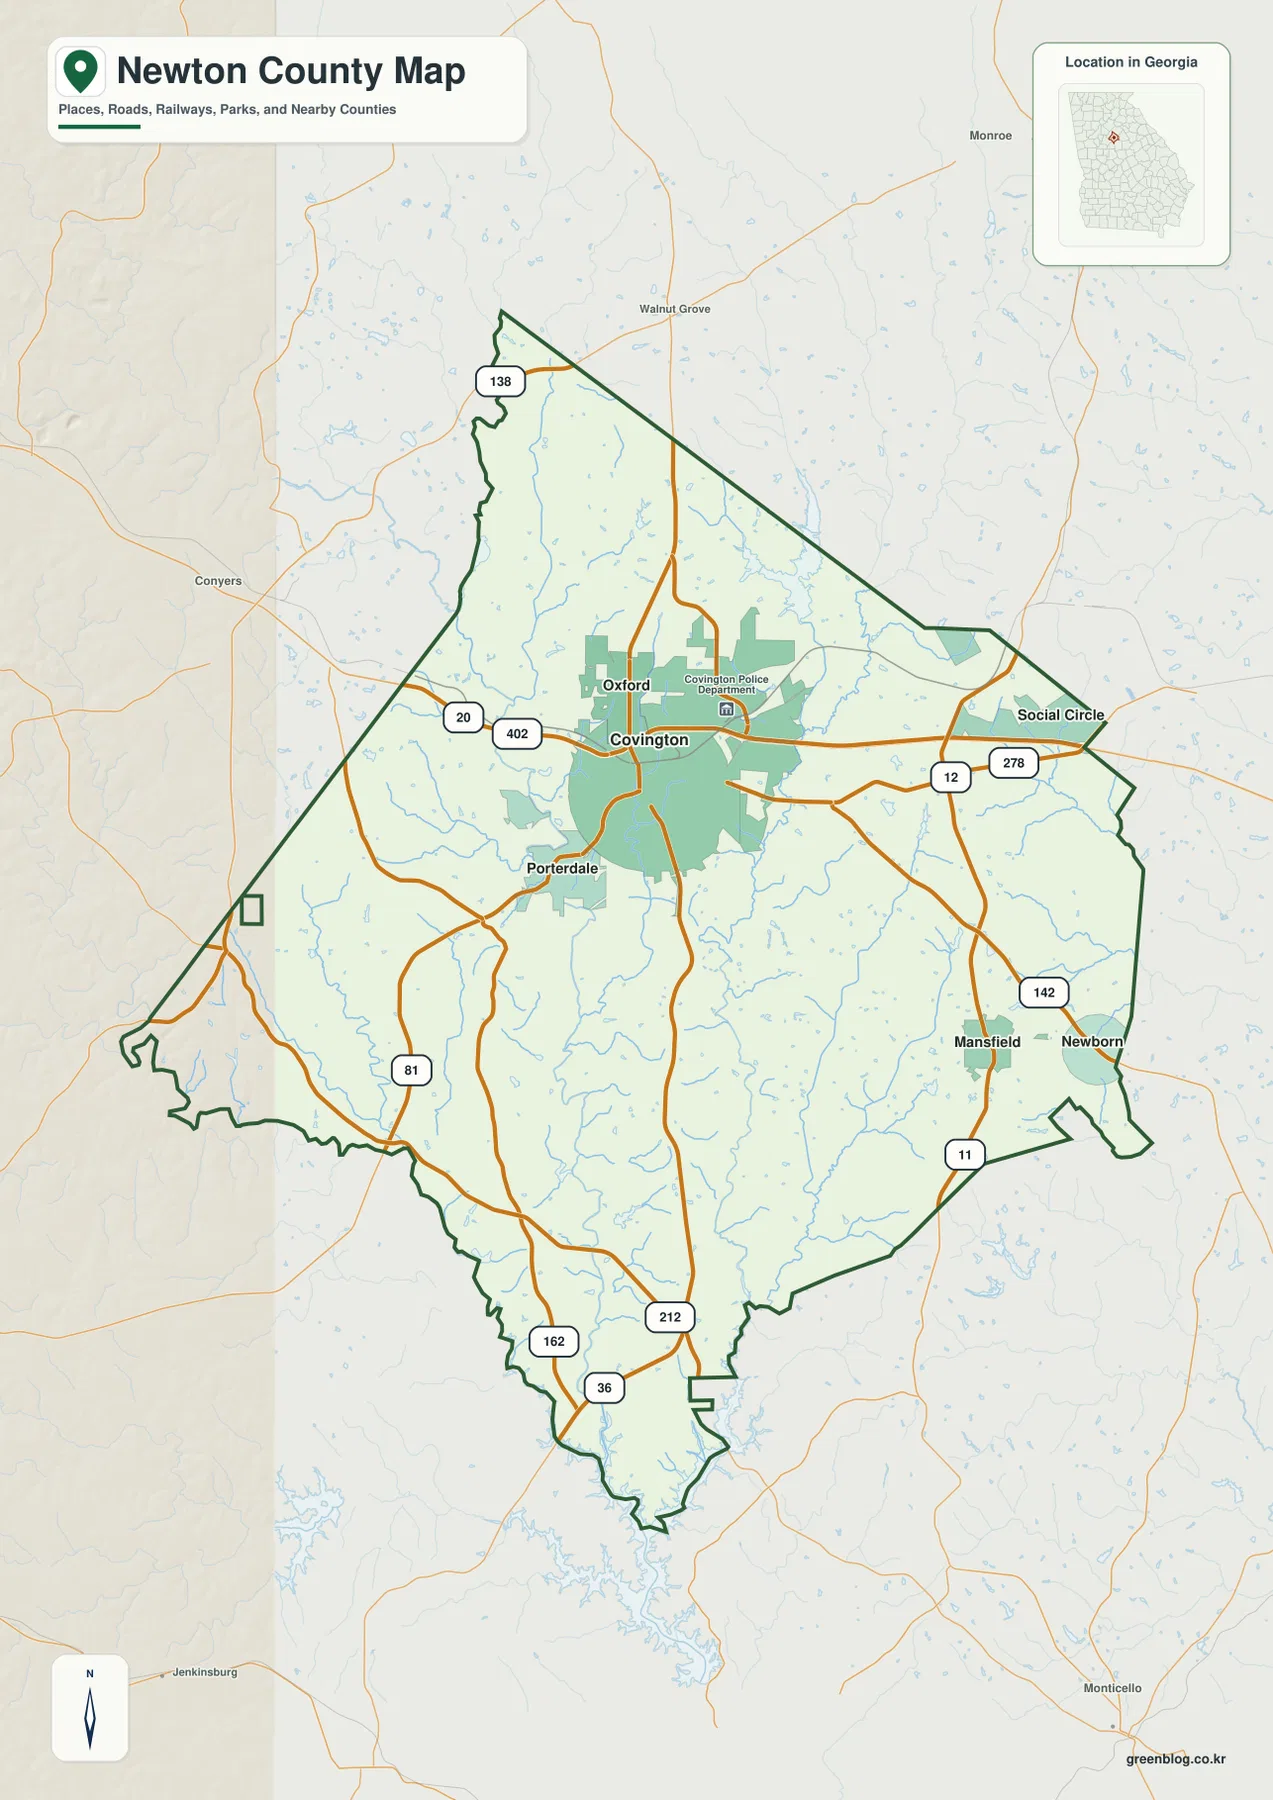
The map is especially useful for seeing how the urban center relates to the county’s long southern section. Covington, Oxford, and Porterdale form a compact cluster near the north, but the boundary extends much farther south through areas with fewer large place labels. That shape matters when reading the other maps: many of the rivers and lower valleys continue through the less urban southern half rather than following the same pattern as the northern road corridor.
Five ranked cities show a compact center and a separate eastern pair
The city-distribution map simplifies Newton County to five ranked places. Its index lists Covington at 14,584, Oxford at 1,770, Porterdale at 1,466, Newborn at 653, and Mansfield at 380. Those values are presented on the supplied map as reference figures; here they are most useful for understanding the ranking and the very large gap between Covington and the smaller cities.
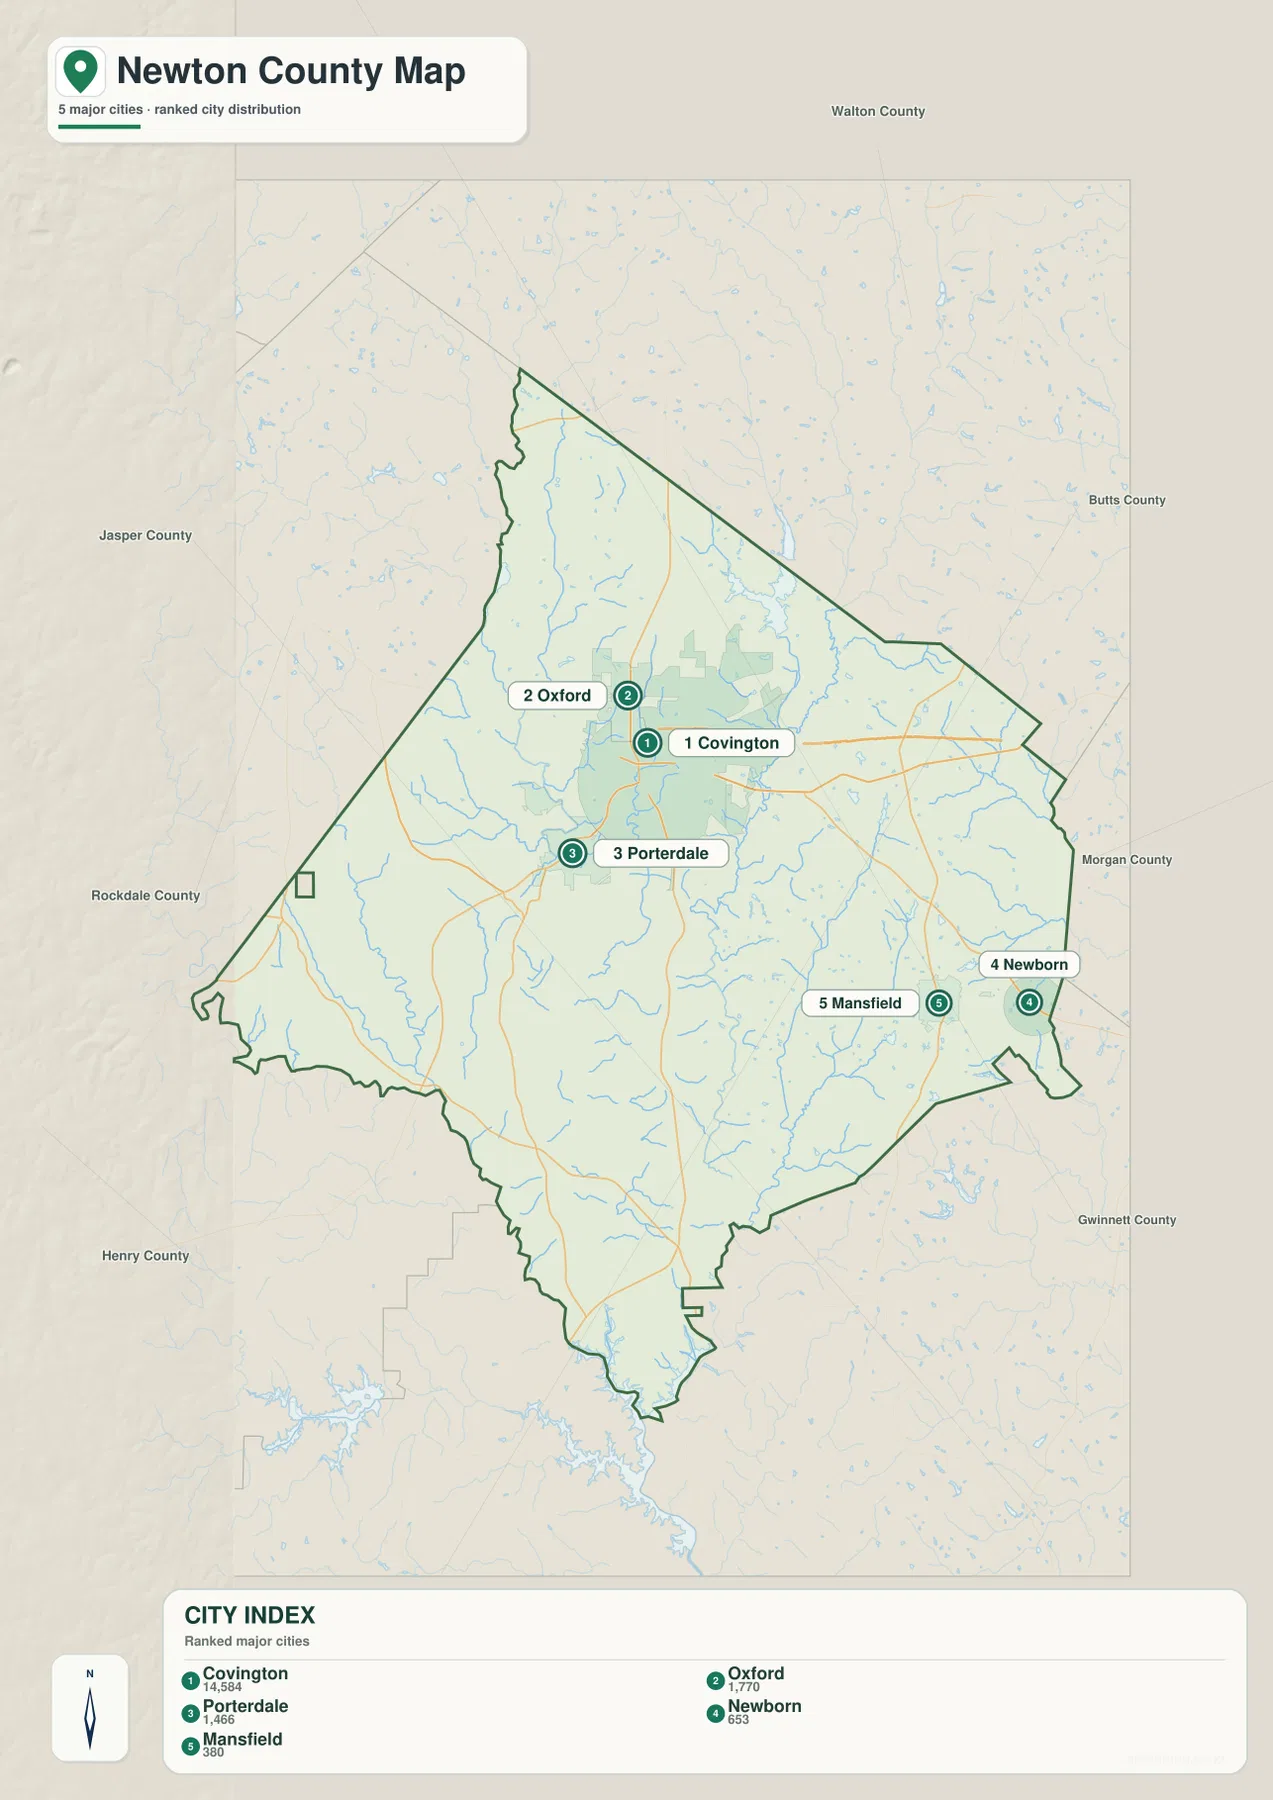
The geographic arrangement is just as important as the ranking. Oxford is positioned almost beside Covington, and Porterdale is only a short distance to the southwest on the map. Newborn and Mansfield form a separate eastern grouping. The result is a clear north-central cluster around Covington rather than a string of evenly spaced towns across the county.
This layer is not intended to inventory every neighborhood or unincorporated community. It is a major-city view, so smaller named places may be absent even when they are locally important. Its strength is the quick comparison: a reader can see where the five ranked cities sit, which ones are close to Covington, and which ones lie farther toward the eastern boundary without the extra facility and road labels of the general map.
Yellow and Alcovy river corridors organize the water map
The dedicated water map changes the emphasis completely. The Yellow River appears through the western and southern part of the county, while the Alcovy River runs through the central-eastern interior. The Little River is labeled along the eastern side, and the South River enters the southwest. These larger streams are connected to a dense web of smaller creeks, showing why the county’s terrain is cut into many narrow ridges and valleys.
Several smaller water features are labeled clearly enough to serve as local reference points. Gum Creek appears in the northwest. Ellis Lake and Covington Reservoir sit around the Covington area. A Branch of Yellow River is labeled west of the county center, and Dried Indian Creek runs through the interior. West Bear Creek appears toward the east, while Lake Bulow Campbell is labeled in the south and Hayes Pond in the southeast. The water layer therefore provides much more than a simple outline of the largest rivers.
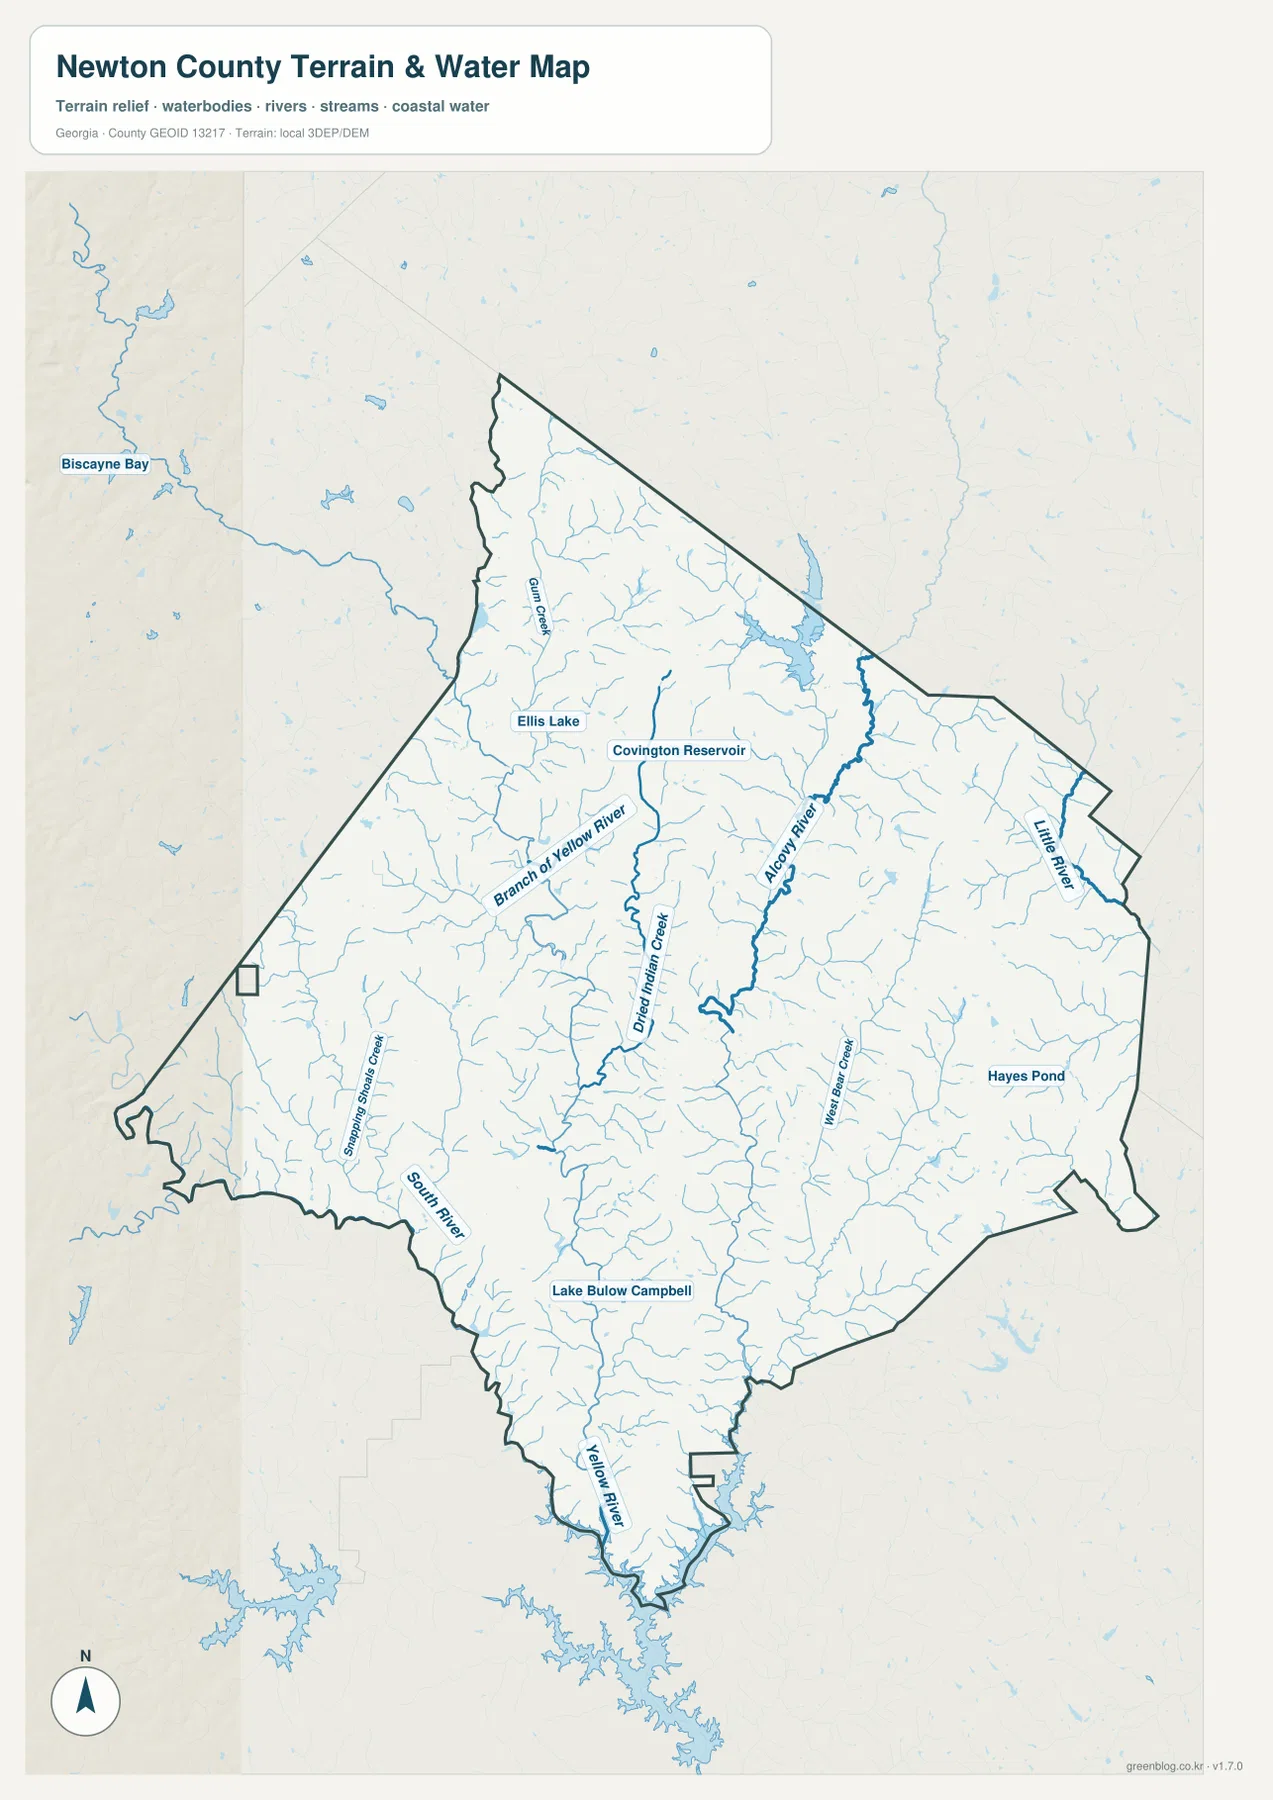
One of the clearest patterns is the way the major rivers lead toward lower parts of the county. The Yellow River corridor becomes especially prominent in the southern extension, while the Alcovy follows another north-to-south route farther east. Between them, many tributaries feed into the larger channels. Comparing this map with the road map also shows that the urban concentration around Covington sits among several drainage lines rather than on a featureless plain.
This is a water-reference map, not a flood-hazard, navigation, depth, or parcel-boundary product. It is appropriate for locating named streams and water bodies and for comparing them with the county outline. Any decision involving flood risk, legal water boundaries, or site-specific hydrology should rely on the current official data prepared for that purpose.
Elevation ranges from about 161 to 293 meters across rolling terrain
The elevation map reports an actual range of about 161 to 293 meters and a mean of about 214 meters. Higher browns and tans are widespread across the northern and northeastern part of Newton County, while green bands trace lower valleys through the center and toward the south. The county is therefore not a single smooth slope; it is a repeated sequence of ridges, creek valleys, and broader river corridors.
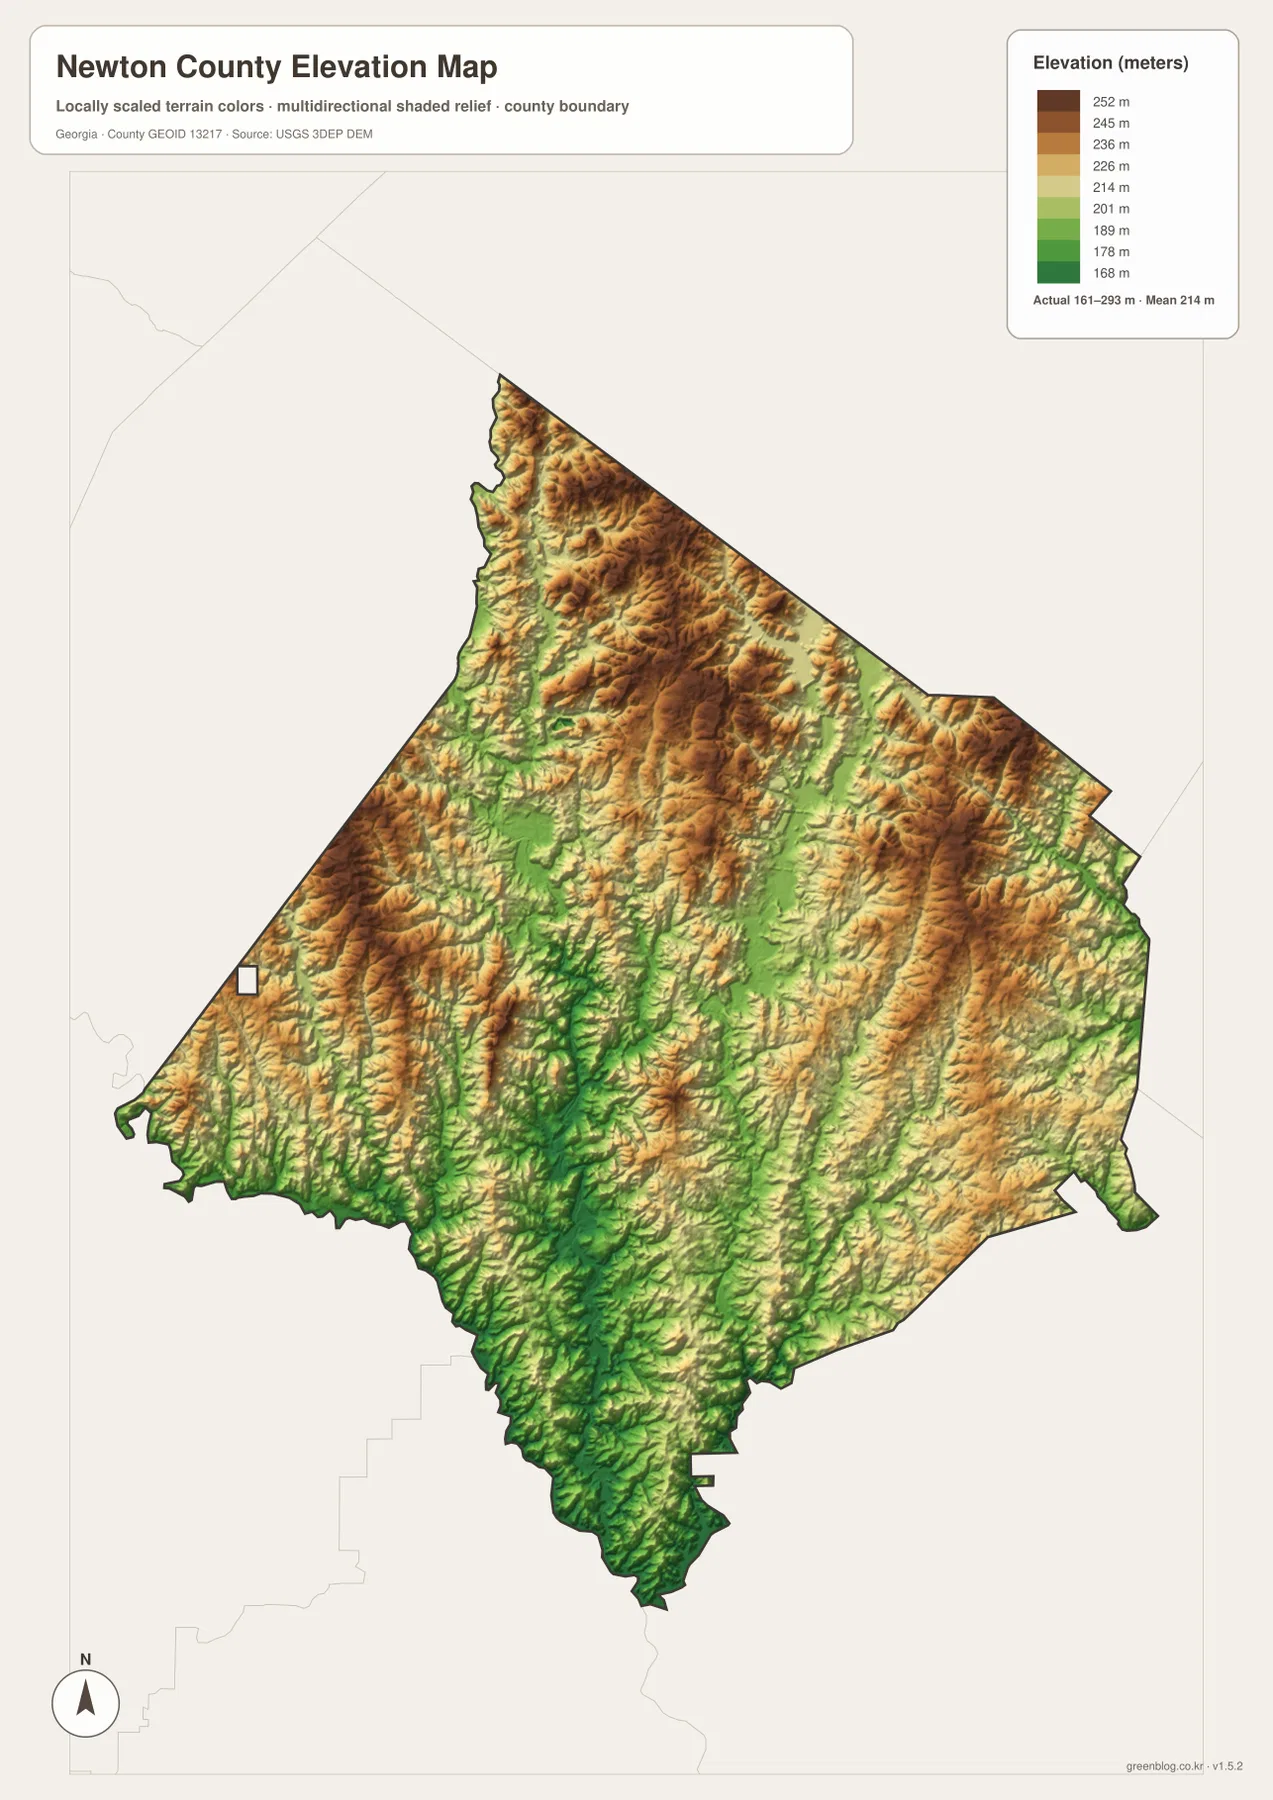
The river map explains many of those green corridors. Lower bands often follow the same general paths as the Yellow and Alcovy systems and their tributaries. In the north, even the higher ground is cut by narrow low valleys, while the southern half contains a broader network of low corridors mixed with smaller ridges. This combination gives Newton County a rolling appearance rather than the broad flat surface that might be expected from a simple county locator map.
The shaded relief is designed for county-scale comparison. It helps identify where the terrain is generally higher or lower, but it is not survey-grade or engineering-grade elevation. Exact site heights, construction design, and property-level decisions require detailed official elevation data or field measurements. For general geographic reading, however, the map makes the relationship between rivers and relief much easier to see.
Choose the map by the question: roads, cities, water, or relief
For a first look at Newton County, the general map is the best starting point because it combines Covington, the major roads, the county boundary, and surrounding place names. The city layer is better when the main question is how Covington compares with Oxford, Porterdale, Newborn, and Mansfield. The water and elevation layers then explain the physical landscape beneath that settlement pattern: large rivers, small creeks, reservoirs, higher ridges, and lower valleys.
- Road and county orientation: use the general map for Covington, Oxford, Porterdale, I-20, US 278/12, and the overall boundary.
- City comparison: use the ranked city map to compare the five displayed cities and the east-versus-center settlement pattern.
- Water features: use the water map for the Yellow, Alcovy, Little, and South rivers, Covington Reservoir, and labeled creeks or ponds.
- Terrain: use the elevation map to compare the 161–293 meter range and the higher northern ridges with lower stream valleys.
The WEBP images in the article are sized for quick page viewing. For printing, classroom displays, reports, or closer inspection on a large screen, the downloadable archive contains separate high-resolution A3 JPG files for the county, city, water, and elevation maps.
Frequently Asked Questions
Which five cities are ranked on the Newton County city map?
The supplied city layer ranks Covington, Oxford, Porterdale, Newborn, and Mansfield. Covington is the largest displayed city, Oxford and Porterdale sit close to the north-central cluster, and Newborn and Mansfield are farther east.
How do the Yellow and Alcovy rivers differ on the map?
The Yellow River is most prominent through the western and southern side of the county, while the Alcovy River follows a separate corridor through the central-eastern interior. Numerous smaller tributaries connect to both systems.
What elevation range is shown for Newton County?
The supplied elevation map reports an actual range of about 161 to 293 meters and a mean of about 214 meters. Higher ridges are common in the north and northeast, while lower valleys extend through the center and south along major drainage corridors.
Sources and reference data
These county and federal sources provide background information or official boundary, hydrography, and elevation data that complement the supplied map set.
- Newton County government overview
- U.S. Census Bureau QuickFacts for Newton County
- New Georgia Encyclopedia: Newton County
- U.S. Census Bureau TIGER/Line Shapefiles
- USGS National Hydrography
- USGS 3D Elevation Program
Map File Information
Download one ZIP archive containing four high-resolution A3 JPG maps of Newton County.
- Included Files: county map, city map, water map, and elevation map
- File Type: four high-resolution JPG files in one ZIP archive
Related Maps
Green Map creates custom-edited map images using open geographic data sources such as geoBoundaries, Natural Earth, OpenStreetMap, and government open data. These maps are edited visual materials, not raw data files, and are provided for education, documents, presentations, and graphic reference.