Macoupin County is mostly agricultural in the 2025 land-cover summary, but the county does not look like one uninterrupted farm grid. Agriculture accounts for 71.68%, while forest reaches 19.17% and forms long, branching bands across the west, center, and south. Developed land is concentrated in several separate clusters, with the strongest central group corresponding to the Carlinville area. This page uses four views to explain that pattern: general land cover, forest and farmland, fractional impervious surface, and mapped class differences between 1985 and 2025.
The four original JPG maps are available together in one ZIP, while the WebP versions on the page are intended for quick viewing. The files are useful for comparing where crops dominate, where wooded cover breaks up the farm landscape, where hard surfaces cluster around towns and roads, and where the two comparison years receive different land-cover labels. Land cover is a description of the surface, not a parcel record. These maps do not establish zoning, ownership, legal land use, property boundaries, or whether a site can be developed.
Table of Contents
Wooded branches keep a 71.68% agricultural county from looking uniform
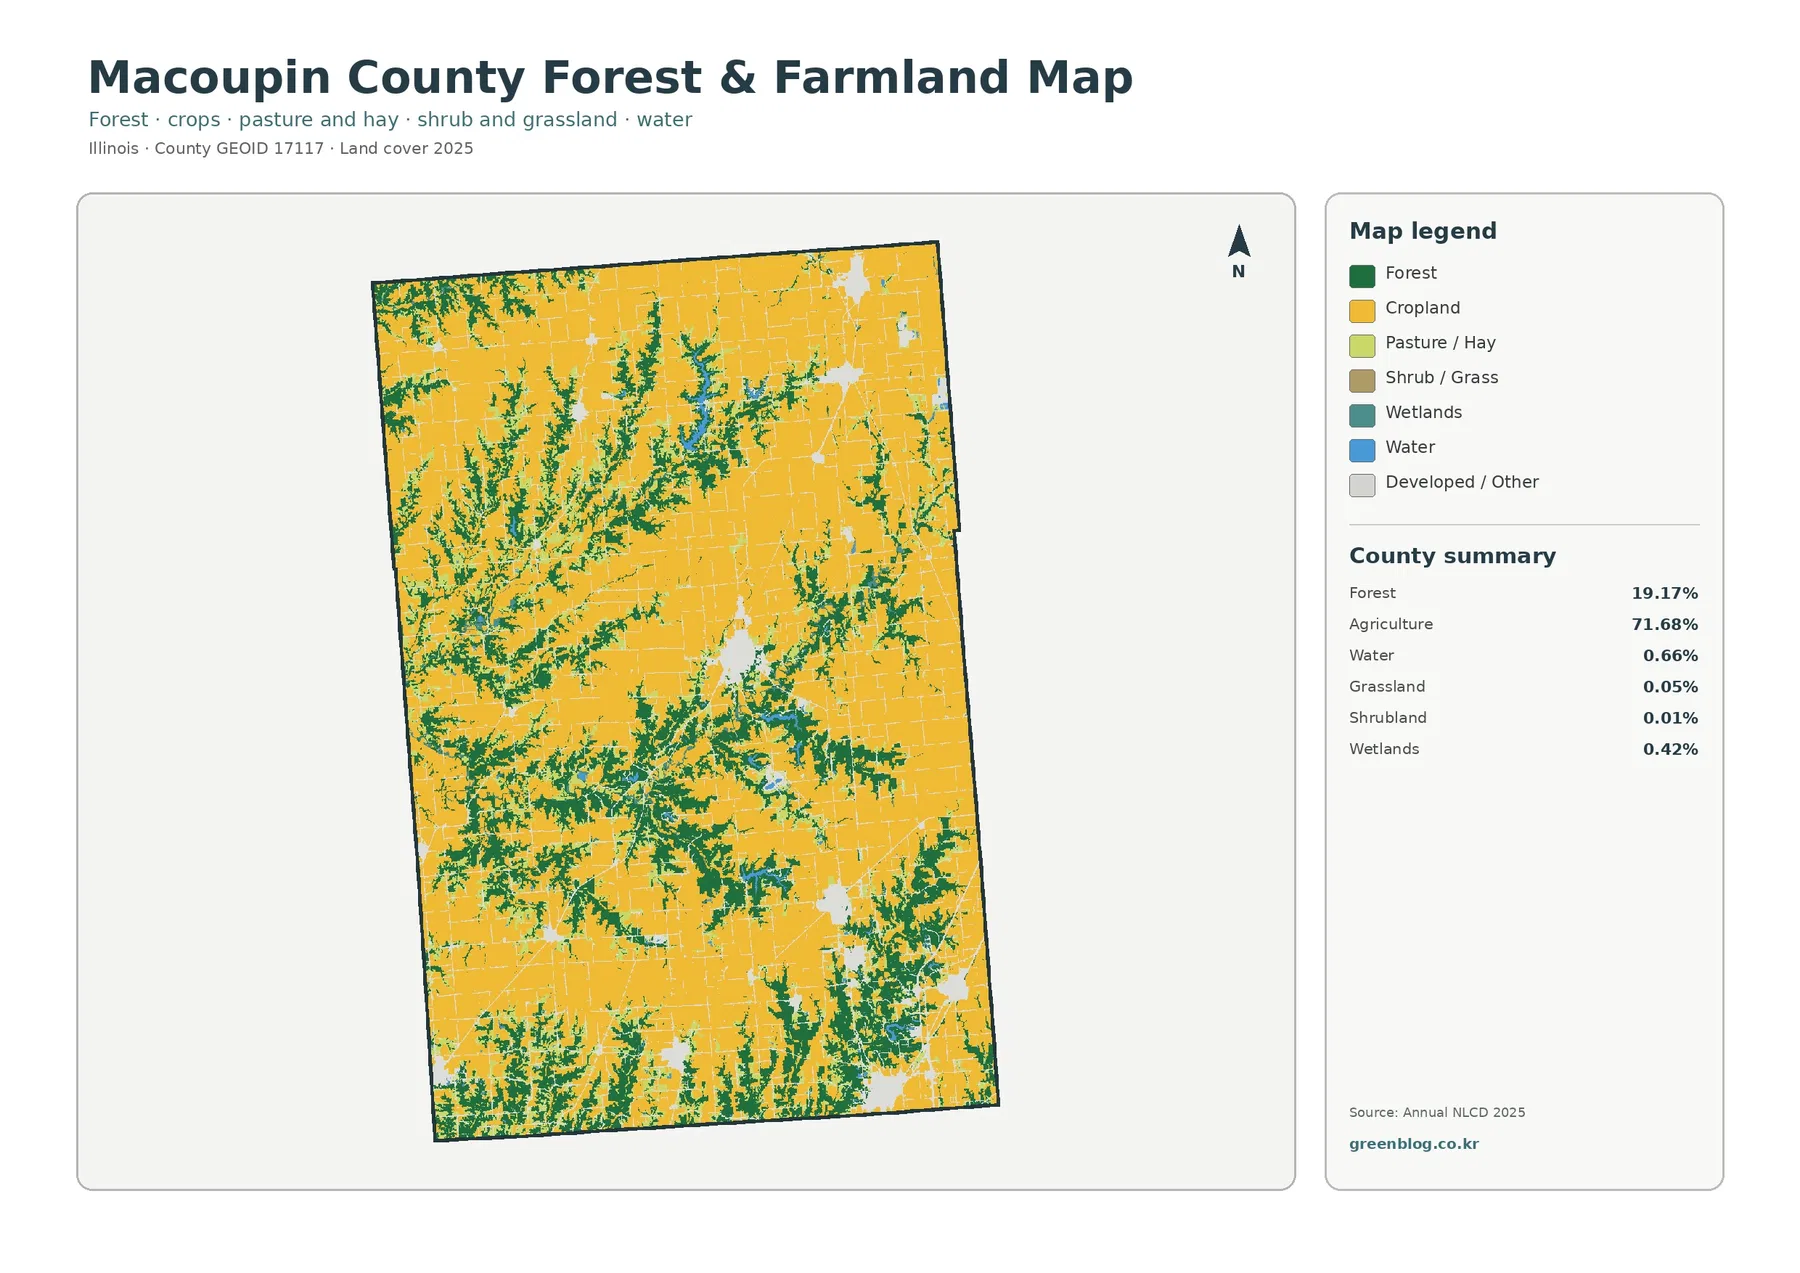
The forest-and-farmland view makes Macoupin County’s most distinctive visual feature easy to see. Yellow cropland occupies large blocks across the north, east, and much of the interior, yet dark green forest repeatedly cuts through those fields in irregular shapes. The northwest corner has several green fingers that enter from the county edge. Farther south, wooded cover becomes a dense web of narrow strips and larger patches, especially through the western half and the central-to-southern part of the county. The contrast between straight farm boundaries and curving woodland edges is stronger here than it is in counties where forest is only a small residual class.
Forest represents 19.17% of the mapped 2025 surface. That does not mean one fifth of the county is a single continuous woodland, and the image clearly shows why. Green areas are divided among many connected and semi-connected pieces, often with thin extensions between larger patches. Small blue water features and teal wetlands appear in and near some of the same corridors. Because this map does not label streams or topographic features, it would be unsafe to assign every wooded strip to a named creek from the land-cover image alone. The pattern is still useful for identifying places where a hydrography or aerial-image layer would deserve closer comparison.
The summary beside the map lists agriculture at 71.68%, water at 0.66%, wetlands at 0.42%, grassland at 0.05%, and shrubland at 0.01%. Water and wetlands occupy little area, but small classes can be visually important when they occur as narrow corridors rather than broad blocks. The reverse is true for agriculture: a very large share can look relatively simple at small scale because many crop areas form broad, repeated fields. Reading the percentages together with the shapes prevents a tiny class from being ignored and a dominant class from being treated as spatially uniform.
The full 2025 class map adds separated town centers to the farm-and-forest pattern
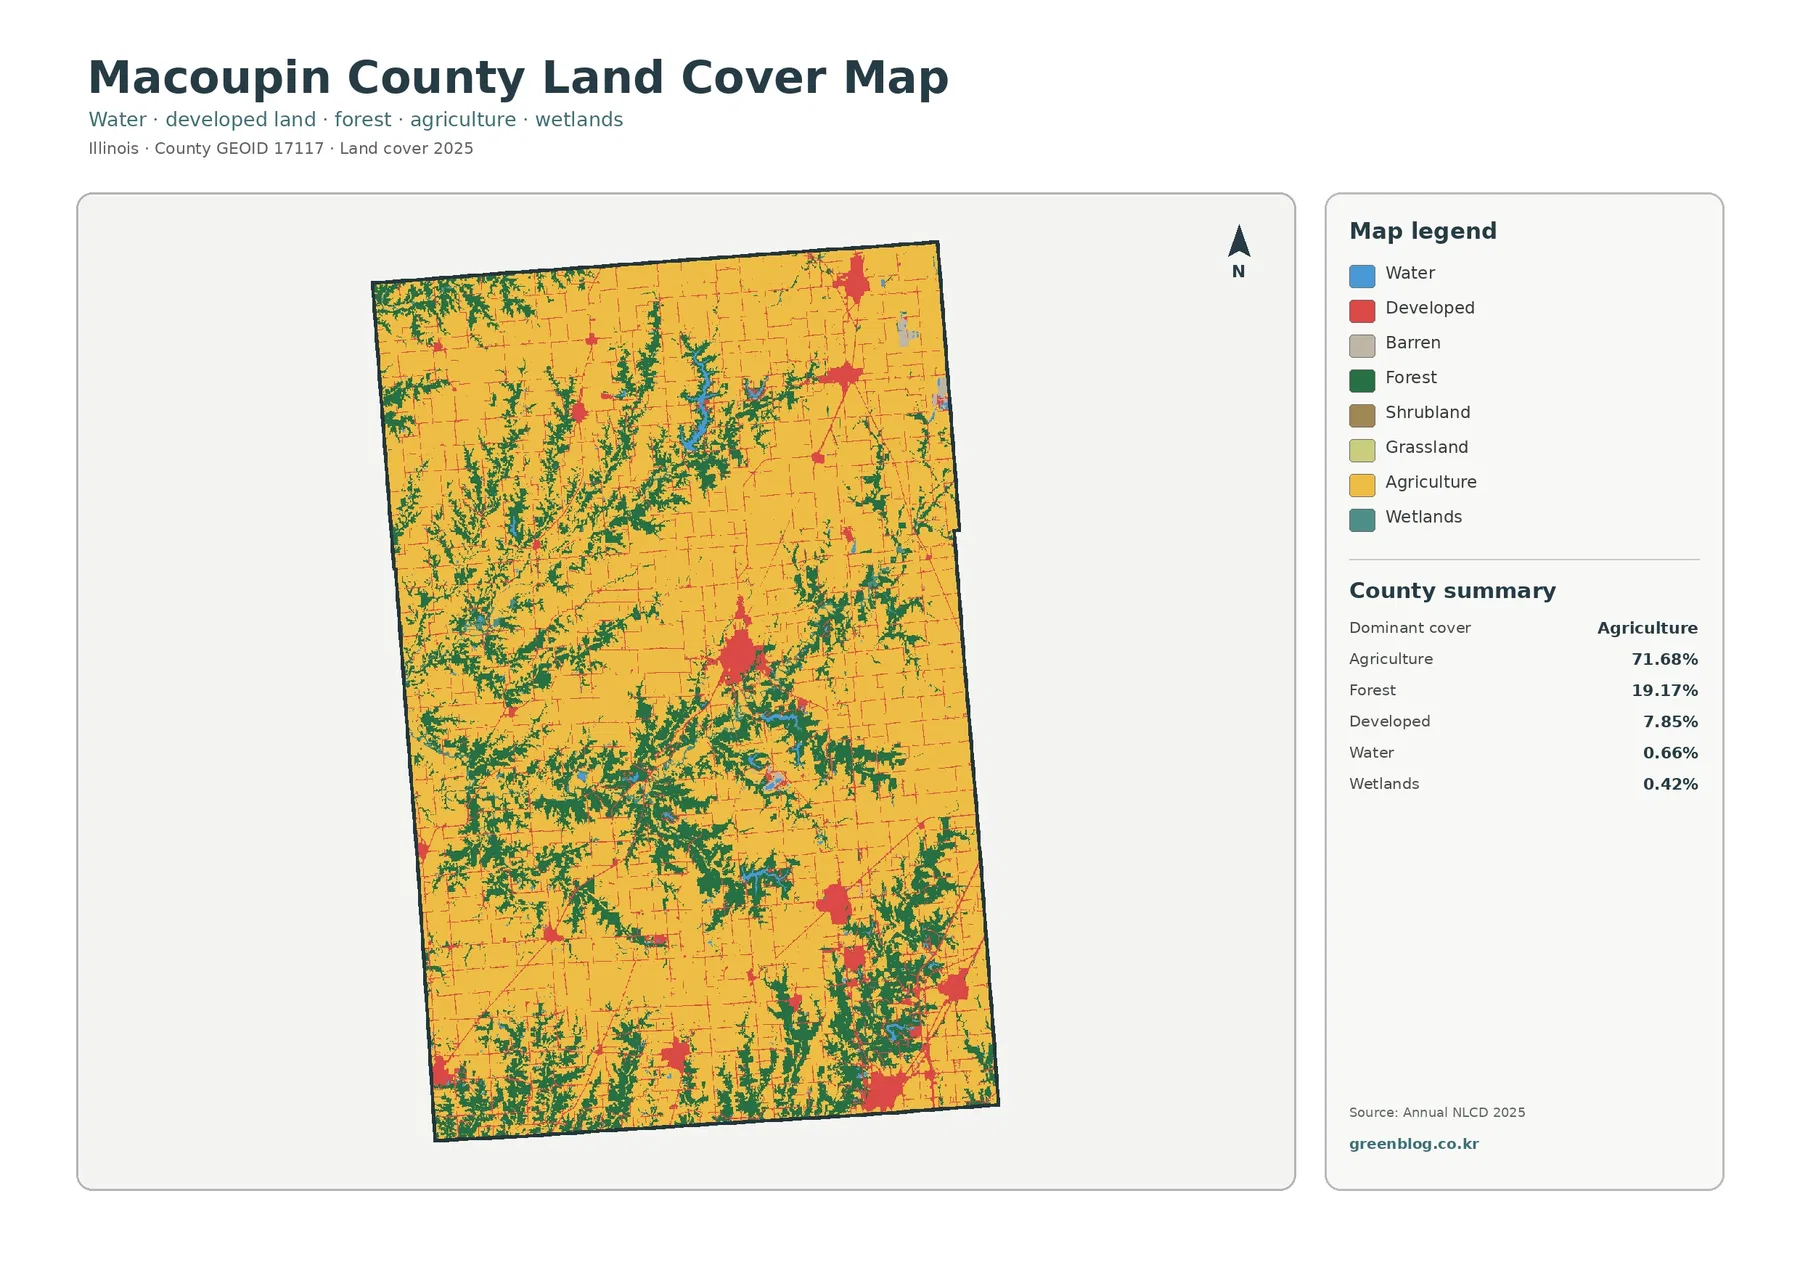
Adding the developed class changes the picture. Red developed land accounts for 7.85% and appears as a series of distinct clusters rather than one continuous urban belt. The largest central concentration lines up with Carlinville, the county seat identified by Macoupin County government. Additional developed groups appear toward the north and northeast and across the southern and southeastern portions of the county. Thin red lines connect many of these areas through an otherwise agricultural landscape. They are useful as signs of transportation and settlement structure, but the land-cover image does not label road names or municipal limits.
The general map is also the best place to see how forest, development, water, and wetlands meet in the same frame. In the western half, green wooded cover interrupts the yellow agricultural background much more often than the developed class does. Near the central developed cluster, red gives way quickly to a mixture of farms and wooded bands rather than to a broad suburban fringe. In the south, several developed centers sit close to a more fragmented mosaic of farm and forest. This combination is the reason a single countywide percentage cannot replace the map itself.
Water is 0.66% and wetlands 0.42%, so neither category dominates the county. Their small blue and teal patches are still valuable reference points because they often occur inside the more irregular natural-cover areas. Grassland and shrubland are even smaller in the map summary, at 0.05% and 0.01%. Describing Macoupin County as a grassland- or shrubland-led landscape would therefore overstate those classes. The useful county-scale story is a broad agricultural base, an unusually visible network of woodland for a farm county, and several separated developed centers.
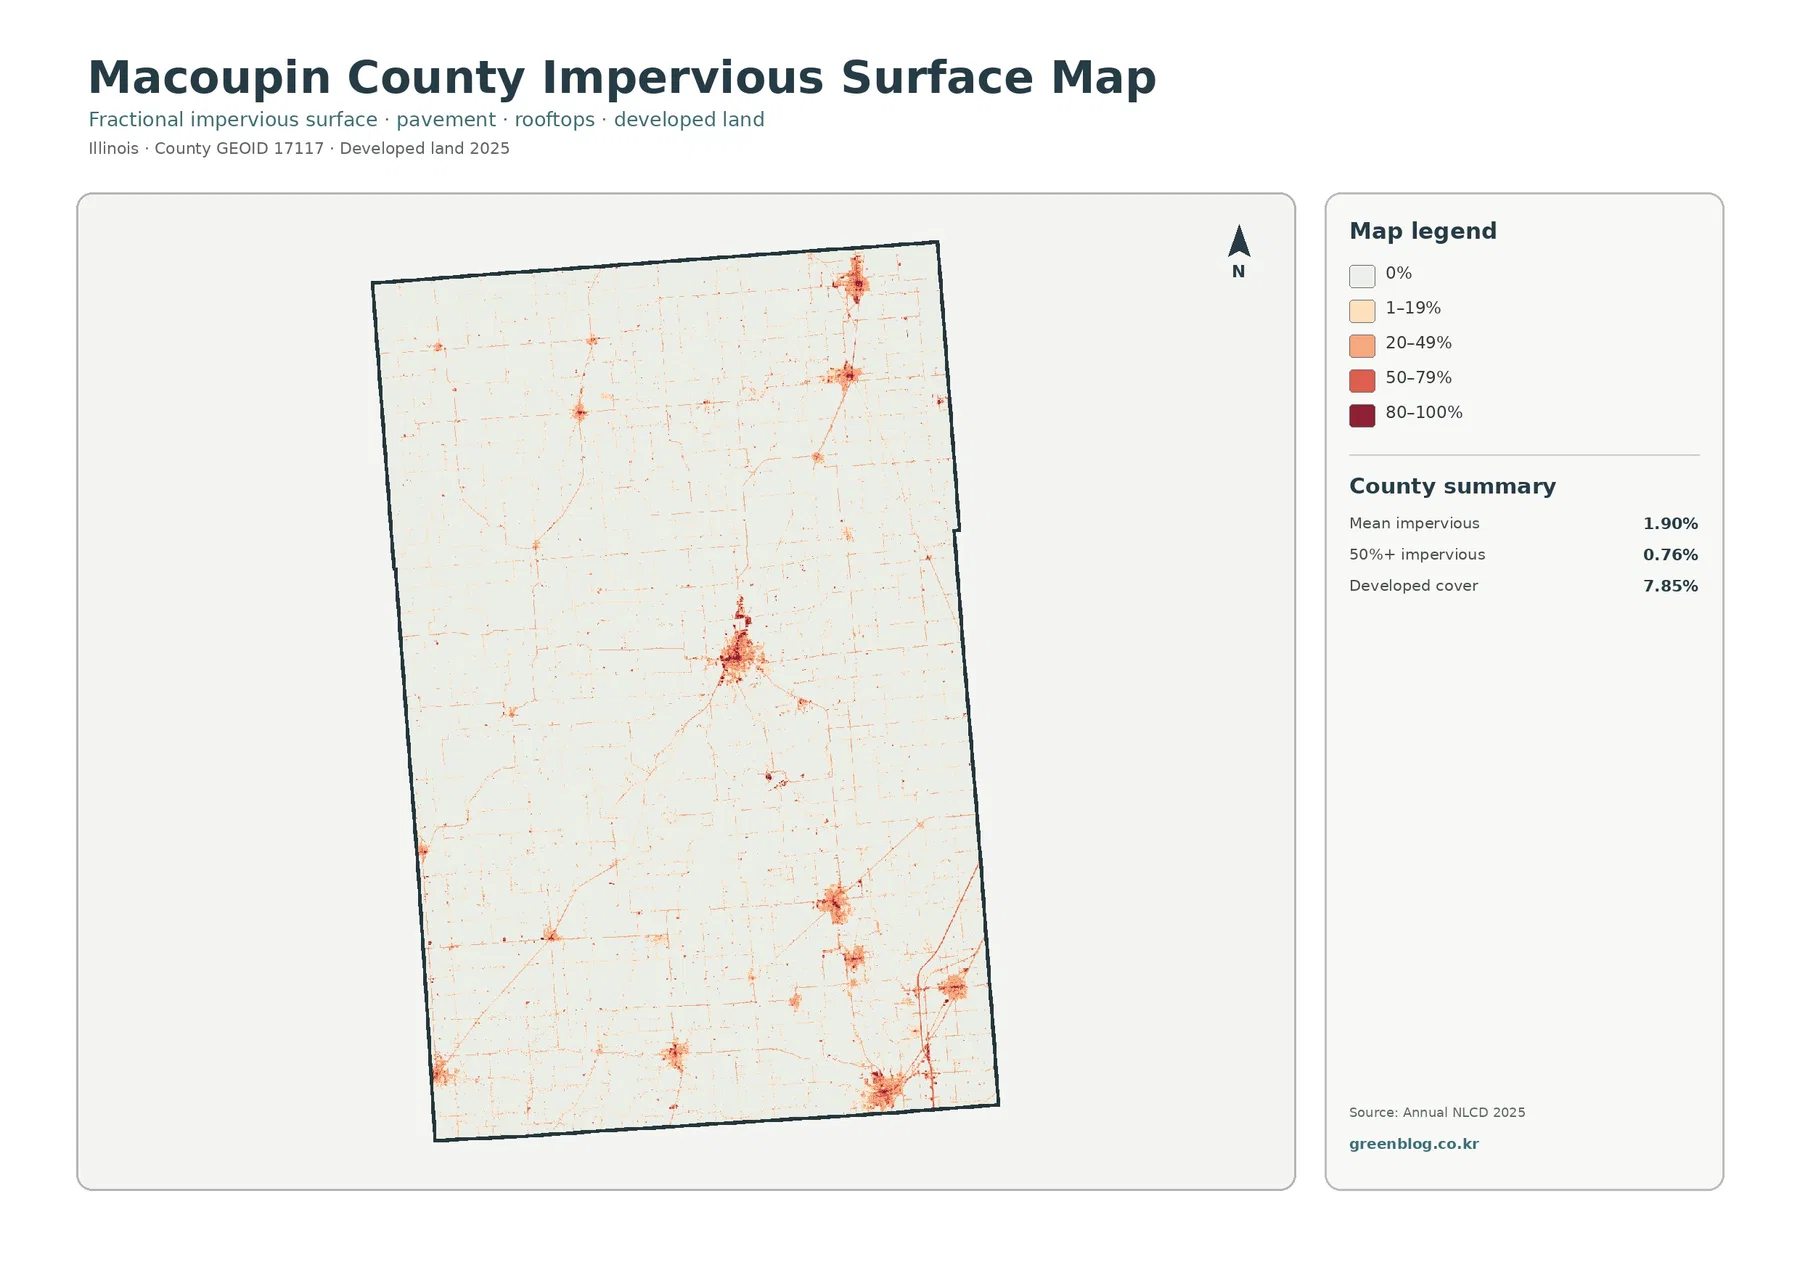
Carlinville stands out more clearly when development is measured as hard surface
The impervious-surface layer asks a different question from the developed land-cover class. It estimates the share of each 30-meter cell occupied by constructed surfaces such as pavement, concrete, rooftops, and similar materials. On this map, the central Carlinville-area cluster contains the strongest concentration of darker orange and red values. Smaller centers elsewhere in the county appear as isolated spots, while roads become fine lines crossing large pale areas. The result is much less visually filled than the 7.85% developed class on the general map.
Macoupin County’s mean impervious value is 1.90%, and only 0.76% of the county is in cells above 50% impervious. Those values are not supposed to match the 7.85% developed land-cover share. A developed cell can contain homes, streets, lawns, trees, and open ground at the same time. The categorical land-cover map assigns a developed class to the setting, while the fractional impervious product estimates how much of the cell is hard surface. That distinction is especially useful around the edge of Carlinville, where developed-class coverage continues into areas with much lower impervious percentages.
Macoupin County’s official site notes that historic Route 66 passes through the county, but this image is not a road map and does not label specific highways. A thin impervious line should therefore not be called Route 66, Illinois Route 4, or any other named road unless a transportation layer is used to verify it. The safe observation is that hard surfaces form a network linking multiple developed centers. For a report that needs actual road names, the impervious map works best as a background layer paired with an authoritative highway map.
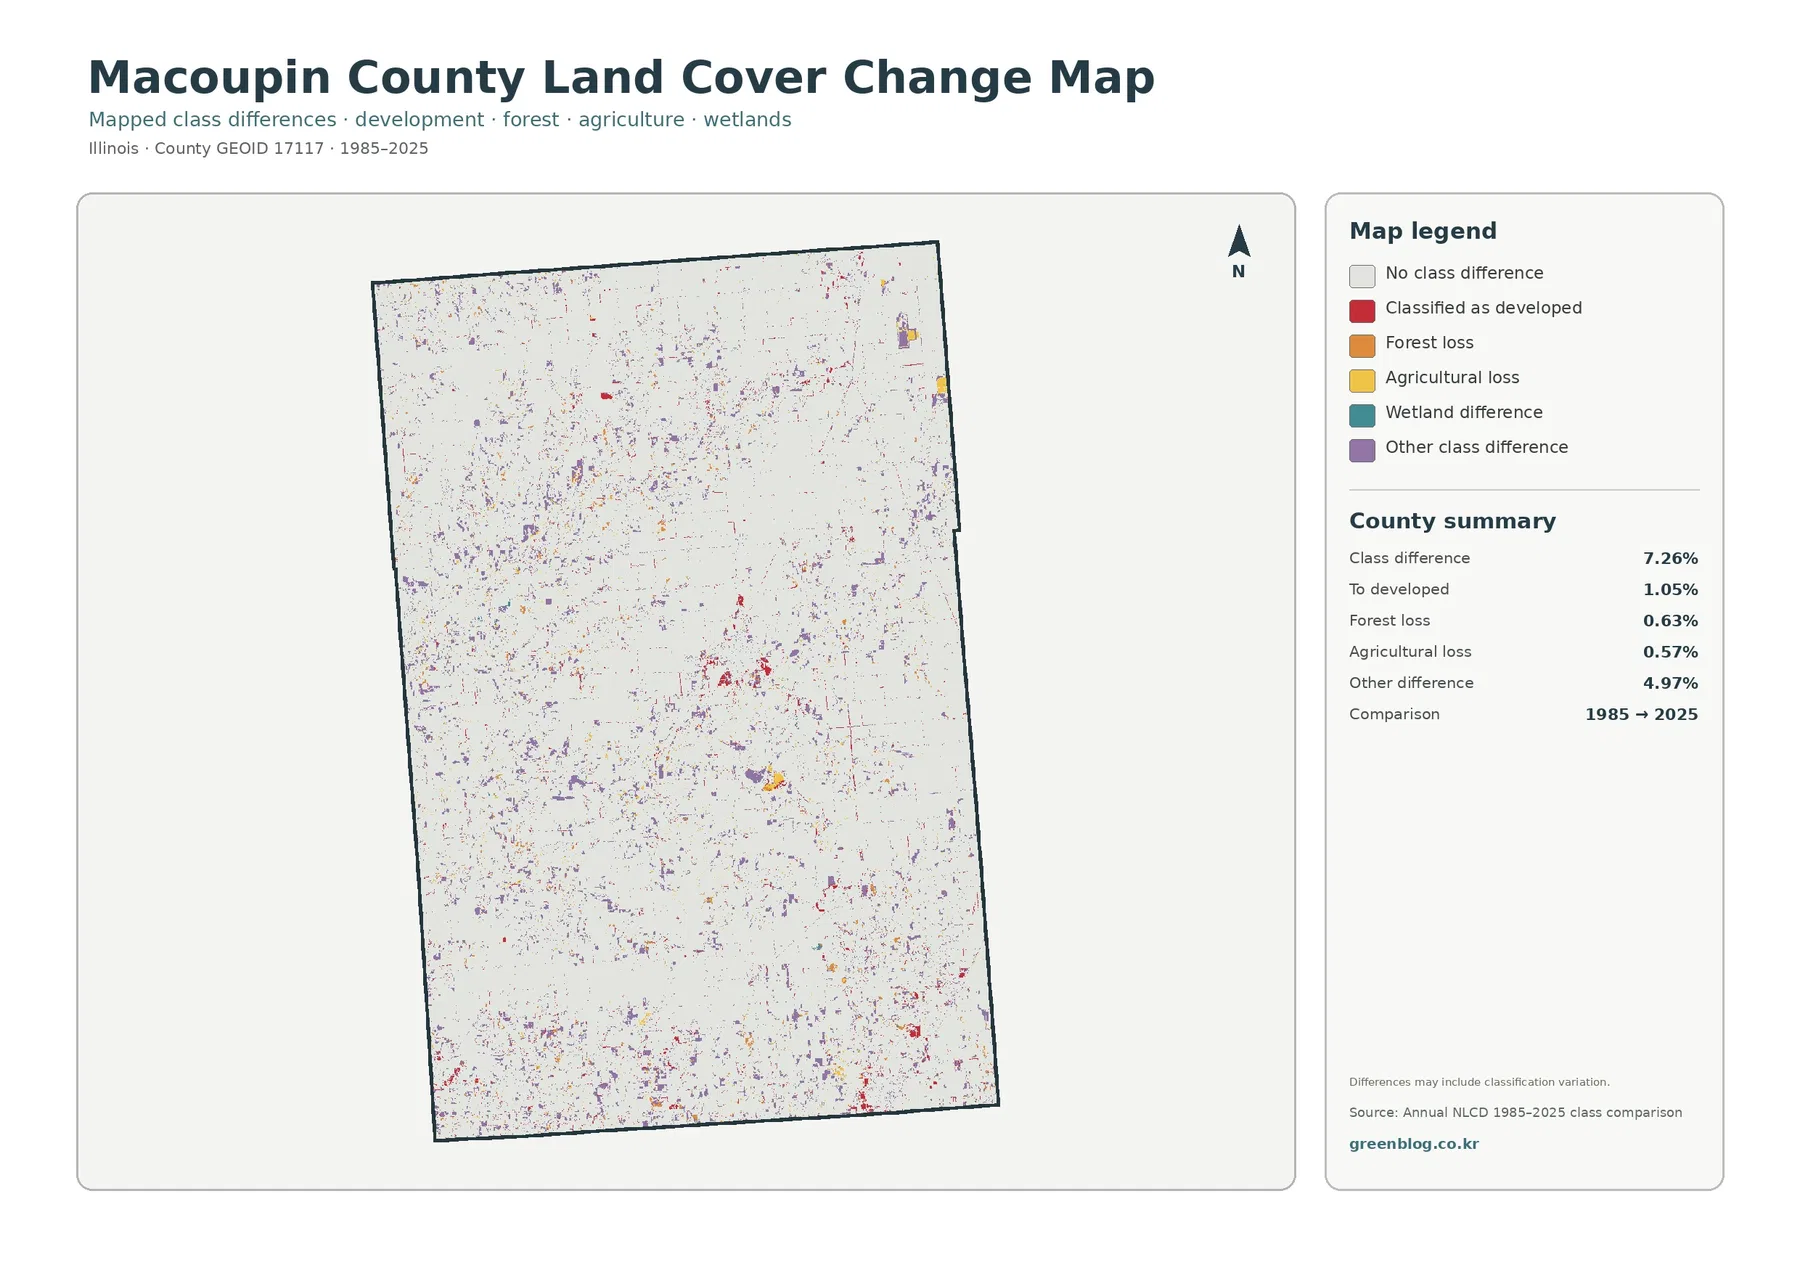
The 1985–2025 comparison totals 7.26%, but most of that is not a simple developed conversion
The change image is intentionally sparse compared with the current land-cover maps. Pale cells indicate no class difference between 1985 and 2025, and they cover most of Macoupin County. Colored cells are scattered across the west, center, north, and south rather than forming one large conversion zone. Red developed changes are somewhat easier to notice near settlement clusters, while purple other differences and smaller yellow or orange marks occur in many rural areas. The pattern suggests a large number of localized class differences rather than one countywide shift in a single direction.
The summary reports 7.26% total class difference. Of the listed categories, 1.05% is classified as a change to developed, 0.63% as forest loss, 0.57% as agricultural loss, and 4.97% as other class difference. That 4.97% figure is the largest component and is the main reason the 7.26% total cannot be described as urban growth. It also cannot be treated as a direct measure of farmland conversion or timber removal. Each color says that the mapped class differs between the two comparison years, not that the map has identified the cause.
The change map warns that classification variation may contribute to the differences. Annual NLCD is a raster product derived from satellite observations, so a 30-meter cell can contain more than one real surface. A shift in the dominant or assigned class can occur when the ground actually changes, but it can also reflect how a mixed cell is classified in different years. For that reason, this layer is best used to select places for follow-up work. Historical aerial photographs, local planning files, construction records, or field information are needed before a specific change is described as a documented land conversion.
Official agriculture records explain the farm setting without duplicating the land-cover measurement
Macoupin County government describes agriculture as the county’s primary industry and names corn, soybeans, and some wheat among the crops. That local description is consistent with the 71.68% agricultural land-cover share, but the two statements come from different kinds of evidence. Annual NLCD labels the predominant surface condition of raster cells in 2025. An industry description addresses economic and farming activity. A yellow agricultural cell does not identify a crop species, a farm operator, or whether the land is owned or rented.
The USDA 2022 Census of Agriculture county profile adds another useful perspective. It reports 1,235 farms and 458,695 acres of land in farms in Macoupin County, including 387,530 acres of cropland and 38,088 acres of woodland. Those figures should not be converted directly into the NLCD percentages. The census counts land associated with farms and classifies it through an agricultural survey, while NLCD maps the physical cover of 30-meter cells from remote-sensing data. The dates also differ. Used together, the sources show why farming is central to the county while still leaving room for a substantial wooded network.
This difference between land use and land cover matters in practical work. A wooded area inside a farm operation can be counted as woodland in an agricultural survey and also appear as forest in the satellite map, but the two systems are not guaranteed to draw the same boundary. A developed parcel can contain grass or trees, and an agricultural field can have a wooded drainage strip running through it. The map is strongest when the question is where surface types occur at county scale. Farm statistics are stronger when the question concerns agricultural operations, acreage, or production.
Cross-checking one location across all four views prevents common reading mistakes
Start with the central Carlinville area. On the full land-cover map it is a red developed cluster surrounded by farms and nearby wooded cover. Switch to the forest-and-farmland view and the town becomes visually quieter, making the surrounding yellow and green pattern easier to compare. The impervious layer then separates the hard-surface core from lower-density edges. Finally, the change map removes most of the current pattern and shows only cells whose 1985 and 2025 classes differ. Each image is correct for a different question, so conclusions improve when the same location is checked across them.
The western half provides another good example. Broad wooded networks are obvious in both the full map and the forest-focused map, while the impervious layer stays mostly pale except for roads and small settlements. The change layer adds scattered class differences but does not say that all those wooded corridors are shrinking. A current forest patch and a forest-loss cell are different pieces of information. Looking at only the change map could hide how much forest remains; looking only at the current map could hide where the two time points disagree.
In the more agricultural north and east, the same comparison works in reverse. Large crop blocks dominate the current maps, and the impervious product is generally low away from built-up centers. Yet the change layer still contains small colored cells in some locations. A quiet change map does not mean farming has been inactive, and a busy patch of class differences does not automatically indicate development pressure. The two-date layer is a classification comparison, not a history of every crop rotation, management decision, drainage change, or construction project that occurred during the forty-year interval.
Thirty-meter cells work well for county context, not parcel-level decisions
USGS describes Annual NLCD as a Landsat-derived raster product at 30-meter spatial resolution. A raster is a grid, and every cell summarizes a small square area. One cell can contain a field edge, trees, a road shoulder, a yard, and part of a building at the same time. The displayed class is therefore not a legal boundary. Narrow water features, hedgerows, small ponds, and thin roads may look wider, narrower, or less continuous than they would on high-resolution aerial photography.
Scale also affects how the impervious percentages should be read. A cell in the 20–49% class is not entirely paved; it contains that approximate share of constructed hard surface. Developed neighborhoods can therefore remain visible on the categorical map even when many of their cells have modest impervious values. This is why the countywide mean of 1.90% and the developed land-cover share of 7.85% can both be correct. They summarize different properties of the same landscape.
The dates define another limit. The current maps use the 2025 data shown on the page, while the change image compares 1985 with 2025. It does not identify the exact year of a change, and it cannot show whether a cell changed more than once between the endpoints. Recent work after the 2025 observation period will also be absent. When a decision depends on current parcel conditions, recent aerial imagery and local records should take priority over a county-scale land-cover map.
Pick the JPG that matches the question, then keep the set together for comparison
Use the general land-cover JPG when you need one image that introduces Macoupin County’s agricultural, forested, developed, water, and wetland classes together. Choose the forest-and-farmland version when the branching woodland pattern is the main subject. The impervious map is the better file for examining Carlinville, other town centers, roads, rooftops, and pavement intensity. The change map belongs in work that asks where the 1985 and 2025 classifications differ, provided the result is described as a mapped class difference rather than a proven cause of change.
The downloadable JPG maps are 2480 × 1754 pixels. If you plan to enlarge them for an A3-size sheet or another large print, check the output quality first. They are well suited to screen reference, web use, classroom material, report figures, and ordinary prints that match the available pixel dimensions. Keeping all four files together makes it easier to compare the same part of the county without confusing current cover, forest emphasis, impervious percentage, and historical class difference.
Frequently Asked Questions
Why does forest look so prominent when agriculture covers 71.68% of Macoupin County?
Forest is still the second-largest mapped class at 19.17%, and it is distributed in long, irregular bands rather than a single compact block. Those branching shapes create many visible boundaries against broad agricultural fields, especially in the west, center, and south. The forest-and-farmland map makes this contrast easiest to see because developed areas are simplified and the yellow-green relationship becomes the main visual feature.
Why is developed land 7.85% while mean impervious surface is only 1.90%?
The measures describe different things. Developed land is a categorical land-cover class and can include lawns, trees, bare ground, and other permeable surfaces mixed with buildings and streets. Fractional impervious surface estimates the share of each 30-meter cell covered by hard constructed materials. A neighborhood can therefore be classified as developed without being mostly pavement or rooftops.
Does the 7.26% class difference mean that 7.26% of the county was physically converted after 1985?
No. The figure identifies cells whose mapped classes differ between 1985 and 2025. The map itself warns that classification variation may be included, and 4.97% of the county falls in the broad “other class difference” category. Confirming an actual conversion, its date, and its cause requires additional evidence such as historical aerial imagery, parcel records, or local planning and permit documents.
Sources and Reference Material
Percentages and mapped differences in this article come from the Annual NLCD-based map summaries shown on this page. The official links below provide classification guidance, resolution details, boundary data, and county-specific agricultural context.
- MRLC Annual NLCD Data – access to Annual NLCD products, including the 2025 release
- USGS Annual NLCD Land Cover Classification – class definitions and interpretation guidance
- USGS Annual NLCD Spatial Resolution – official explanation of the 30-meter raster resolution
- U.S. Census Bureau TIGER/Line Shapefiles – county boundaries and geographic reference data
- Macoupin County Official Website – county seat, local industry, Route 66, and county information
- USDA 2022 Census of Agriculture – Macoupin County Profile – farm, cropland, and woodland statistics
Map File Information
The ZIP contains four original JPG maps for Macoupin County: general land cover, forest and farmland, impervious surface and developed land, and mapped land-cover class differences from 1985 to 2025.
- Included Versions: Land cover / Forest & farmland / Impervious & developed land / Land-cover change
- File Type: ZIP containing four JPG maps
Related Maps
- Adams County Illinois Land Cover Map
- Alexander County Illinois Land Cover Map
- Bond County Illinois Land Cover Map
Green Map creates custom-edited map images using open geographic data sources such as geoBoundaries, Natural Earth, OpenStreetMap, and government open data. These maps are edited visual materials, not raw data files, and are provided for education, documents, presentations, and graphic reference.