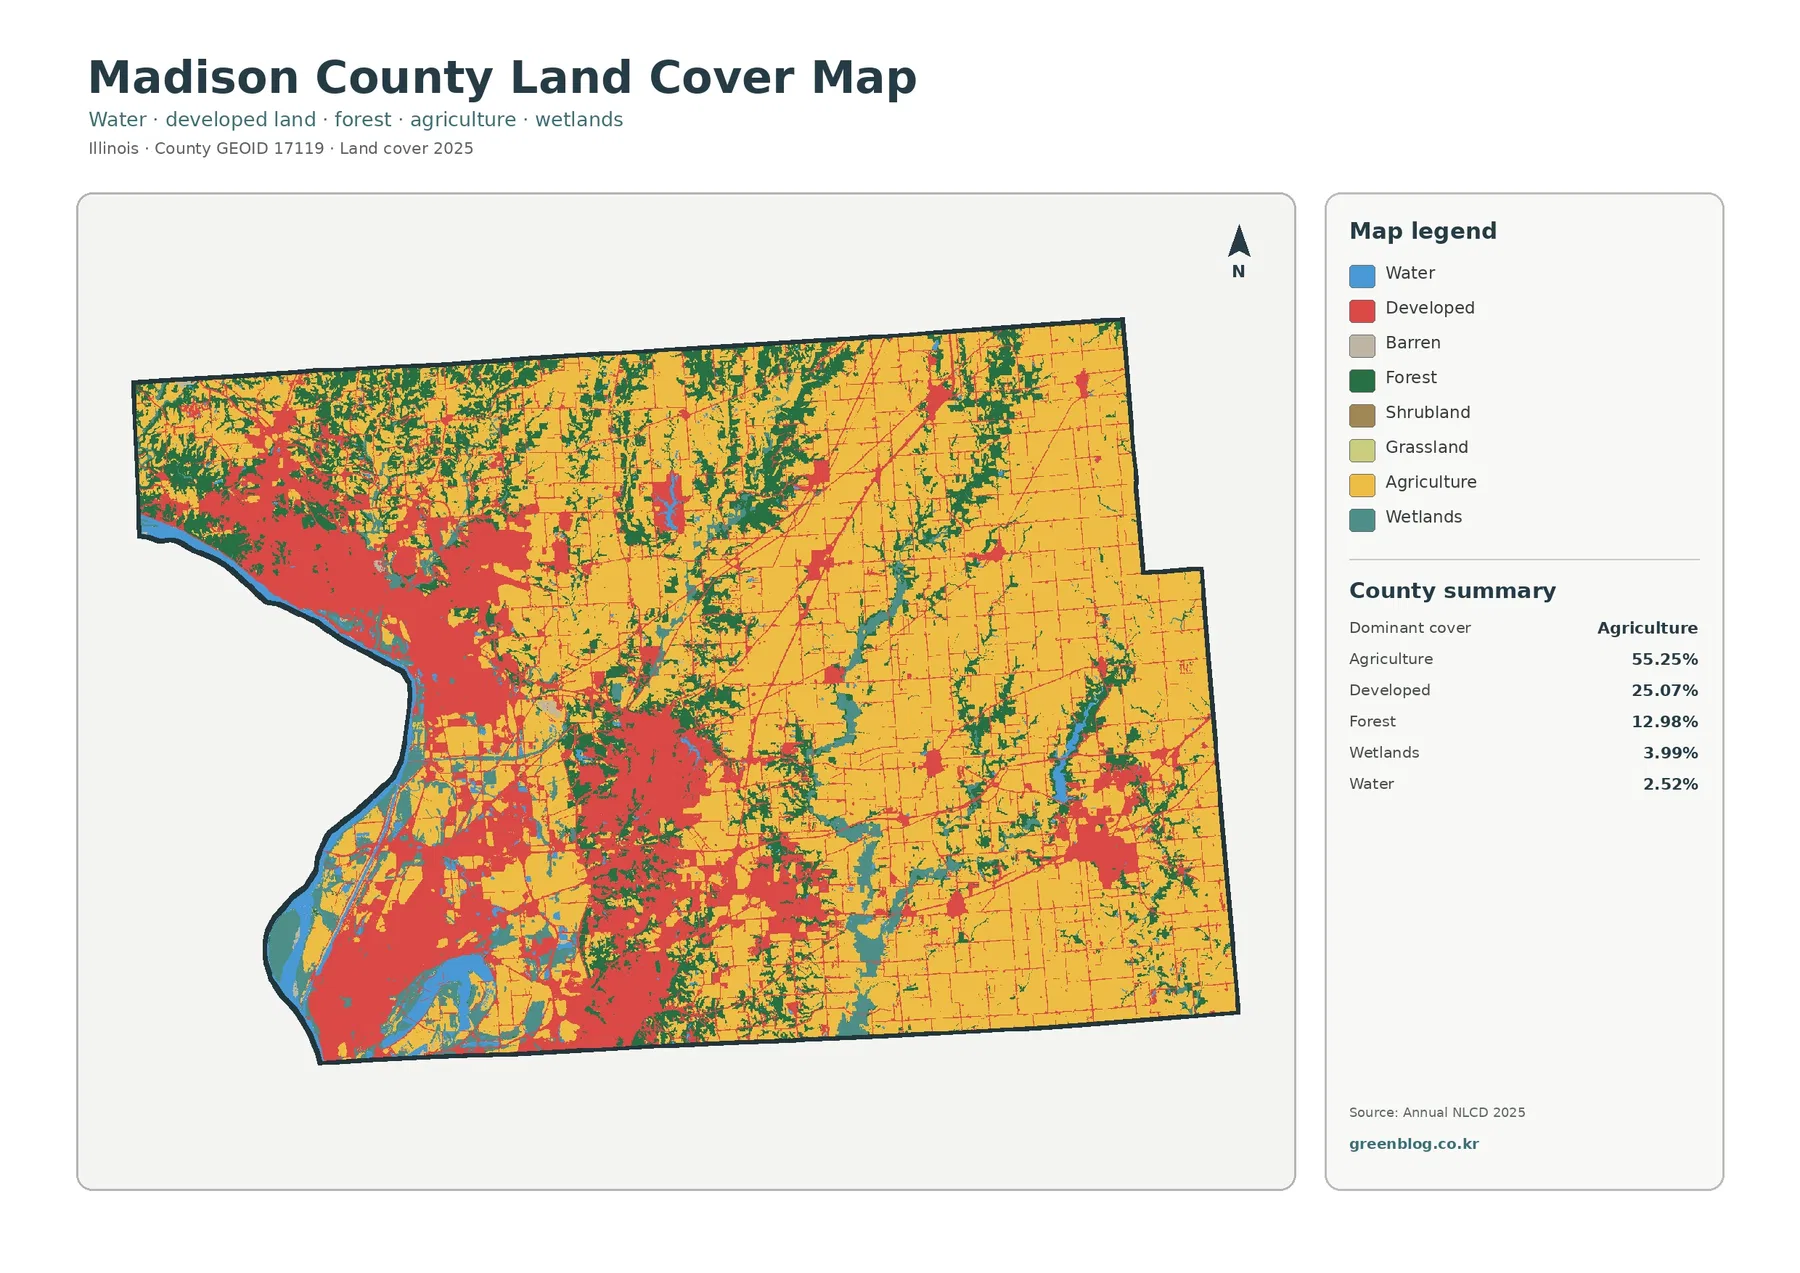
Madison County has one of the clearest urban-to-rural contrasts in this Illinois map series. Agriculture is still the largest 2025 land-cover group at 55.25%, yet a broad developed belt occupies much of the western and southwestern side of the county. Farther east, large farm blocks become the dominant pattern, while forest, wetlands, and water trace irregular bands through the agricultural interior. The four maps on this page separate those patterns into general land cover, forest and farmland, fractional impervious surface, and mapped class differences from 1985 to 2025.
The four original JPG maps are available together in one download. Use the general map for the complete county mix, the forest-and-farmland version for a simpler view of green and agricultural cover, the impervious map for hard-surface intensity around developed areas, and the change map for cells whose classes differ between the two endpoint years. Land cover describes what is physically covering the ground in the source classification; it should not be read as zoning, ownership, parcel boundaries, legal land use, or development permission.
Table of Contents
A 55.25% agricultural county with a 25.07% developed western side
The current land-cover map is dominated by two colors that occupy very different parts of Madison County. Yellow agricultural cover spreads across much of the eastern half and remains common in the north-central interior. Red developed land expands across the west and southwest, with additional built-up clusters in the county interior and smaller points toward the east. This is not a county where development is simply a small town surrounded by uniform cropland. The western side forms a much broader developed landscape, while the eastern side retains the large field pattern associated with the county’s agricultural share.
Forest accounts for 12.98% of the mapped area. Its shape matters as much as its percentage: green cover appears in branching strips and irregular patches through the north, center, and south rather than in one isolated forest block. Wetlands add 3.99% and open water 2.52%. Along the western edge, water and wetland colors create a sinuous margin next to developed land, while smaller wet features also occur farther inland. Those narrow shapes can be visually prominent even though their countywide shares are much smaller than agriculture or development.
A Madison County Community Development document describes the county as being in southwestern Illinois on the east side of the Mississippi River and within the Metro-East portion of the St. Louis metropolitan area. The same county source characterizes the west as containing older industrial urban areas and the east as more semi-rural and agricultural. That local description helps explain why the mapped split is so strong. It does not turn the land-cover classes into industrial, residential, or zoning categories, but it provides useful geographic context for the broad west-east pattern visible in the image.
Farm blocks are broad in the east, but wooded and wet corridors break up the interior
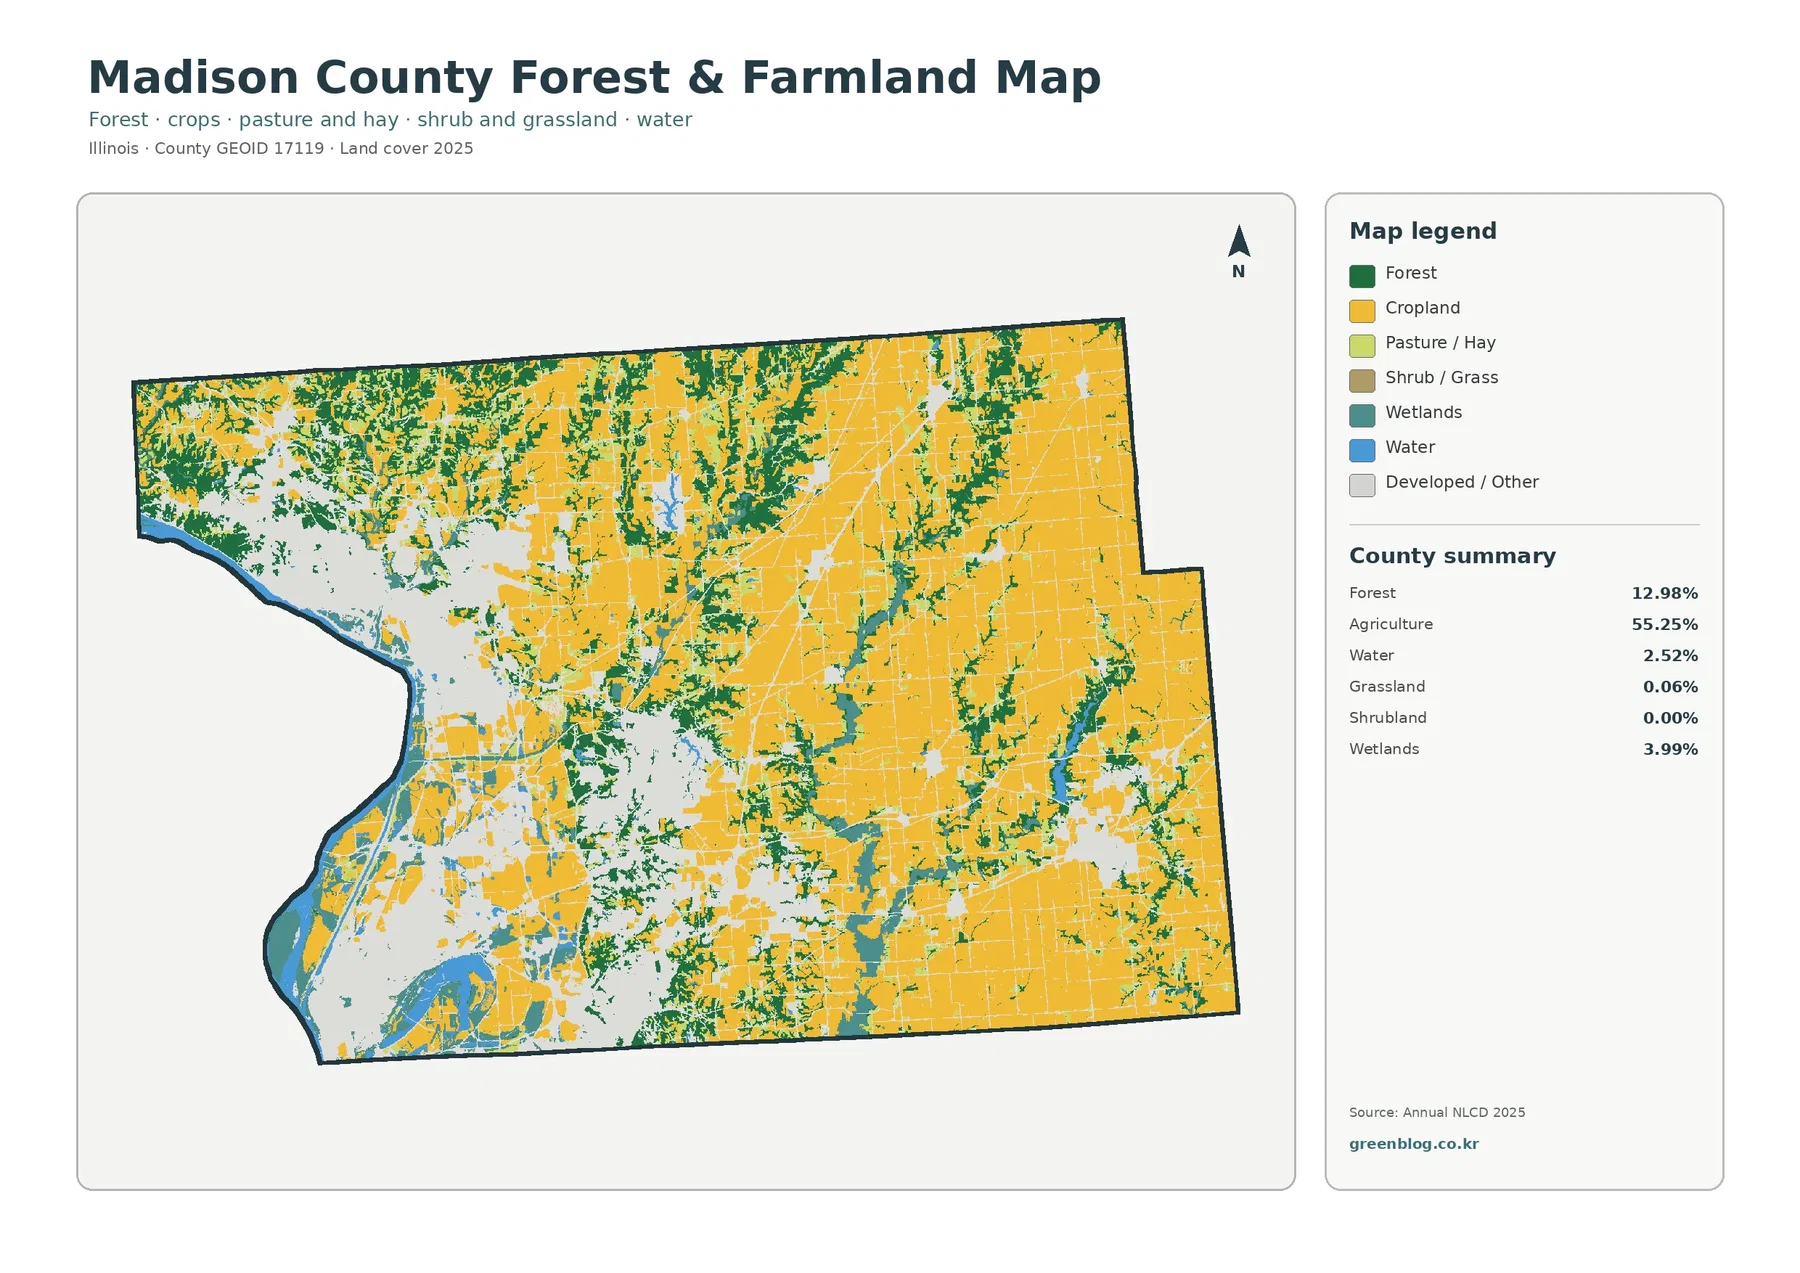
The forest-and-farmland map removes much of the visual competition from developed classes, making the agricultural structure easier to see. Cropland forms large connected areas across the east and northeast, and it remains extensive through central parts of the county. Forest does not follow the same straight-edged geometry. It bends through field areas in narrow and medium-width bands, widens into patches in several central and northern locations, and reappears along parts of the southern interior. The contrast between rectilinear farm blocks and irregular woodland is one of the most useful features of this simplified map.
Water and wetlands become especially important near the western margin. The open-water class forms the county’s obvious river-side edge, and wetland colors occupy adjoining low-lying shapes as well as smaller interior areas. The map cannot identify a wetland’s legal status or tell whether a water feature is permanent throughout the year. It simply reports the mapped surface class for the source data. Still, the combination of water, wetlands, forest, and developed cover along the west creates a landscape that is very different from the broad agricultural blocks farther east.
The 55.25% agriculture figure should also be kept separate from farm ownership or crop statistics. A land-cover class is assigned from remotely sensed characteristics, not from deeds or tax records. Likewise, a green forest cell does not mean the land is public, protected, or managed as a forest preserve. For county-scale comparison, the map is useful because it places agricultural and wooded surfaces in a consistent classification. For decisions about a particular tract, local records and current imagery are the better sources.
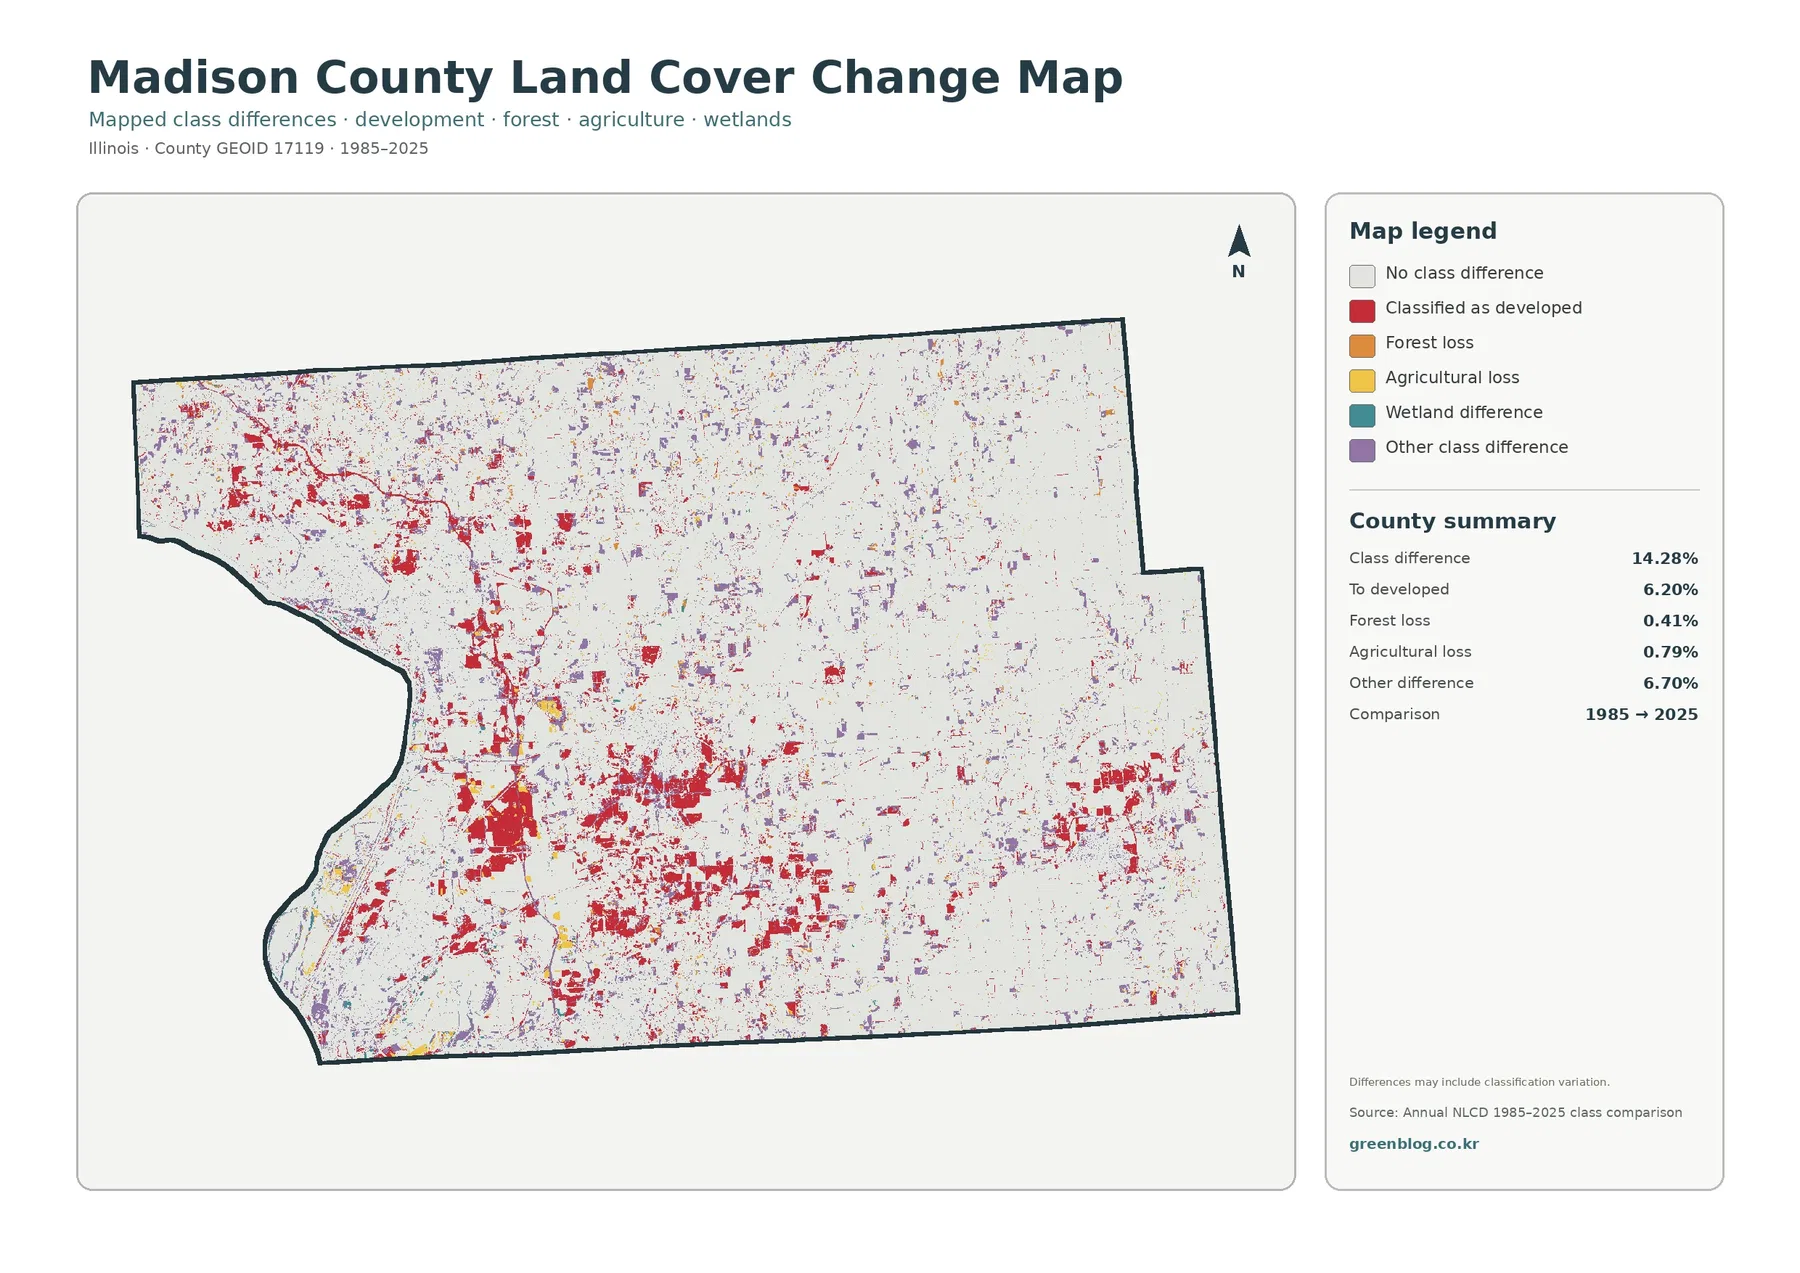
The 1985–2025 change layer highlights developed conversion without reducing every difference to growth
The change map has a different purpose from the current land-cover image. Most cells remain in the pale no-difference background, while colored cells mark locations where the 1985 and 2025 classifications are not the same. Red indicates cells classified as developed in the later map. These red areas are most concentrated through the western and southwestern developed belt and around several interior clusters. Smaller red patches also appear around settlements farther east. The distribution is consistent with a county where built cover is not confined to one center.
The county summary reports a 14.28% overall class difference. Of that total, 6.20% is in the “to developed” category, 0.41% is forest loss, 0.79% is agricultural loss, and 6.70% is other class difference. The last category is slightly larger than the mapped developed conversion, which is an important warning against calling the entire 14.28% figure urban growth. The change layer combines several kinds of endpoint differences, and its legend also notes that classification variation may be included.
A two-date comparison cannot show when a cell changed within the forty-year span or whether it changed more than once. It also does not identify a cause. A red cluster can flag an area worth checking against historical aerial photographs, planning records, or road and parcel data, but the map alone cannot establish the timing of construction or the decision that produced it. Treating the layer as a screening view rather than a complete development history preserves what the source actually supports.
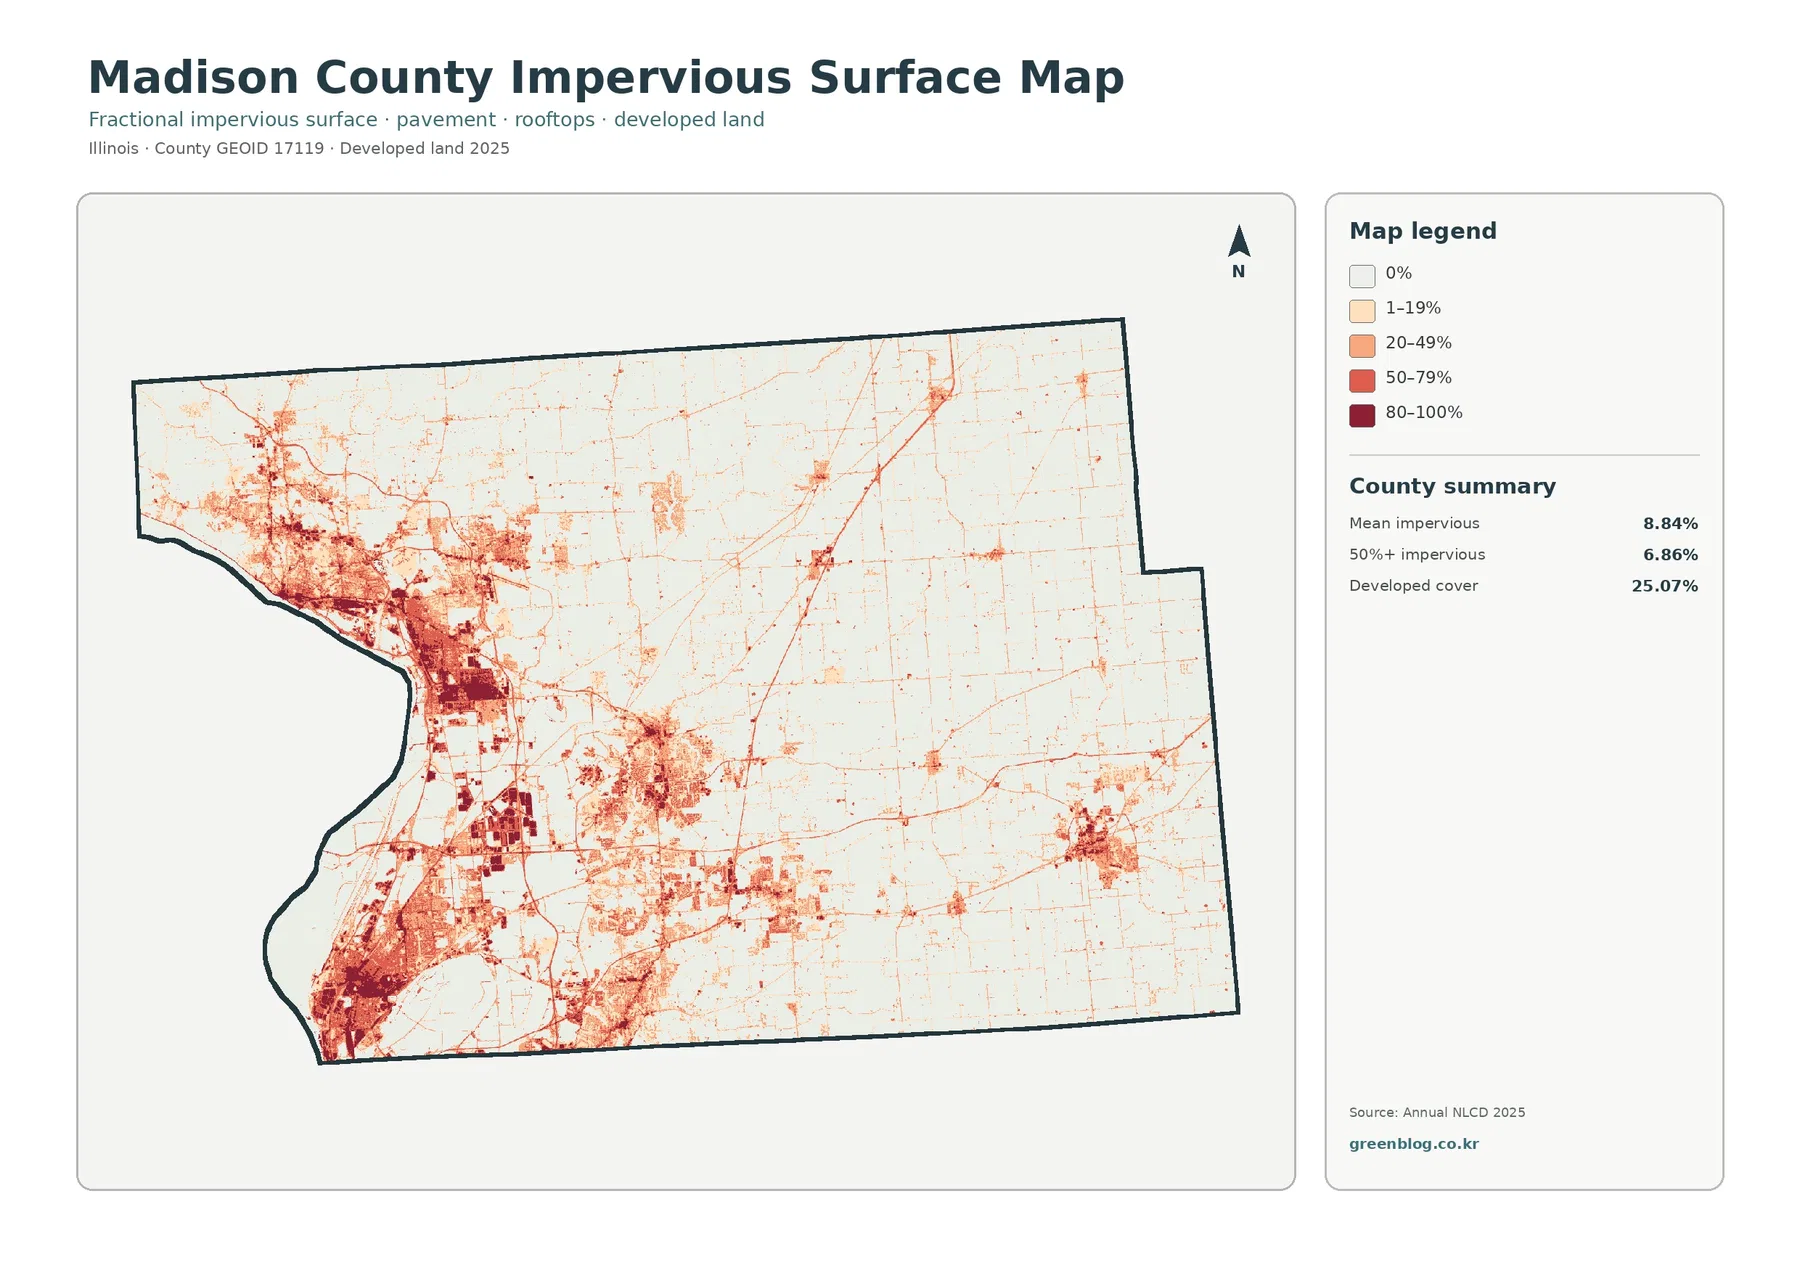
Impervious intensity separates the western urban belt from lower-density edges and rural roads
Fractional impervious surface measures the share of each grid cell covered by hard constructed material such as pavement and rooftops. Madison County’s mean is 8.84%, and 6.86% of the county is mapped in cells above 50% impervious. The darkest classes are concentrated on the western and southwestern side, where the current map already shows the largest developed areas. Instead of a single solid urban color, this layer reveals dense cores, lower-intensity edges, road-like lines, and separate built clusters.
The 25.07% developed land-cover share is much larger than the 8.84% mean impervious value because the measures are not interchangeable. A developed-class cell can contain lawns, trees, soil, drainage areas, and other permeable surfaces along with buildings and streets. The impervious product estimates the hard-surface fraction inside the cell. That distinction is especially useful around residential areas, where a neighborhood may be clearly developed but not mostly pavement when averaged at a 30-meter scale.
Farther east, the map becomes much paler. Thin lines and small nodes still trace roads and settlements, but they sit inside a predominantly low-impervious agricultural landscape. The contrast makes the layer useful for locating where built surfaces are concentrated before checking more detailed information. It should not be used to determine road ownership, drainage design, parcel boundaries, or exact roof area. Those questions require local GIS or engineering data at a finer scale.
Local planning sources reinforce the river-edge urban and interior watershed context
County planning material identifies Madison County’s western side with the Mississippi River and the Metro-East urban region. It also names places such as Alton and Granite City among older river-side urban communities, while Edwardsville, Glen Carbon, and Collinsville are discussed as central communities with urban characteristics. The land-cover maps do not label those municipal boundaries, so the safest use of the names is as orientation rather than exact class attribution. They help explain why the west and center contain more extensive developed and impervious patterns than the agricultural east.
Watershed planning provides a second piece of context. Madison County’s Indian-Cahokia Creek watershed plan discusses streams, lakes, ponds, sinkholes, and wetlands as features considered in local stormwater and development rules. That does not mean every teal or blue pixel on the map falls under a specific regulation. It does show why the county’s narrow wetland and water features matter beyond their modest percentages. On the land-cover maps, these features often occupy the same broad parts of the landscape where wooded corridors and developed areas meet.
The University of Illinois Extension also serves Madison County with agriculture and natural-resources programming. That local service context is useful because the map itself shows both a large agricultural base and a substantial urbanized portion. A county-scale land-cover page cannot replace crop surveys, forestry inventories, or water-quality monitoring, but it can provide a common visual reference before moving into those topic-specific sources.
Cross-check the same place before drawing a conclusion from one color
Start with the western urban belt. The general map identifies it as developed land mixed with water, wetlands, forest, and smaller agricultural areas. The impervious layer then separates the hardest-surfaced cores from lower-density developed edges. The forest-and-farmland version removes much of the urban detail and makes the river-side natural cover easier to see. The change map answers a different question again by retaining only cells whose endpoint classes differ. Looking at all four prevents current development from being confused with historical conversion.
The eastern side benefits from the same method. The general map shows large agricultural areas with smaller forest, wetland, water, and developed components. The simplified forest-and-farmland view emphasizes the geometry of farm blocks and the irregular woodland corridors between them. Impervious values remain low across most of this landscape except for roads and settlement nodes. The change map may still contain scattered colored cells, but those cells do not imply that farming stopped or that every difference represents development.
This sequence is useful for classroom figures, regional comparisons, web illustrations, and preliminary research. The general map explains the complete mix, the forest map clarifies natural and agricultural cover, the impervious map adds built-surface intensity, and the change map supplies a two-date comparison. Keeping those roles separate produces clearer captions and reduces the risk of turning a visual association into an unsupported cause-and-effect claim.
Thirty-meter raster cells show county patterns, not survey-grade boundaries
Annual NLCD is a Landsat-based raster product with 30-meter spatial resolution. A raster divides the landscape into square cells, and each cell summarizes a small area. At field edges, stream banks, neighborhoods, and road corridors, one cell can contain several real surfaces at once. The displayed class is therefore a generalized representation. Narrow tree lines, small ponds, road medians, and wet strips may appear wider, narrower, fragmented, or merged compared with high-resolution aerial imagery.
The source year also sets a limit. The current maps represent the 2025 classification used in this package, and the change view compares 1985 with 2025. Construction, clearing, flooding, restoration, or other changes after the 2025 observation period are not shown. A cell that changed twice between 1985 and 2025 may also end with the same class it had at the start and therefore appear as no endpoint difference. For current parcel-level work, recent local GIS and aerial imagery should take priority.
Finally, the maps do not encode legal boundaries beyond the county outline used for clipping the data. A forest class is not a conservation designation, agricultural cover is not an agricultural zoning district, and a developed class is not proof that a parcel can be built upon. Madison County’s own planning and stormwater rules are separate sources. The land-cover set is most effective as a visual starting point that helps users decide where more detailed records are needed.
Choose one JPG for the main question and keep all four for verification
The general land-cover JPG is the best single file for showing Madison County’s west-east contrast and the relative presence of agriculture, developed land, forest, wetlands, and water. Use the forest-and-farmland file when crop blocks and wooded corridors are the main subject. The impervious map is better when the western urban belt, roads, rooftops, and hard-surface intensity matter. Use the change map only for the 1985–2025 endpoint comparison, with the classification caution kept in the caption or surrounding text.
Each downloadable JPG is 2480 × 1754 pixels. The files are practical for screen reference, web use, classroom material, report figures, and ordinary printing within the available pixel dimensions. The source manifest does not mark them as meeting an A3 high-resolution reference, so check output quality before enlarging them for a large poster. Storing the four files together makes it easy to revisit the same location without confusing current cover, agricultural and forest emphasis, impervious intensity, and mapped historical class difference.
Frequently Asked Questions
Why does western Madison County look so developed if agriculture is the largest countywide class?
Agriculture has the largest total share at 55.25%, but much of it is concentrated in broad eastern and interior blocks. Developed land, at 25.07%, is more clustered in the west and southwest, so it forms a visually strong continuous belt. County planning material also describes an urban and industrial west and a more semi-rural, agricultural east. The map supports that broad contrast without assigning legal land uses to individual cells.
Why is mean impervious surface 8.84% when developed land covers 25.07%?
Developed land is a categorical land-cover class that can include trees, lawns, soil, drainage areas, and other permeable surfaces mixed with buildings and streets. Fractional impervious surface estimates the hard-surface share inside each 30-meter cell. A neighborhood can therefore be mapped as developed even when most of its individual cells are not dominated by pavement and rooftops.
Does the 14.28% class difference mean 14.28% of Madison County was physically transformed after 1985?
No. The 14.28% figure totals cells whose mapped classes differ between 1985 and 2025. Only 6.20% is specifically categorized as “to developed,” while 6.70% is other class difference and smaller shares are mapped as forest or agricultural loss. The source also warns that classification variation may be included. Historical imagery and local records are needed to verify the actual change, date, and cause at a specific location.
Sources and Reference Material
Percentages and mapped differences in this article come from the Annual NLCD-based summaries printed on the four Madison County maps in this package. The official links below provide the land-cover classification framework, county boundary reference, local planning context, watershed information, and regional agriculture and natural-resources resources.
- MRLC Annual NLCD Data – access to Annual NLCD products and yearly land-cover data
- USGS Annual NLCD Land Cover Classification – official class definitions and interpretation guidance
- U.S. Census Bureau TIGER/Line Shapefiles – county boundaries and geographic reference data
- Madison County Community Development – county context for the Mississippi River, Metro-East, western urban areas, and eastern agricultural areas
- Madison County Indian-Cahokia Creek Watershed Plan – local stormwater, water-feature, wetland, and development planning context
- University of Illinois Extension – Madison, Monroe and St. Clair Counties – local agriculture and natural-resources programs
Map File Information
The ZIP contains four original JPG maps for Madison County: general land cover, forest and farmland, impervious surface and developed land, and mapped land-cover class differences from 1985 to 2025.
- Included Versions: Land cover / Forest & farmland / Impervious & developed land / Land-cover change
- File Type: ZIP containing four JPG maps
Related Maps
- Adams County Illinois Land Cover Map
- Alexander County Illinois Land Cover Map
- Bond County Illinois Land Cover Map
Green Map creates custom-edited map images using open geographic data sources such as geoBoundaries, Natural Earth, OpenStreetMap, and government open data. These maps are edited visual materials, not raw data files, and are provided for education, documents, presentations, and graphic reference.