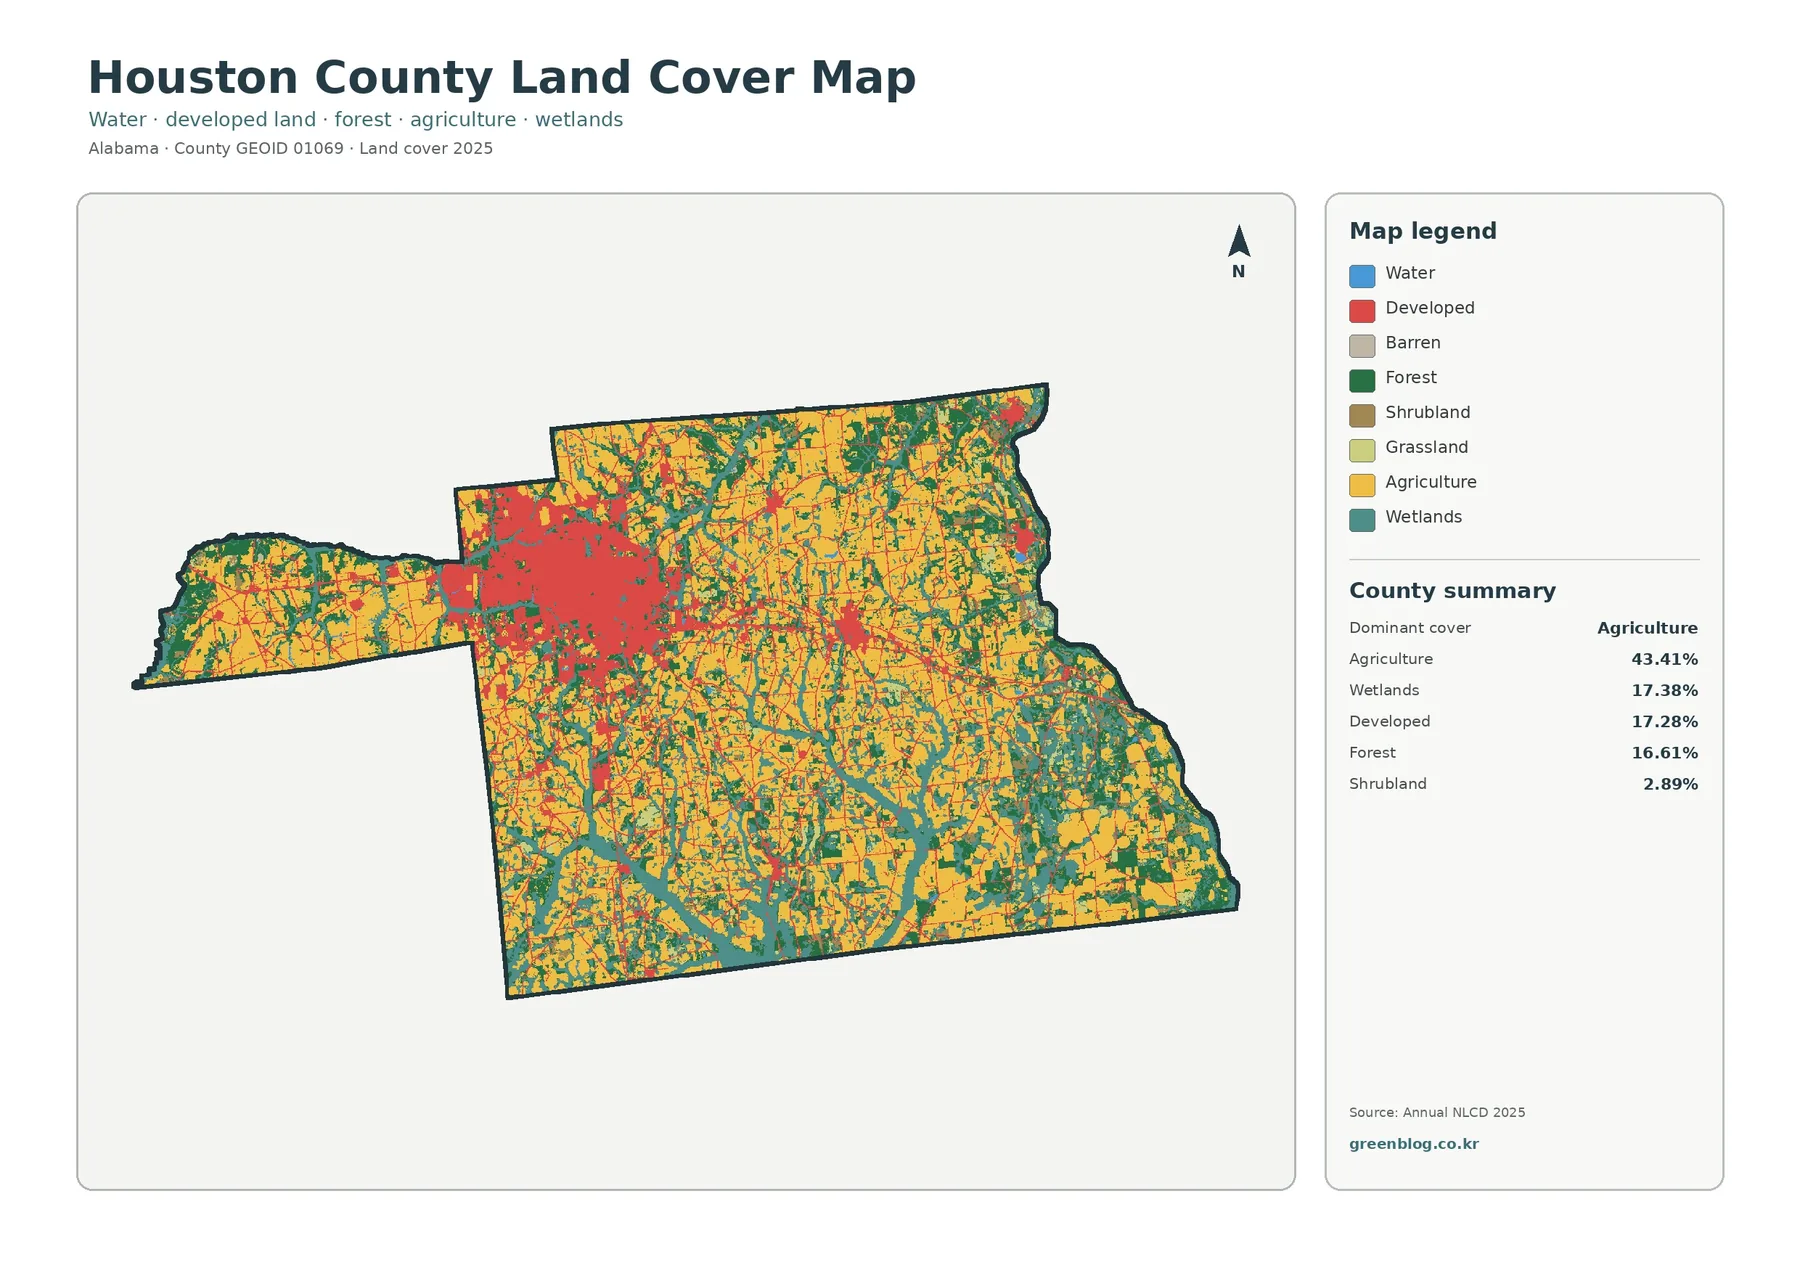
Houston County Alabama Land Cover Map shows a county where the largest developed concentration sits inside a much broader agricultural landscape. Agriculture covers 43.41% in the supplied 2025 summary, while developed land reaches 17.28%, wetlands 17.38%, and forest 16.61%. The strongest built-up area is concentrated in the west-central part of the map, with smaller clusters and road-like traces extending across a county otherwise dominated by farms, wetlands, and scattered woodland.
Four original JPG maps are available in one download: current land cover, forest and farmland, fractional impervious surface, and mapped class differences from 1985 to 2025. Each source JPG is 2480 × 1754 pixels, while the page uses 1800 × 1273 WebP previews. The set works well for county profiles, classroom comparison, presentations, and broad land-cover reference.
Table of Contents
A concentrated built footprint stands out inside a farm-dominated county
Developed cover accounts for 17.28% of Houston County, which is visually significant even though agriculture is more than twice as large. The main red concentration occupies the west-central portion of the county, where developed cells form a broad connected area rather than a few isolated points. Smaller red clusters appear toward the east and along thin linear routes across the interior.
Houston County’s official website identifies Dothan as the county seat and lists the county’s incorporated communities, including Ashford, Columbia, Cottonwood, Cowarts, Gordon, Kinsey, Rehobeth, Taylor, and Webb. Those place names help establish that the county contains several settlement centers, although the thematic map itself does not draw municipal boundaries or label individual towns.
The current land-cover image therefore answers a county-scale question rather than a city-boundary question. It shows where developed surface classes are concentrated relative to farms, wetlands, and forest. For an exact municipal limit, parcel boundary, or street network, a separate administrative or local GIS map is required.
Agriculture covers the largest share but is repeatedly divided by wetlands
Agriculture is the dominant 2025 class at 43.41%. Yellow agricultural cover is widespread across the north, center, south, and eastern part of the county. It does not form one uninterrupted field belt, however. Blue-green wetland cells and darker forest strips repeatedly break the agricultural surface into blocks and corridors, especially through the central and eastern portions.
The county’s official About page describes Houston County as primarily agricultural and names peanuts, cotton, and corn among its principal crops. That local information supports the importance of farming in the county, while the land-cover map supplies the broader surface pattern. The thematic classification does not identify which crop grows in a particular field or establish farm ownership.
Wetlands make up 17.38%, almost the same share as developed land. Their pattern is quite different from the compact built area: wetland cells form branching ribbons, larger patches, and narrow connections through farm and forest cover. Open water is only 0.46% in the forest-and-farmland summary, so most of the blue-green pattern is wetland rather than broad open-water surface.
This distinction matters for ordinary readers. A wetland land-cover class is a generalized description of the surface from satellite-based mapping; it is not a legal wetland determination, floodplain boundary, drainage easement, or permit line. Those questions need current site-level and agency information.
Forest and farmland form a fine-grained pattern across the Coastal Plain
The forest-and-farmland map removes the bright developed colors and separates cropland from pasture or hay. Its summary lists agriculture at 43.41%, forest at 16.61%, wetlands at 17.38%, shrubland at 2.89%, grassland at 1.88%, and water at 0.46%. With the developed areas turned pale, the agricultural dominance becomes even clearer.
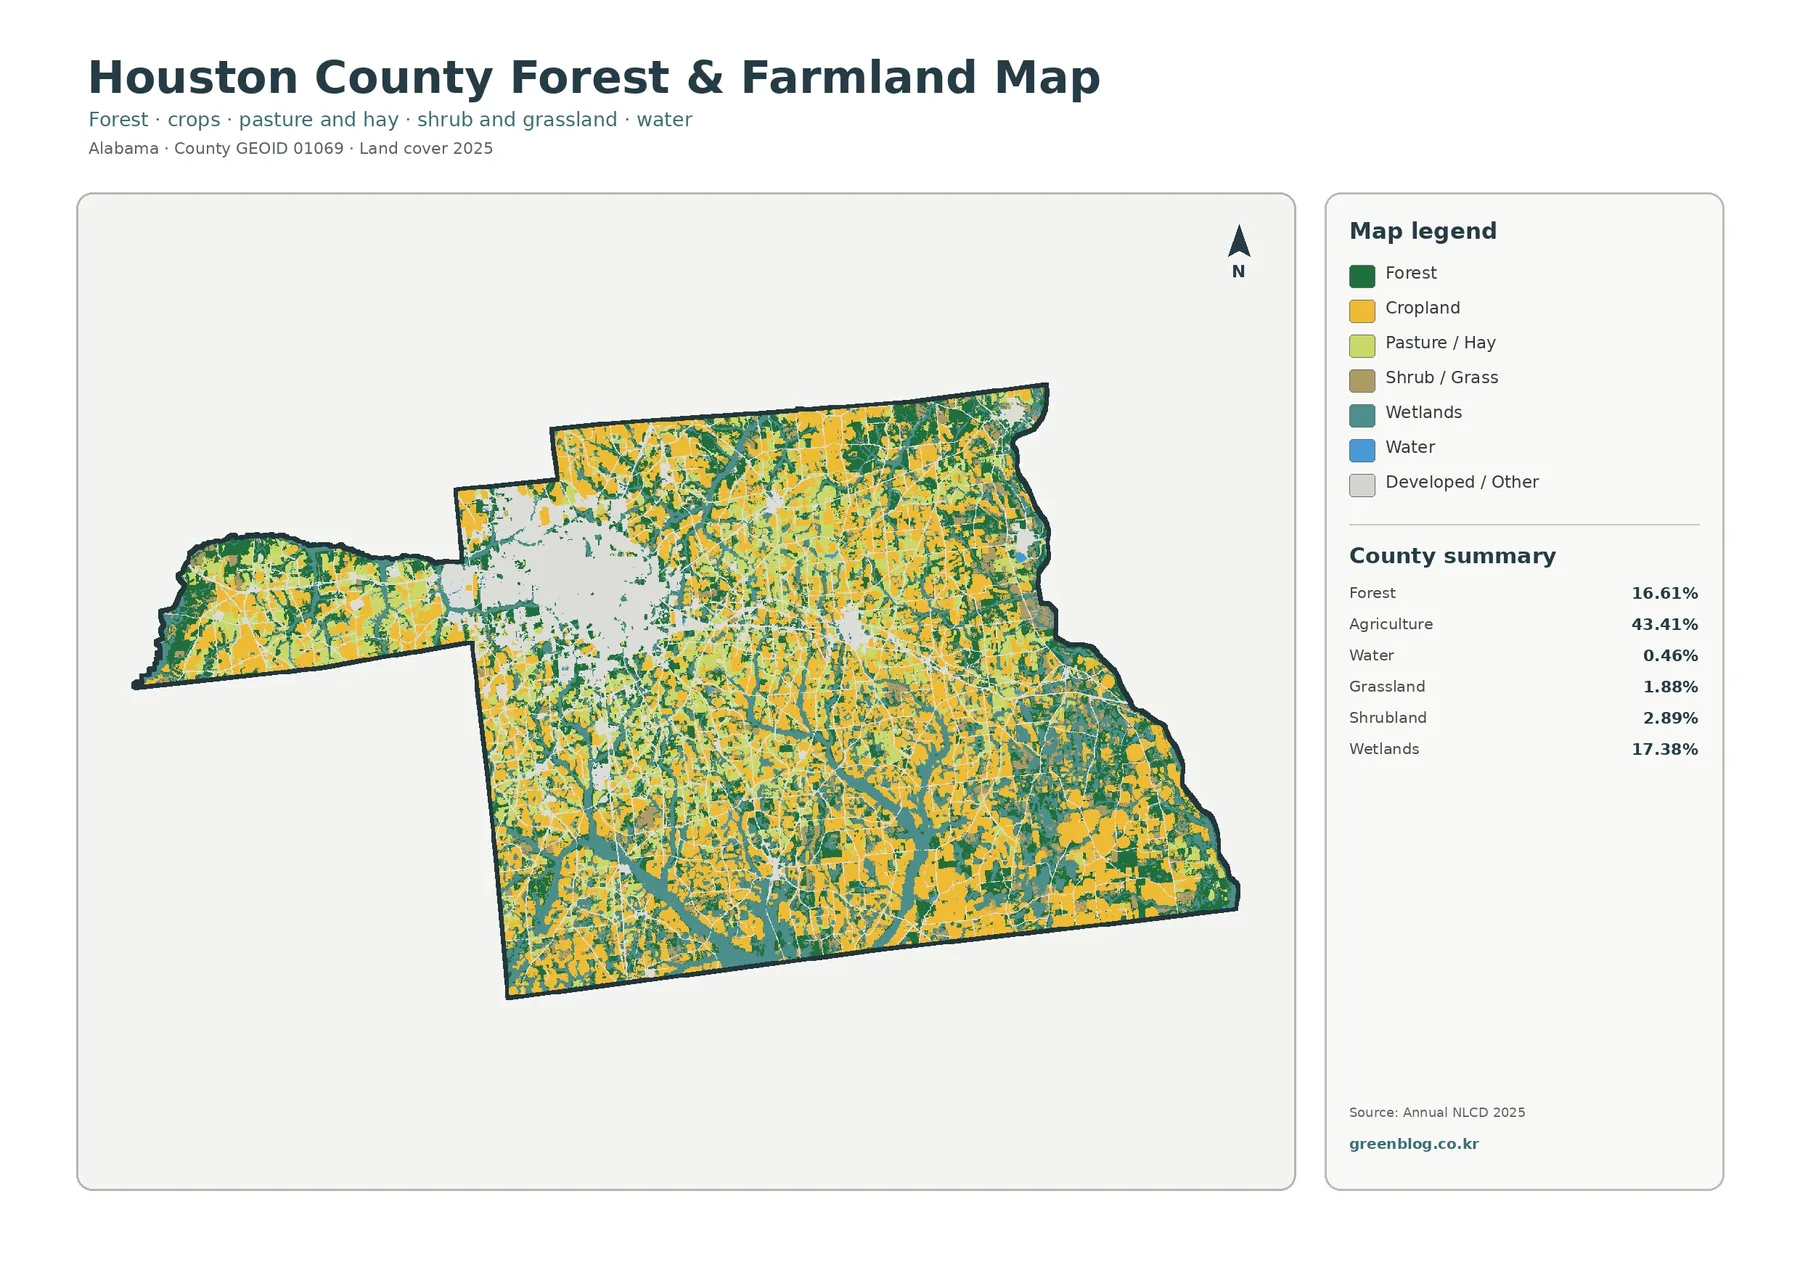
The official county description places Houston County on the Coastal Plain and says its terrain is mainly level to gently sloping, with scattered hillier sections in the northeast. The thematic map does not measure elevation or slope, so the surface colors should not be used as a topographic map. Still, the broad agricultural footprint is consistent with a county whose official description emphasizes agriculture and relatively gentle terrain.
Forest is much less extensive than agriculture but remains visible as narrow strips, larger patches, and edge areas across the county. In the east and southeast, forest and wetlands often appear close together, while the north and interior contain many small wooded pieces between fields. That patchwork matters for habitat or watershed comparison because a countywide 16.61% forest total does not explain where the wooded cover is continuous and where it is fragmented.
A cropland or pasture-colored raster cell is not a farm parcel. It does not reveal a landowner, lease, crop contract, zoning district, or tax treatment. Similarly, forest color does not identify timber rights or conservation status. The map is best used as a first look at the county’s rural surface before opening higher-resolution imagery or local land records.
County-edge rivers add useful context for the water-related classes
Houston County’s official About page states that the county reaches Georgia at the Chattahoochee River on the east and Florida on the south, while the Little Choctawhatchee River forms part of the northwestern boundary with Dale County. Those named features provide a reliable geographic frame for the county, but the supplied land-cover map does not label its water cells.
The Choctawhatchee, Pea and Yellow Rivers Water Management Authority describes the Choctawhatchee watershed as a major southeast Alabama river system. That watershed context is useful when explaining why wetland and water classes appear throughout the county, but it should not be used to assign a name to every visible wetland ribbon. Exact channel identification requires a hydrography layer.
For a classroom or regional project, the maps can be paired with a river map to compare where wetlands, farms, forest, and developed surfaces occur near county-edge water systems. For flood, erosion, bridge, or permitting work, the land-cover image is only background context and cannot replace current hydrologic or engineering data.
Impervious surface shows how strongly development is concentrated
Impervious surface means pavement, rooftops, and other hard cover where rainfall does not readily soak into the ground. The countywide mean is 4.24%, and 2.06% of Houston County is mapped at 50% or greater imperviousness. These values are smaller than the 17.28% developed land-cover share because developed cells can also contain trees, lawns, bare soil, and other permeable surfaces.
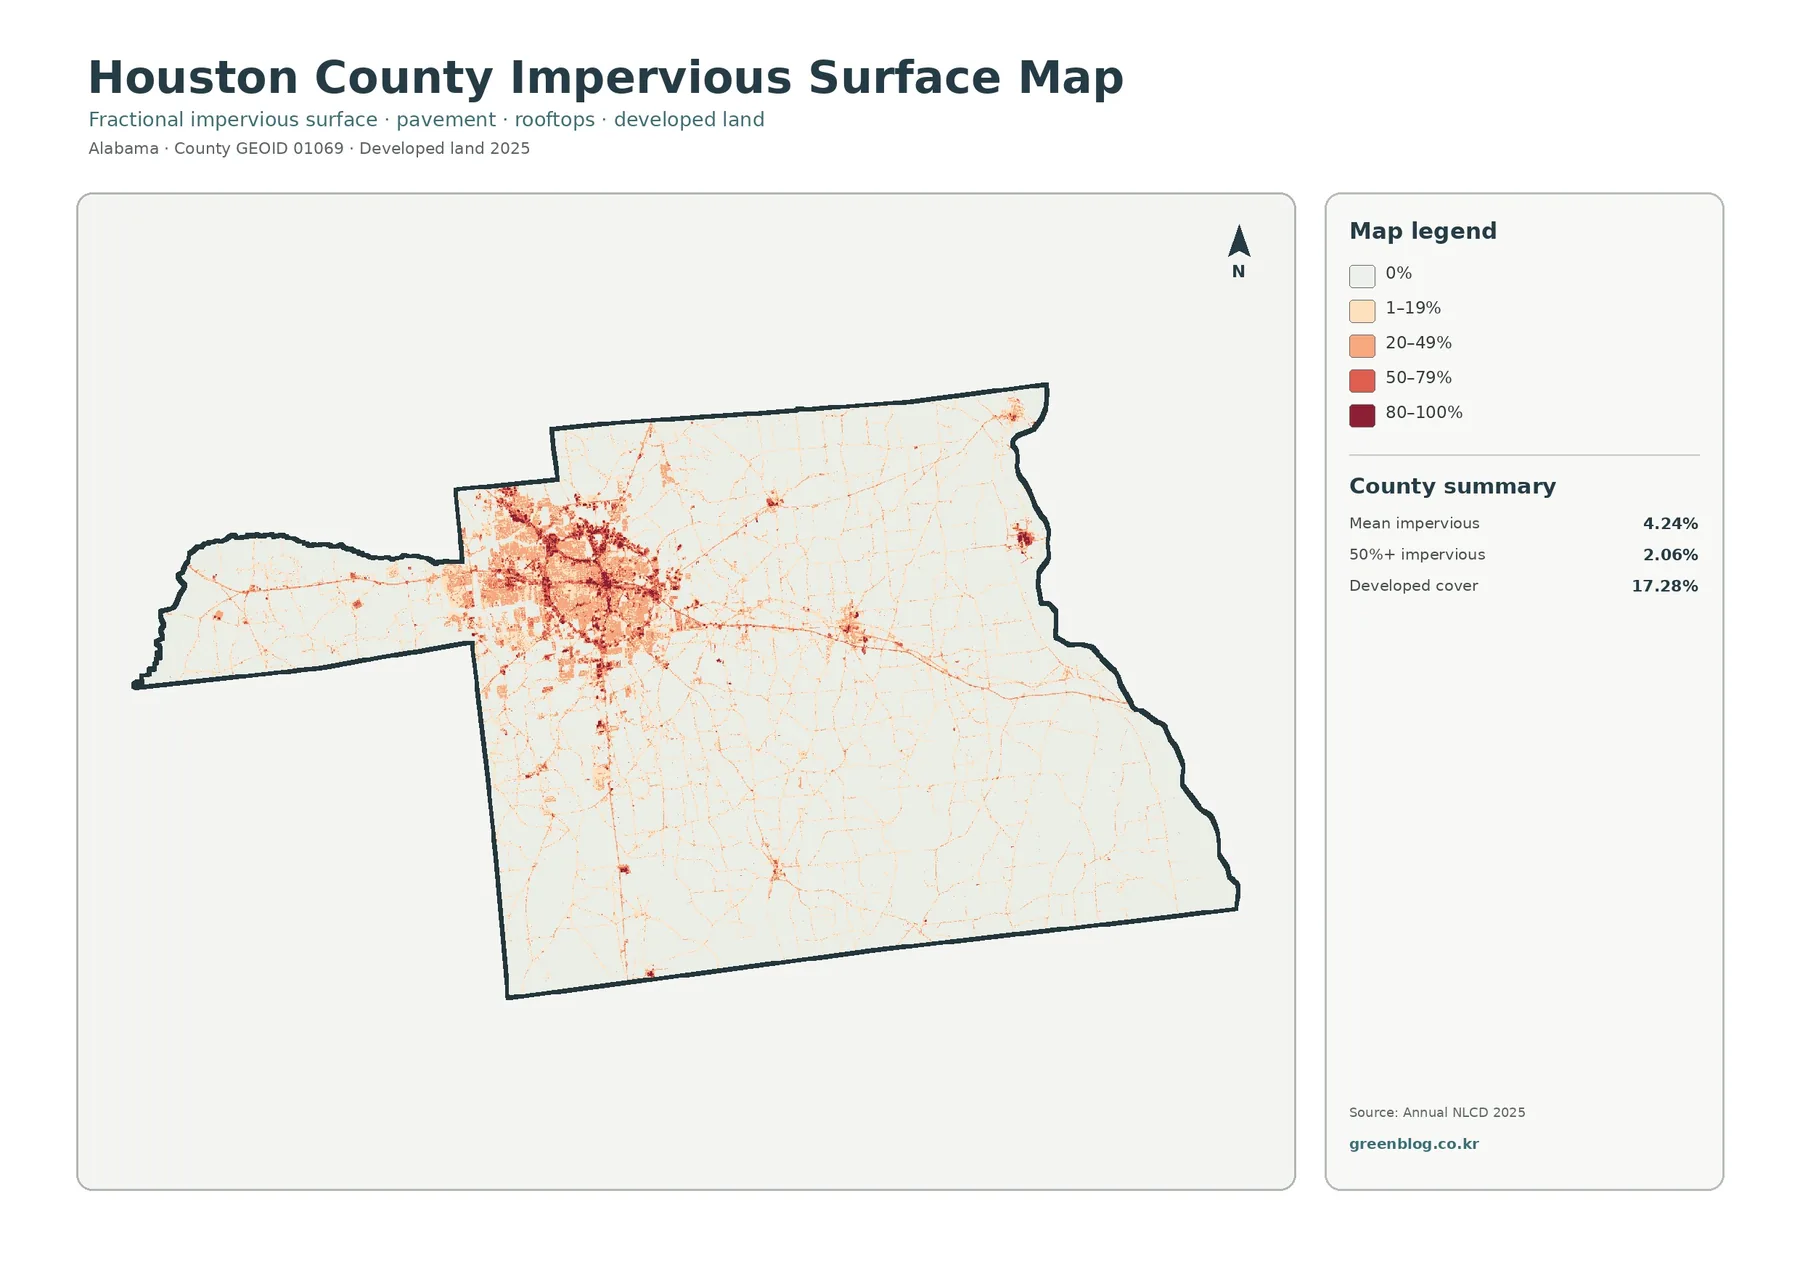
The west-central built-up area becomes even more obvious in this view. Darker impervious cells form a dense core, while thinner orange and red lines extend toward smaller settlement concentrations. The eastern side also contains a compact dark cluster near the county edge, but most rural areas remain pale. This contrast shows why a single countywide average cannot describe local development intensity.
Imperviousness is useful for broad stormwater and urbanization discussions, yet the map is not an infrastructure plan. It does not show storm drains, culverts, detention ponds, road ownership, or individual building outlines. A dark raster cell means the estimated hard-surface fraction is high within that cell, not that the entire cell is one paved object.
The 1985–2025 comparison shows concentrated development differences and many scattered rural changes
The change map compares the class assigned to each cell in 1985 with the class assigned in 2025. The supplied summary reports a class difference across 27.15% of Houston County. Within the named categories, 3.95% is classified as to developed, 4.68% as forest loss, 4.33% as agricultural loss, and 13.21% as other class difference. Wetland difference appears in the legend, but the summary does not provide a separate countywide percentage for it.
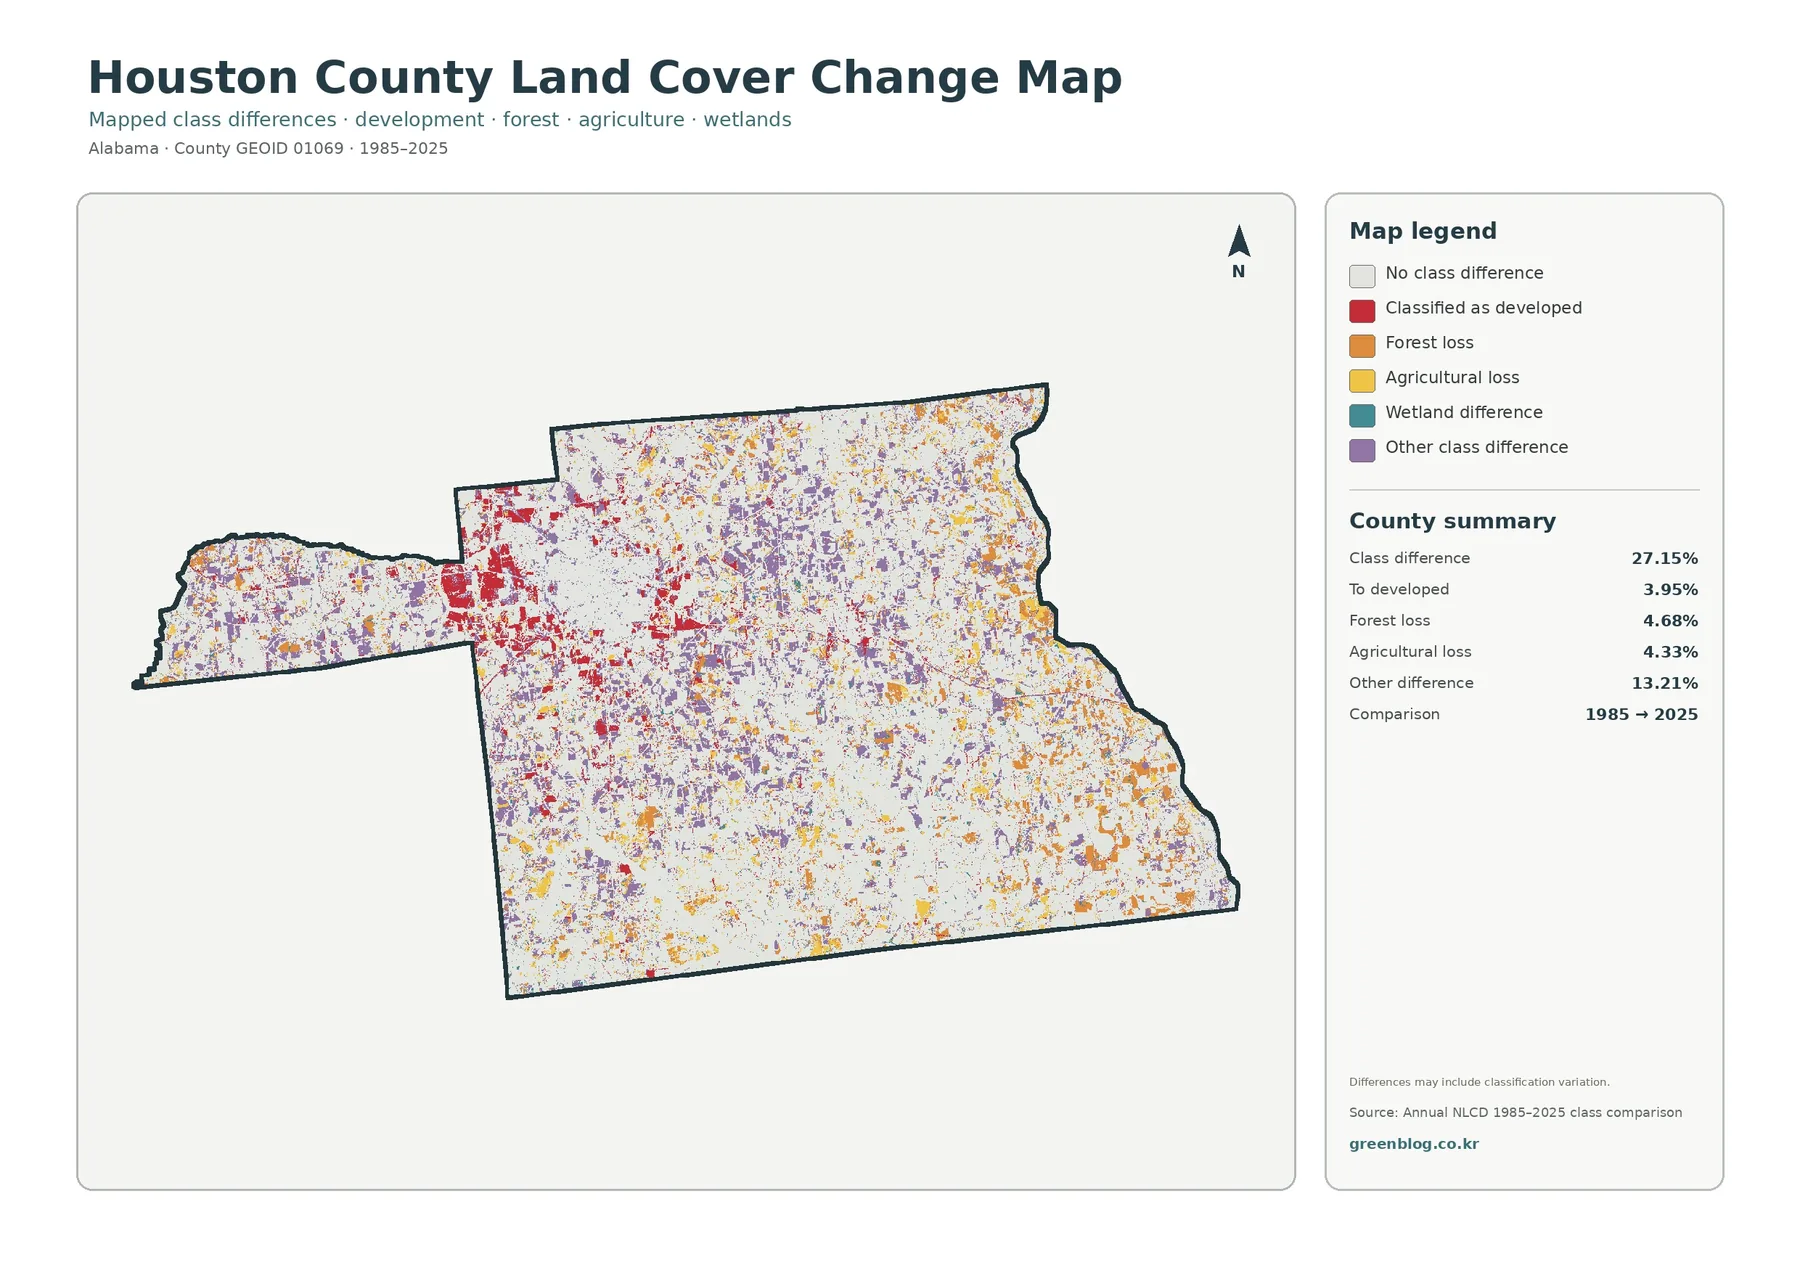
Red to-developed cells are especially dense around the present west-central built area and appear along several connecting traces. Elsewhere, orange forest-loss, yellow agricultural-loss, and purple other-difference cells are scattered widely across the agricultural landscape. The distribution shows that the endpoint comparison includes much more than expansion of developed cover.
The map explicitly warns that differences may include classification variation. Each raster cell is a generalized classification, and a cell can contain a mixture of fields, trees, roads, rooftops, or wet ground. Seasonal vegetation, image conditions, sensors, and classification methods can change the assigned label even when the physical landscape changes only slightly.
For a detailed historical study, the highlighted cells are best treated as locations to investigate. Intermediate Annual NLCD years, historical aerial photographs, county records, or field evidence can help determine whether a difference represents development, crop change, clearing, regrowth, wetland variation, or a classification effect.
Use the four-map set without mixing unlike percentages
Each map answers a different question. The general image describes the 2025 surface classes. The forest-and-farmland view isolates rural cover. The impervious map estimates hard-surface fractions inside each cell. The 1985–2025 image compares two endpoint classifications. Reading them in that order makes the set easier to understand.
The percentages should stay attached to their own measurements. Developed cover is 17.28% in 2025, while 3.95% is labeled to developed in the endpoint comparison and mean imperviousness is 4.24%. Likewise, agriculture covers 43.41% today, but agricultural-loss cells account for 4.33% of the two-date comparison. These values should not be added or subtracted to invent one development or agricultural-change rate.
For comparison with another county, match the same year and map type. A 2025 agriculture share belongs beside another 2025 agriculture share; mean imperviousness should be compared with mean imperviousness; and endpoint-difference categories should be compared with the same 1985–2025 product. This keeps county profiles and classroom charts consistent.
Download the four original Houston County JPG maps
The ZIP contains four original Houston County JPG images that match the page previews: current land cover, forest and farmland, impervious surface, and 1985–2025 class differences. Their county boundary and orientation are consistent, so the set can be placed in a report or presentation as a sequence without rescaling different geographic extents.
Each original JPG is 2480 × 1754 pixels. The package identifies this as the source resolution and does not mark the files as meeting a higher A3-resolution reference. If a large print is needed, check the legend and small labels at the intended physical size before final output.
Raster scale and observation year limit parcel-level use
Annual NLCD land cover is raster data: the county is divided into grid cells and each cell receives one representative surface class. At roughly 30-meter land-cover resolution, a narrow road, field edge, tree line, small stream, or building can share a cell with another surface. A sharp color boundary in the JPG is therefore not a surveyed property line.
The current maps summarize 2025 conditions. Construction, crop changes, clearing, regrowth, or flooding after that observation year are outside these images. The historical product compares only the 1985 and 2025 endpoints, so a place that changed several times and later returned to its starting class may look unchanged in the two-date comparison.
Land cover is also different from zoning, ownership, and legal land use. Agricultural color does not establish farm ownership or zoning, developed cover does not grant a building right, and wetland cover does not replace a jurisdictional wetland determination. Property, permitting, engineering, and environmental decisions require the appropriate current local, state, federal, survey, or field information.
Frequently Asked Questions
What is the largest 2025 land-cover class in Houston County?
Agriculture is the dominant class at 43.41%. Wetlands account for 17.38%, developed land 17.28%, forest 16.61%, and shrubland 2.89%. The map shows agriculture across most parts of the county, while the largest developed concentration occupies the west-central area.
Why is developed cover 17.28% while mean imperviousness is 4.24%?
They measure different things. Developed land is a categorical land-cover class and may contain lawns, trees, and other permeable surfaces. Imperviousness estimates hard surfaces such as pavement and rooftops. Houston County’s mean imperviousness is 4.24%, and 2.06% of the county is mapped at 50% or greater imperviousness.
Does 27.15% class difference mean 27.15% of the county was physically converted?
Not necessarily. It means that 27.15% of mapped cells received different classes in the 1985 and 2025 endpoint comparison. The map warns that classification variation may be included, so some differences may reflect real land-cover change while others can involve mixed pixels, image conditions, or classification methods.
Map File Information
The ZIP contains four original Houston County JPG maps: 2025 land cover, forest and farmland, impervious surface, and mapped class differences from 1985 to 2025.
- File Type: ZIP containing four JPG images
Related Maps
- Autauga County Alabama Land Cover Map
- Baldwin County Alabama Land Cover Map
- Barbour County Alabama Land Cover Map
Sources and data
- MRLC Annual NLCD Data — official access point for the Annual NLCD land-cover and developed-surface datasets.
- USGS Annual NLCD Land Cover Classification — official descriptions of the land-cover classes used in Annual NLCD.
- Houston County: About — official county source for Dothan, the Georgia and Florida borders, Chattahoochee River, Little Choctawhatchee River, Coastal Plain terrain, and agricultural background.
- Houston County: Communities — official list of Dothan and the county’s incorporated towns.
- Choctawhatchee, Pea and Yellow Rivers Water Management Authority — official watershed resource for southeast Alabama.
Green Map creates custom-edited map images using open geographic data sources such as geoBoundaries, Natural Earth, OpenStreetMap, and government open data.
These maps are edited visual materials, not raw data files, and are provided for education, documents, presentations, and graphic reference.