Jefferson County sits on the low, water-rich edge of Southeast Texas, where Beaumont, Port Arthur, several smaller cities, the Neches River, bayous, and the Gulf coast all fit within one unusually varied county outline. This Jefferson County Texas Map page is designed to make those relationships easy to see rather than reducing the county to a single boundary. Four map views are provided below, and the matching high-resolution A3 JPG files are available together in one ZIP download.
A useful way to orient yourself is to start with Beaumont in the northeastern interior and then move south toward Port Arthur. Nederland, Groves, and Port Neches occupy the eastern corridor between those larger centers, while Bevil Oaks lies farther north. West and southwest of that cluster, the county opens into a much less urban-looking area crossed by highways, bayous, reservoirs, and low coastal terrain. Seeing both halves at once explains why Jefferson County cannot be described accurately as just Beaumont or just Port Arthur.
Table of Contents
From Beaumont to Port Arthur: the county’s main urban concentration
The general county map makes Beaumont the easiest starting point. Jefferson County Courthouse and Lamar University are labeled near the city, and several major roads converge in the same part of the map. Moving southeast brings Nederland and Groves into view, with Port Neches near the Neches River side of the county. Port Arthur lies farther south, close to the long eastern edge and the water-dominated landscape that continues toward the Gulf.
The western half looks very different. China, Fannett, and Hamshire appear with much wider gaps between them, while Taylor Landing is a small reference point near the central-southern part of the map. Bevil Oaks sits north of Beaumont. These labels show that settlement is not evenly spread across the county: the strongest concentration is on the eastern side, while large sections of the west and southwest have fewer prominent city labels.
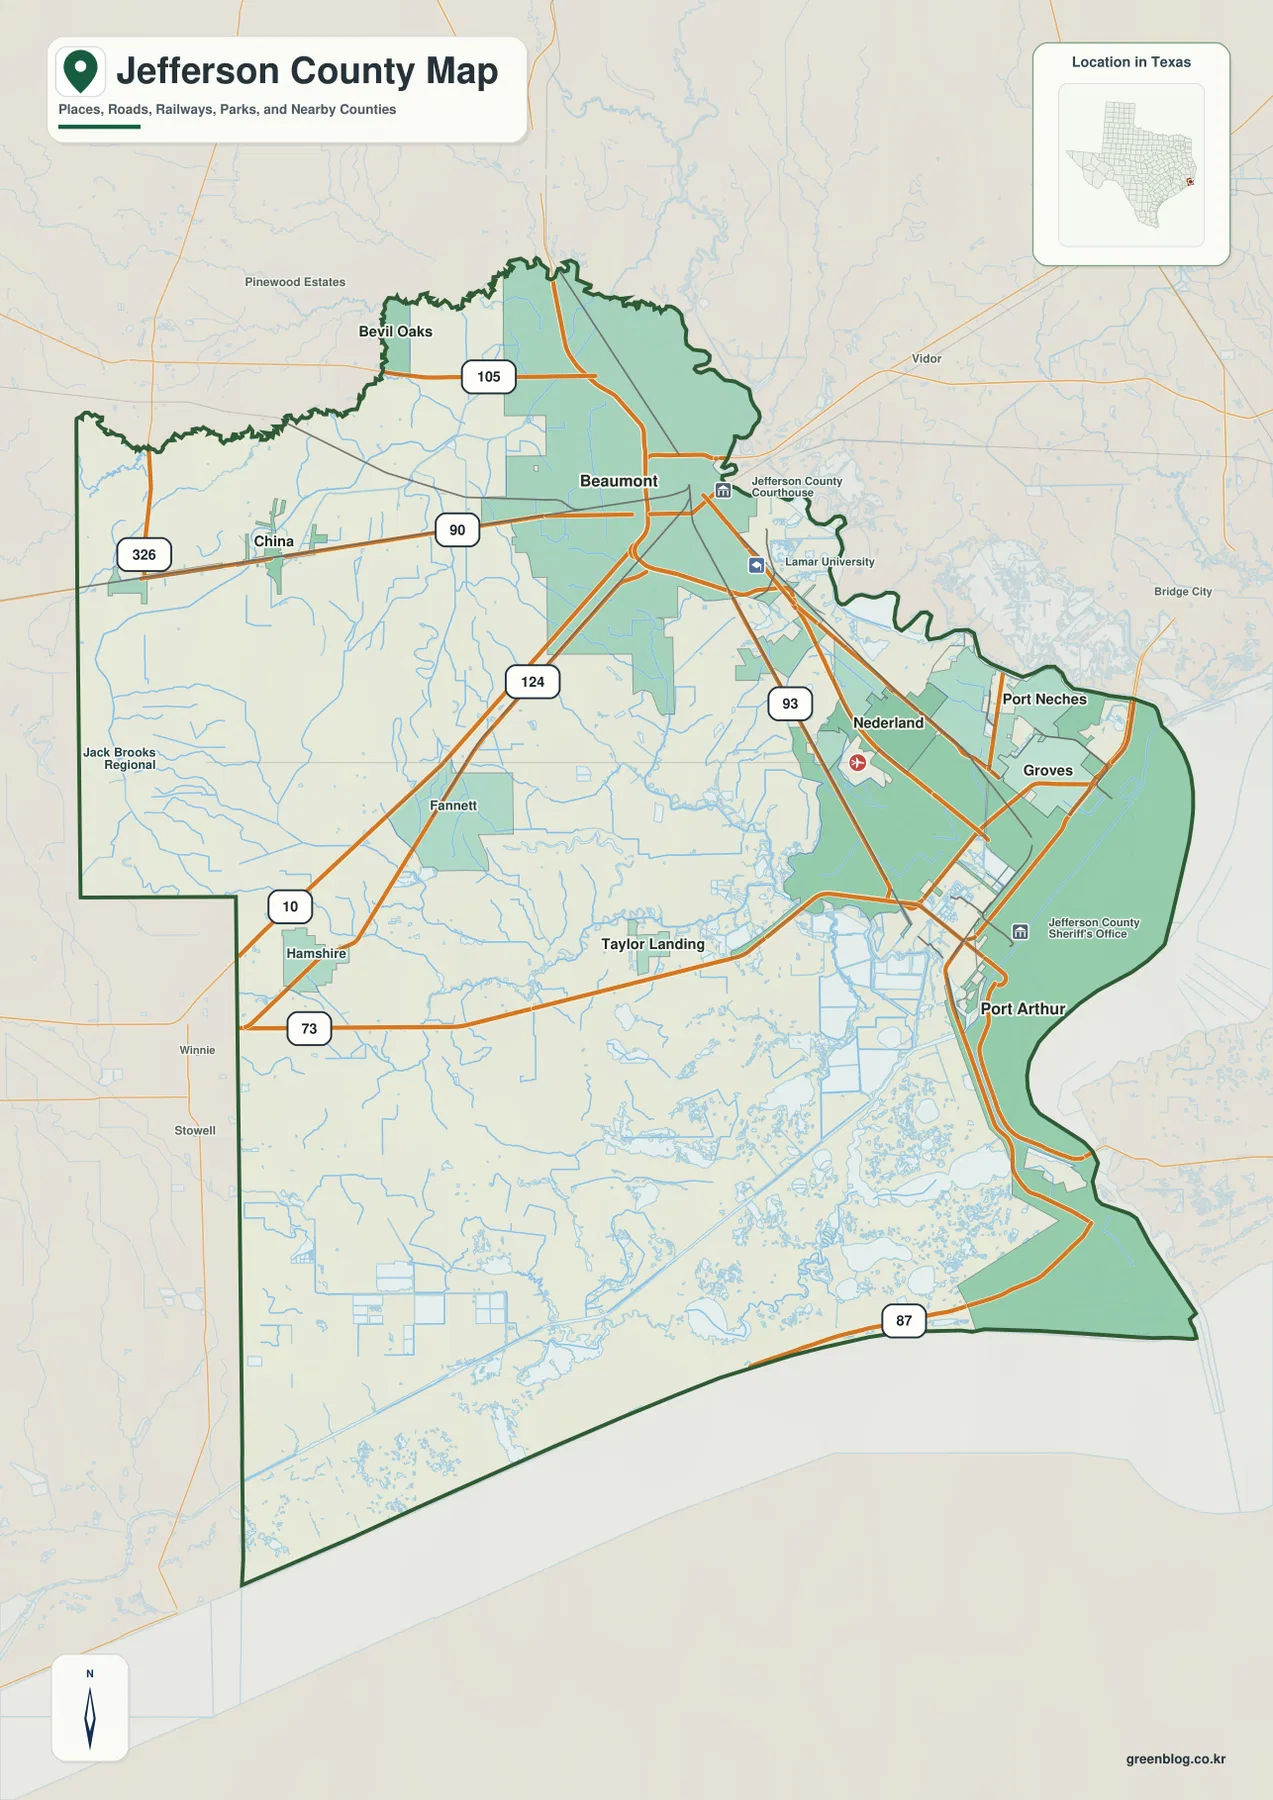
For a quick location check, this map can serve as the main reference sheet because it combines boundaries, communities, highways, and selected landmarks. It is especially helpful when a place name such as Nederland or Groves is unfamiliar: instead of treating each city as an isolated dot, you can see how it sits between Beaumont and Port Arthur and how close it is to the eastern water boundary.
I-10, US 90, and the roads that connect the inland and coastal sections
I-10 is the clearest east-west route around Beaumont, and US 90 provides another strong west-to-east reference through the county. Highway 105 appears north of Beaumont, while 326 crosses the western side and 124 approaches Beaumont from the southwest. These roads help separate the northern and western interior from the more densely settled eastern corridor.
Farther south, Highway 73 runs across the county from the Hamshire side toward the Port Arthur area, while Highway 87 follows the lower coastal section. Highway 93 is visible in the Beaumont-to-mid-county corridor. Because the county has a broad western body and a long southeastern extension, the road pattern changes noticeably from one part to another; the same route network that serves Beaumont does not simply continue as a uniform grid to the Gulf.
The map is not intended to replace current navigation software, but it works well for understanding direction and regional context. If you are preparing a classroom map, trip overview, or local reference sheet, labeling I-10 together with 73 and 87 gives a much clearer picture of how inland Beaumont, the mid-county cities, and the coastal end of Jefferson County are connected.
Why the six ranked cities cluster on the eastern side
The city-distribution map ranks six major cities and places them inside the county outline: Beaumont, Port Arthur, Nederland, Groves, Port Neches, and Bevil Oaks. Beaumont is ranked first and sits well north of Port Arthur, which is ranked second. Nederland, Groves, and Port Neches form a compact group in the eastern middle of the county, while Bevil Oaks is the outlier to the north.
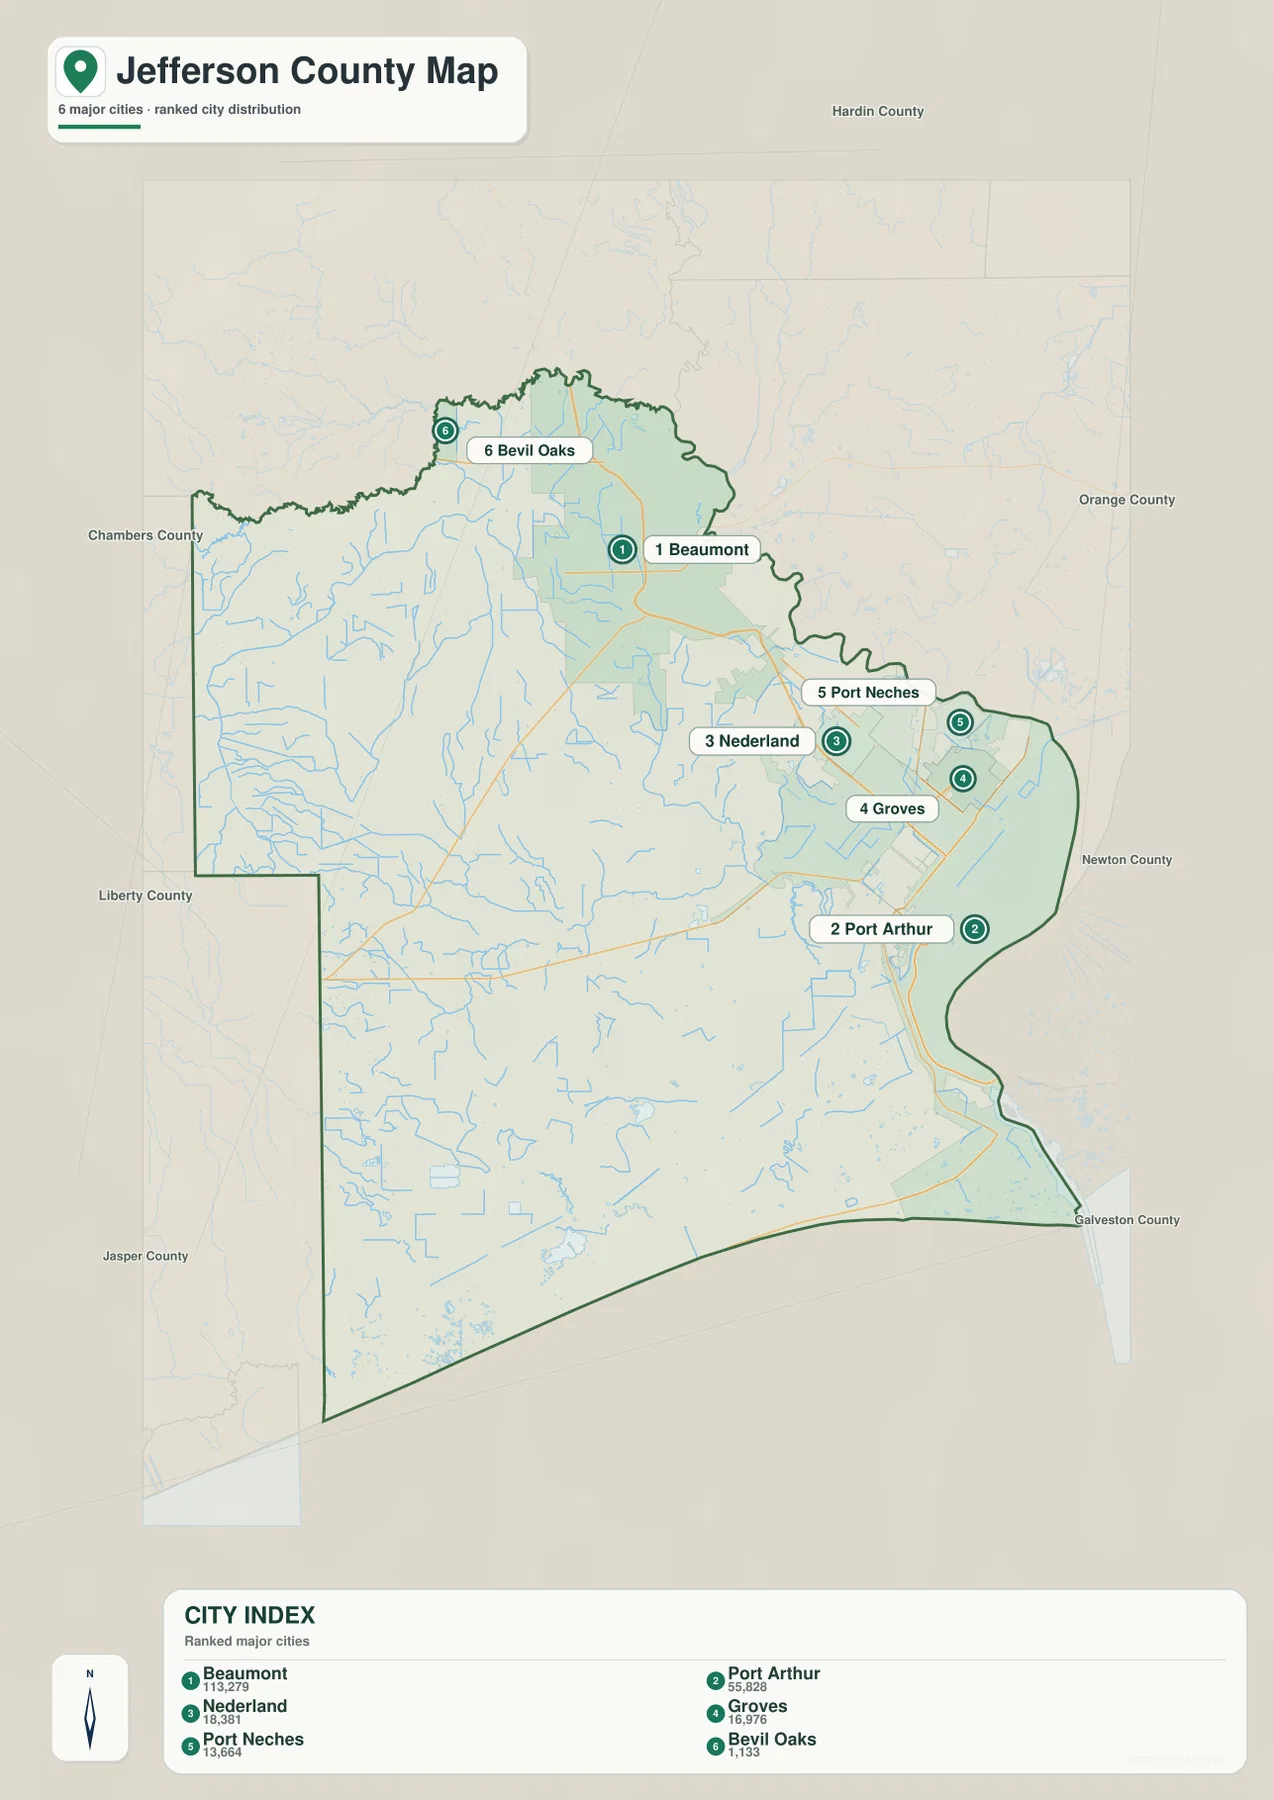
The value of this map is not just the ranking itself. Five of the six labeled places sit in the eastern half, leaving the west and southwest without a comparable concentration of ranked cities. That contrast makes the settlement pattern immediately visible and helps explain why many county references focus on the Beaumont–Port Arthur area even though the county extends much farther west and south.
Nearby county names around the frame, including Hardin, Orange, Chambers, and Liberty, also help with orientation. They show where Jefferson County sits within the broader Southeast Texas region. The city map should not be read as a driving-distance diagram; it is a ranked location map, so actual travel times and road mileage should be checked with a current routing source.
Neches River, Taylor Bayou, and a dense network of coastal water
Water is one of the defining features of Jefferson County. The Neches River is the most prominent named river on the map and follows the eastern side before reaching the broader coastal water system. Inside the county, Hillebrandt Bayou and Taylor Bayou are major named references. North Fork Taylor Bayou and South Fork Taylor Bayou extend the network westward, while Gilley Canal and Salt Bayou add more visible channels in the central and southern lowlands.
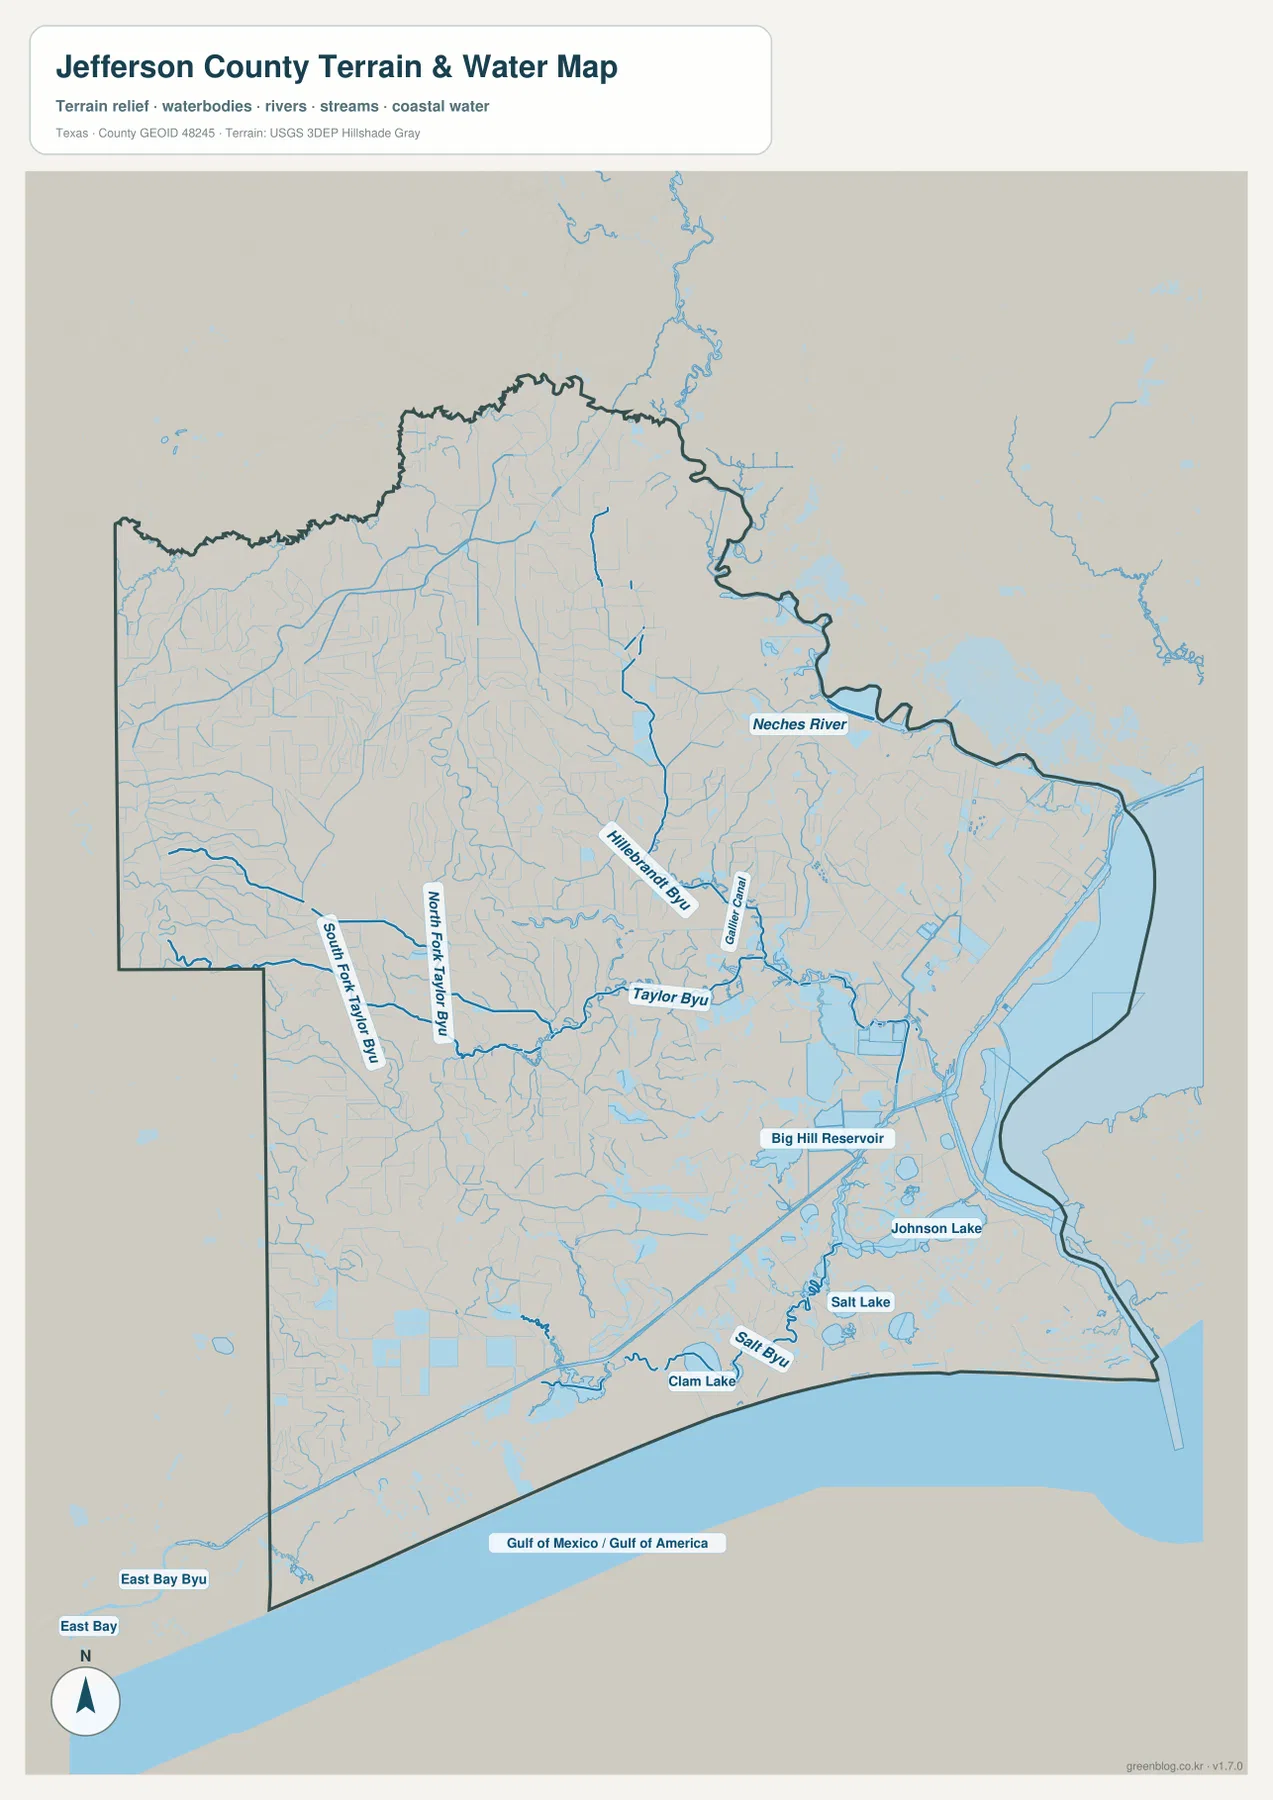
Several named water bodies stand out in the southern half: Big Hill Reservoir, Johnson Lake, Salt Lake, and Clam Lake. The map also labels Gulf of Mexico / Gulf of America along the southern edge. Together, these features show why the county’s southern landscape looks so different from the road-centered area around Beaumont. There is no single watercourse to follow; instead, rivers, bayous, canals, reservoirs, lakes, and coastal water overlap across a very low landscape.
This is a reference map of waterways and terrain, not a flood-hazard, parcel, wetland-jurisdiction, or navigation chart. A blue feature on the map shows the location of mapped water, but it does not by itself establish flood risk, legal wetland status, navigability, or property limits. Those questions require the appropriate official datasets and current local information.
A county averaging about four meters above the local elevation reference
The elevation map makes the coastal setting even clearer. Its locally scaled legend emphasizes small differences from roughly sea-level colors up to about 12 meters, while the map annotation reports an actual range of approximately -4 to 19 meters and a mean near 4 meters. Those values are modest compared with inland hill or mountain counties, yet the color change across Jefferson County is still easy to see.
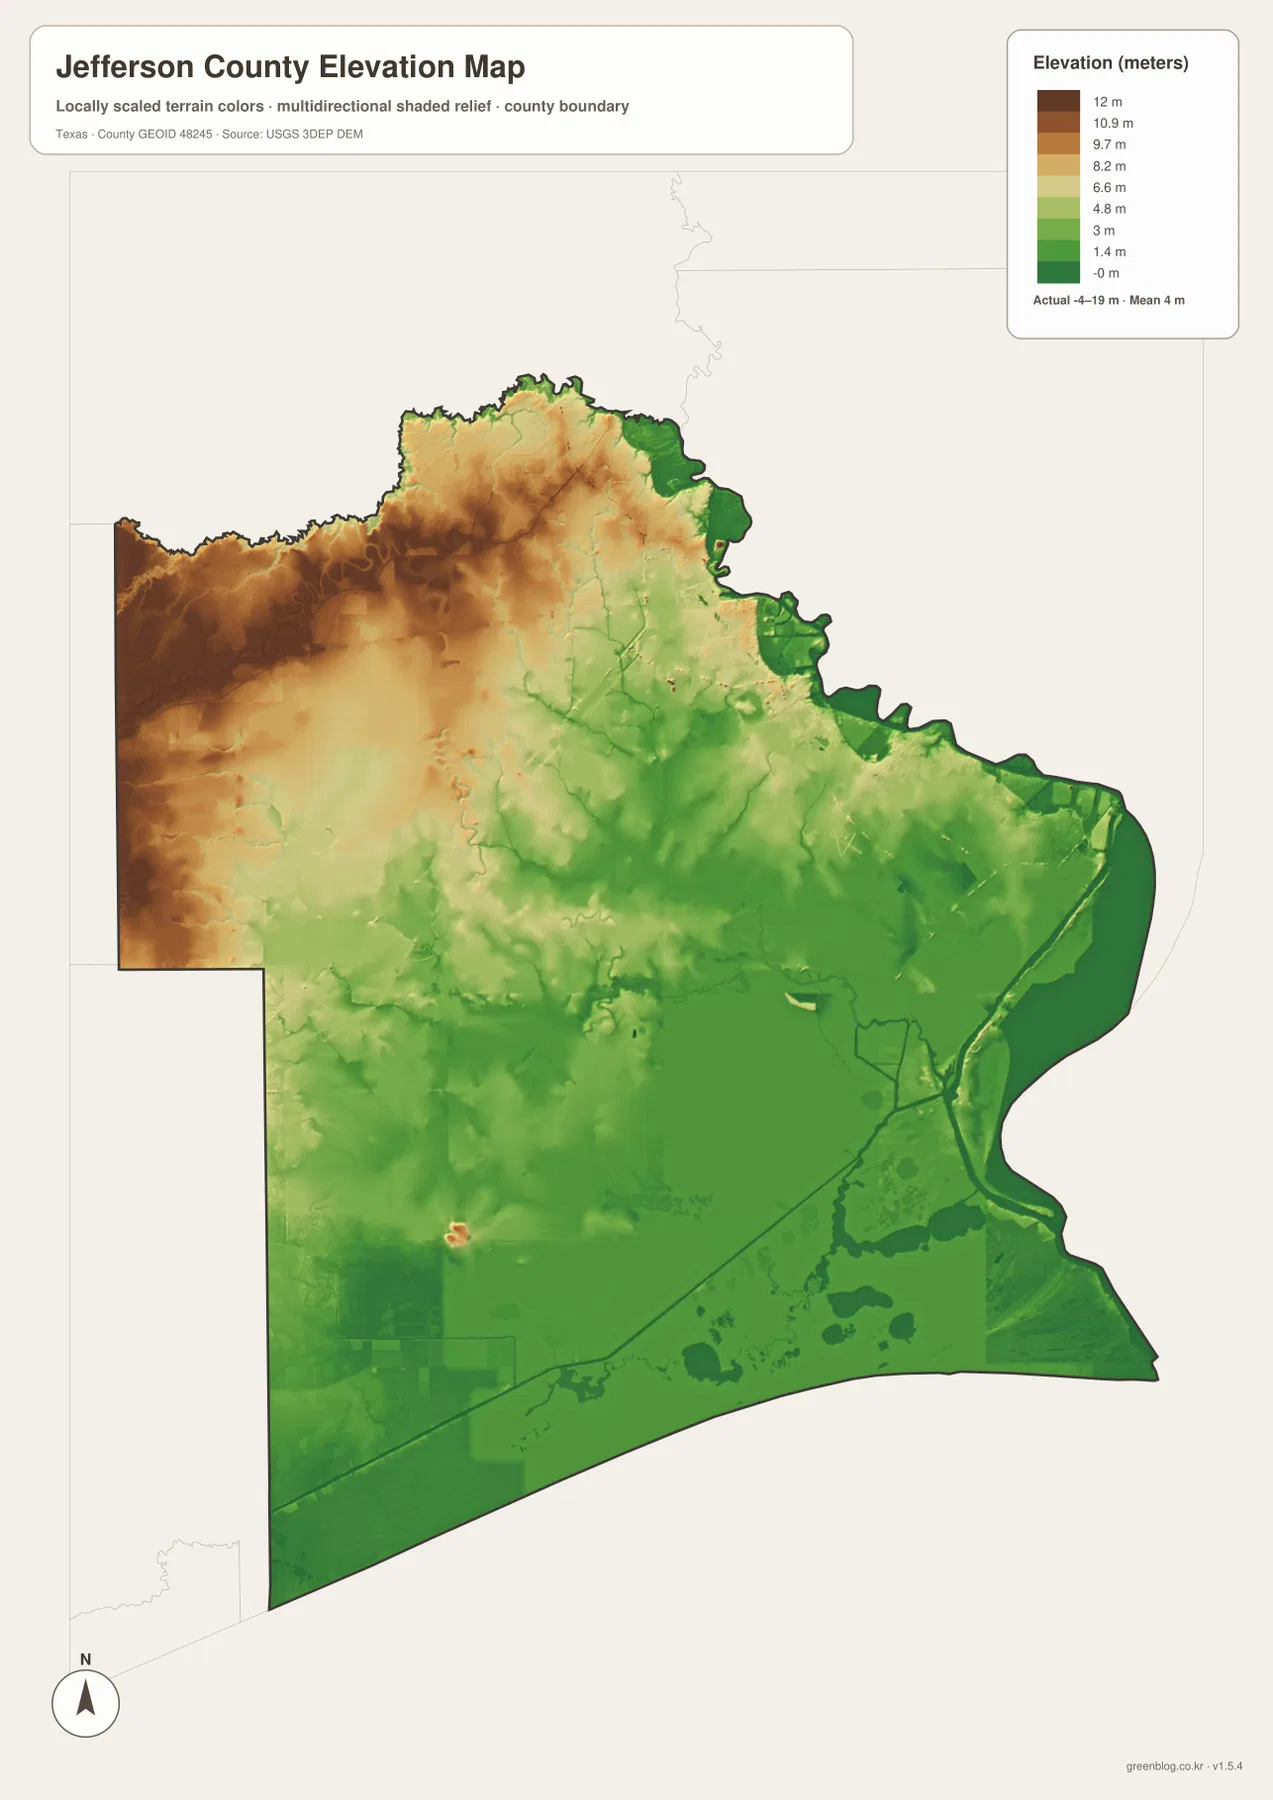
Brown and tan tones are concentrated toward the west and northwest, indicating the relatively higher ground. Greens dominate much of the east and south, including the Port Arthur and coastal-water side. The pattern is gradual rather than mountainous: the county does not rise into steep relief, but it does have enough change for drainage lines, bayous, and low coastal areas to stand out when the elevation and water maps are compared.
Because this surface is generalized for county-scale viewing, it should not be treated as survey-grade elevation. It is useful for explaining which parts of the county are relatively higher or lower and for adding terrain context to the water network, but engineering, drainage design, construction, and property-level work require more precise site-specific measurements.
Which map is most useful for your task?
Use the general county map when you need boundaries, city names, roads, and basic orientation on one page. The city-distribution map is better when the question is where the main population centers are concentrated. For rivers, bayous, lakes, reservoirs, and the Gulf-facing edge, the water map removes much of the urban detail and makes the hydrography easier to follow. The elevation map adds a fourth perspective by showing how little vertical relief exists across much of the county and where the relatively higher ground is located.
For teaching or local research, a good sequence is to locate Beaumont and Port Arthur first, then compare the city map with the Neches River and Taylor Bayou network, and finally check the elevation colors. That order connects settlement with water and terrain without turning the page into a technical GIS exercise. For print projects, the high-resolution JPG set also makes it possible to use only the map that fits the topic instead of capturing a lower-resolution screen image.
All four files cover the same Jefferson County area but emphasize different information. You can use a single JPG for a focused project or place the maps side by side when you need to compare cities, waterways, roads, and elevation.
Frequently Asked Questions
What is the easiest way to distinguish Beaumont and Port Arthur on the map?
Beaumont is the large northern urban reference near I-10 and US 90, while Port Arthur lies much farther south near the water-dominated coastal section. Nederland, Groves, and Port Neches occupy the eastern corridor between them, so locating those three smaller cities makes the Beaumont-to-Port Arthur arrangement easy to follow.
Does the water map show flood zones?
No. It shows mapped rivers, bayous, canals, lakes, reservoirs, and coastal water, including the Neches River, Taylor Bayou, Hillebrandt Bayou, Salt Bayou, and several named lakes. Flood risk, insurance zones, wetland jurisdiction, and navigation status require separate official sources.
What does the Jefferson County elevation map say about the terrain?
The map reports an actual elevation range of about -4 to 19 meters with a mean near 4 meters. The northwest is relatively higher, while broad areas toward Port Arthur, the eastern waterways, and the Gulf-facing south are lower. The surface is intended for county-scale comparison rather than engineering or survey measurements.
Map File Information
The download contains the Jefferson County general map, ranked city map, water map, and elevation map as four high-resolution A3 JPG files in one ZIP archive.
- File Type: ZIP containing 4 JPG files
Related Maps
- Orange County Texas map
- Archer County Texas map
- Wichita County Texas map
- Polk County Texas map
- Tyler County Texas map
Sources and References
U.S. Census Bureau TIGER/Line Shapefiles — official geographic files for boundaries, roads, and related mapping layers.
USGS National Hydrography — official U.S. Geological Survey information for rivers, streams, water bodies, and hydrographic data.
USGS 3D Elevation Program — the USGS program for national elevation data and 3DEP resources.
USGS The National Map Viewer — an official viewer for checking geographic layers such as boundaries, hydrography, and terrain.
Jefferson County Historical Commission — A History of Jefferson County — county-specific background on Beaumont, Port Arthur, communities, transportation, and local development.
Texas State Historical Association — Jefferson County — a county history and geographic overview for additional local context.
Green Map creates custom-edited map images using open geographic data sources such as geoBoundaries, Natural Earth, OpenStreetMap, and government open data.
These maps are edited visual materials, not raw data files, and are provided for education, documents, presentations, and graphic reference.