Henry County Alabama Land Cover Map makes the county’s internal contrast easy to see: forest is strongest across much of the north and center, while broad agricultural areas take over more of the southern third. The 2025 summary reports 40.22% forest and 30.25% agriculture, with wetlands at 9.24%, developed land at 7.24%, and grassland at 6.72%. Two compact developed concentrations stand out against that mostly rural pattern.
Four related map views are included on this page, and the four original JPG files can be downloaded together in one ZIP. They cover current land cover, forest and farmland, fractional impervious surface, and class differences between 1985 and 2025. Using the same county extent across all four images makes them useful for reports, lessons, presentations, and side-by-side county comparisons.
Table of Contents
From a wooded north to a farm-heavy south
Dark green forest fills large connected areas across the northern part of the 2025 map and remains common through the center. Agricultural cells interrupt that forest, but they are generally smaller and more scattered there. Moving toward the lower third, the balance changes: large yellow field blocks become much more continuous, while forest survives as narrower bands and separate patches.
That north–south shift matters more than the countywide percentages alone. A visitor who sees only “40.22% forest” might imagine the woods are spread evenly. They are not. The map shows a much stronger forest presence in the upper half and a broader agricultural footprint farther south, with the central area acting as a transition where several classes meet.
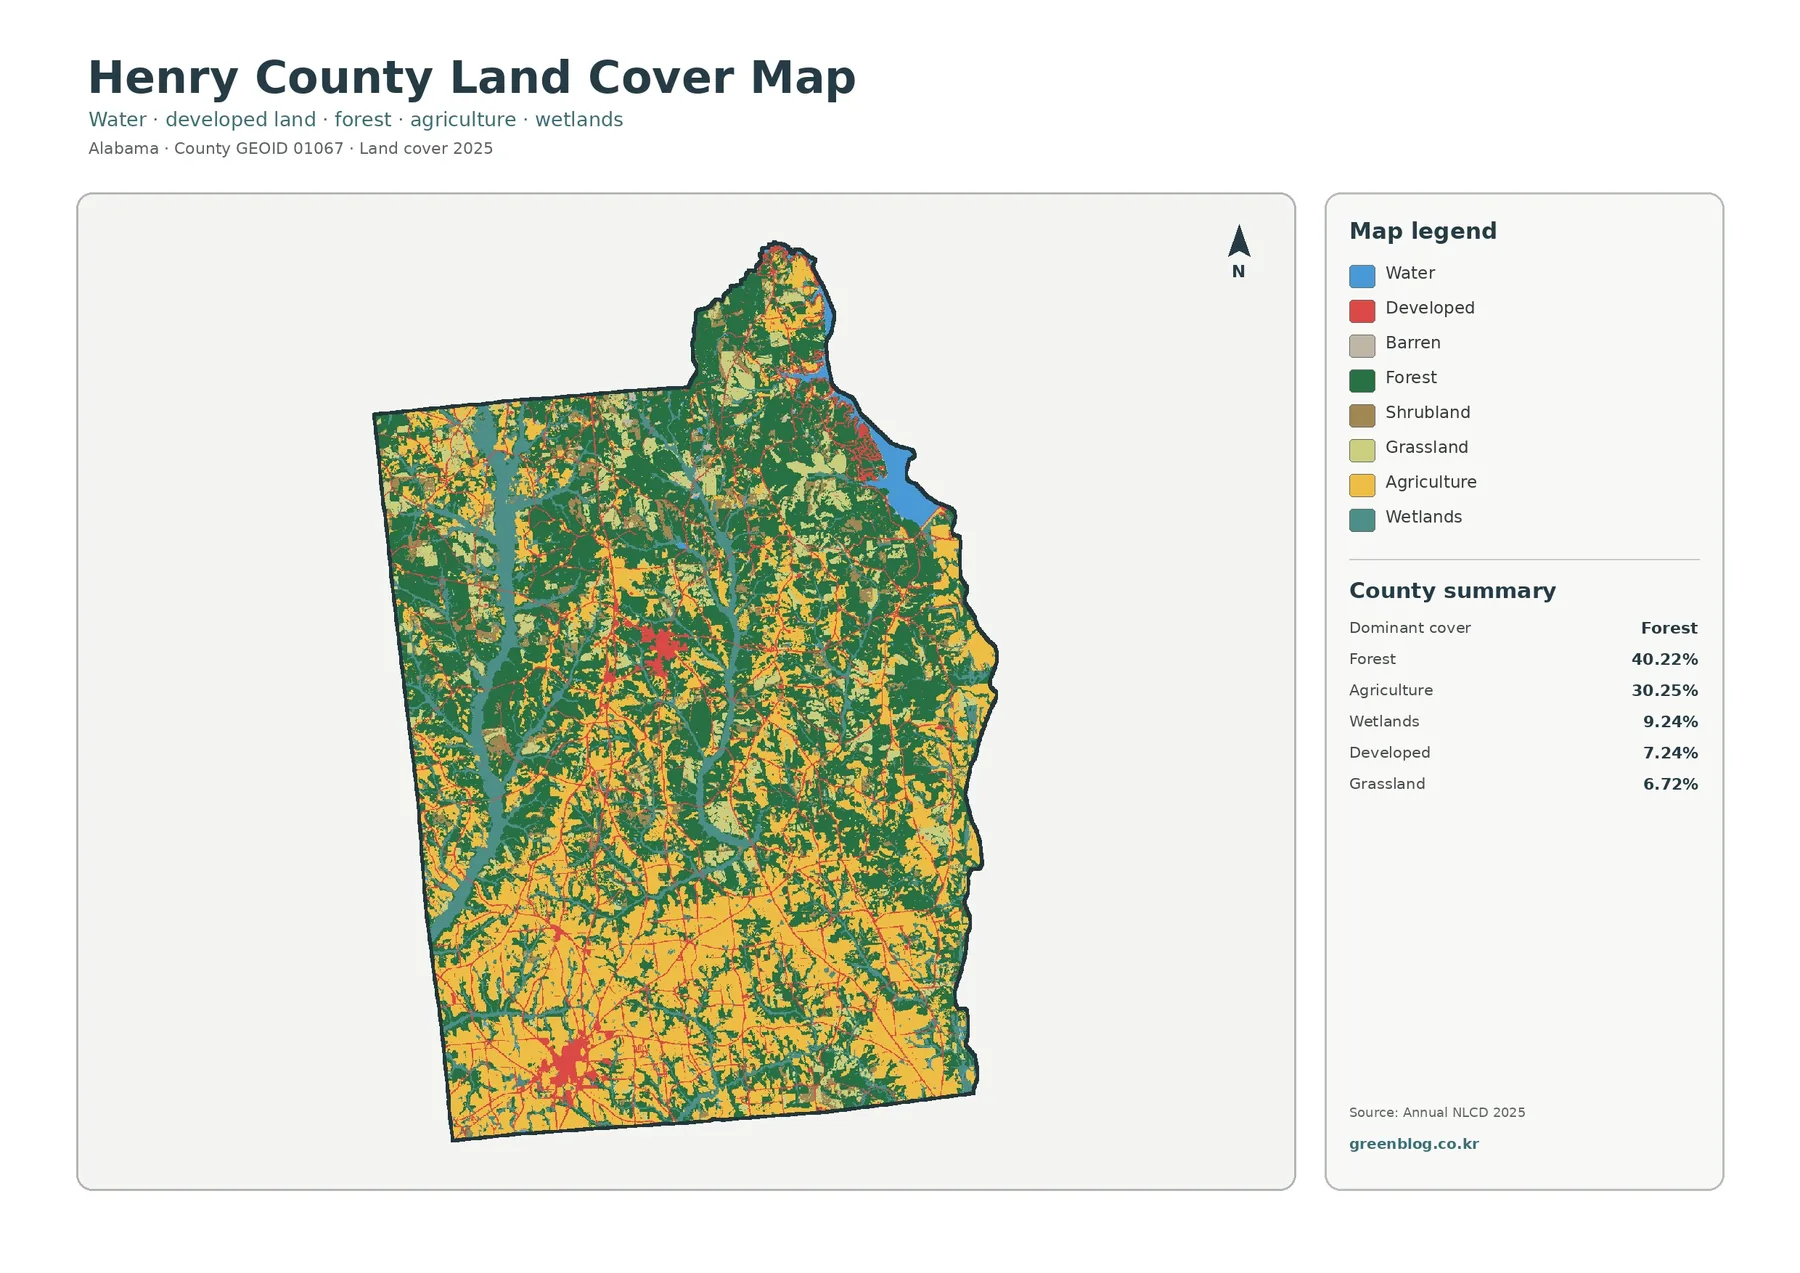
Wetland cover, at 9.24%, forms smaller branching corridors rather than one continuous region. Those blue-green areas occur within both forest and farmland and are especially useful for recognizing where wetter ground interrupts the larger rural classes. Open water is only 1.36% in the forest-and-farmland summary, so the visible wetland pattern should not be described simply as rivers or lakes.
Red developed cells occupy 7.24% of the 2025 map. Instead of one broad urbanized belt, the map shows two especially noticeable clusters—one in the central-western part of the county and another farther south—plus thinner traces and smaller spots elsewhere. The county’s official Cities and Towns page identifies Abbeville as the county seat and Headland as the largest city, but the thematic image itself does not draw municipal boundaries, so the colored clusters should be interpreted as land-cover concentrations rather than exact city outlines.
Fields and pastures sit inside a larger wooded framework
The forest-and-farmland view removes much of the visual competition from developed classes and separates cropland from pasture or hay. Its summary keeps forest at 40.22% and agriculture at 30.25%, while also showing wetlands at 9.24%, grassland at 6.72%, shrubland at 4.82%, and water at 1.36%. This version is especially useful for seeing that agricultural land is not one uniform category.
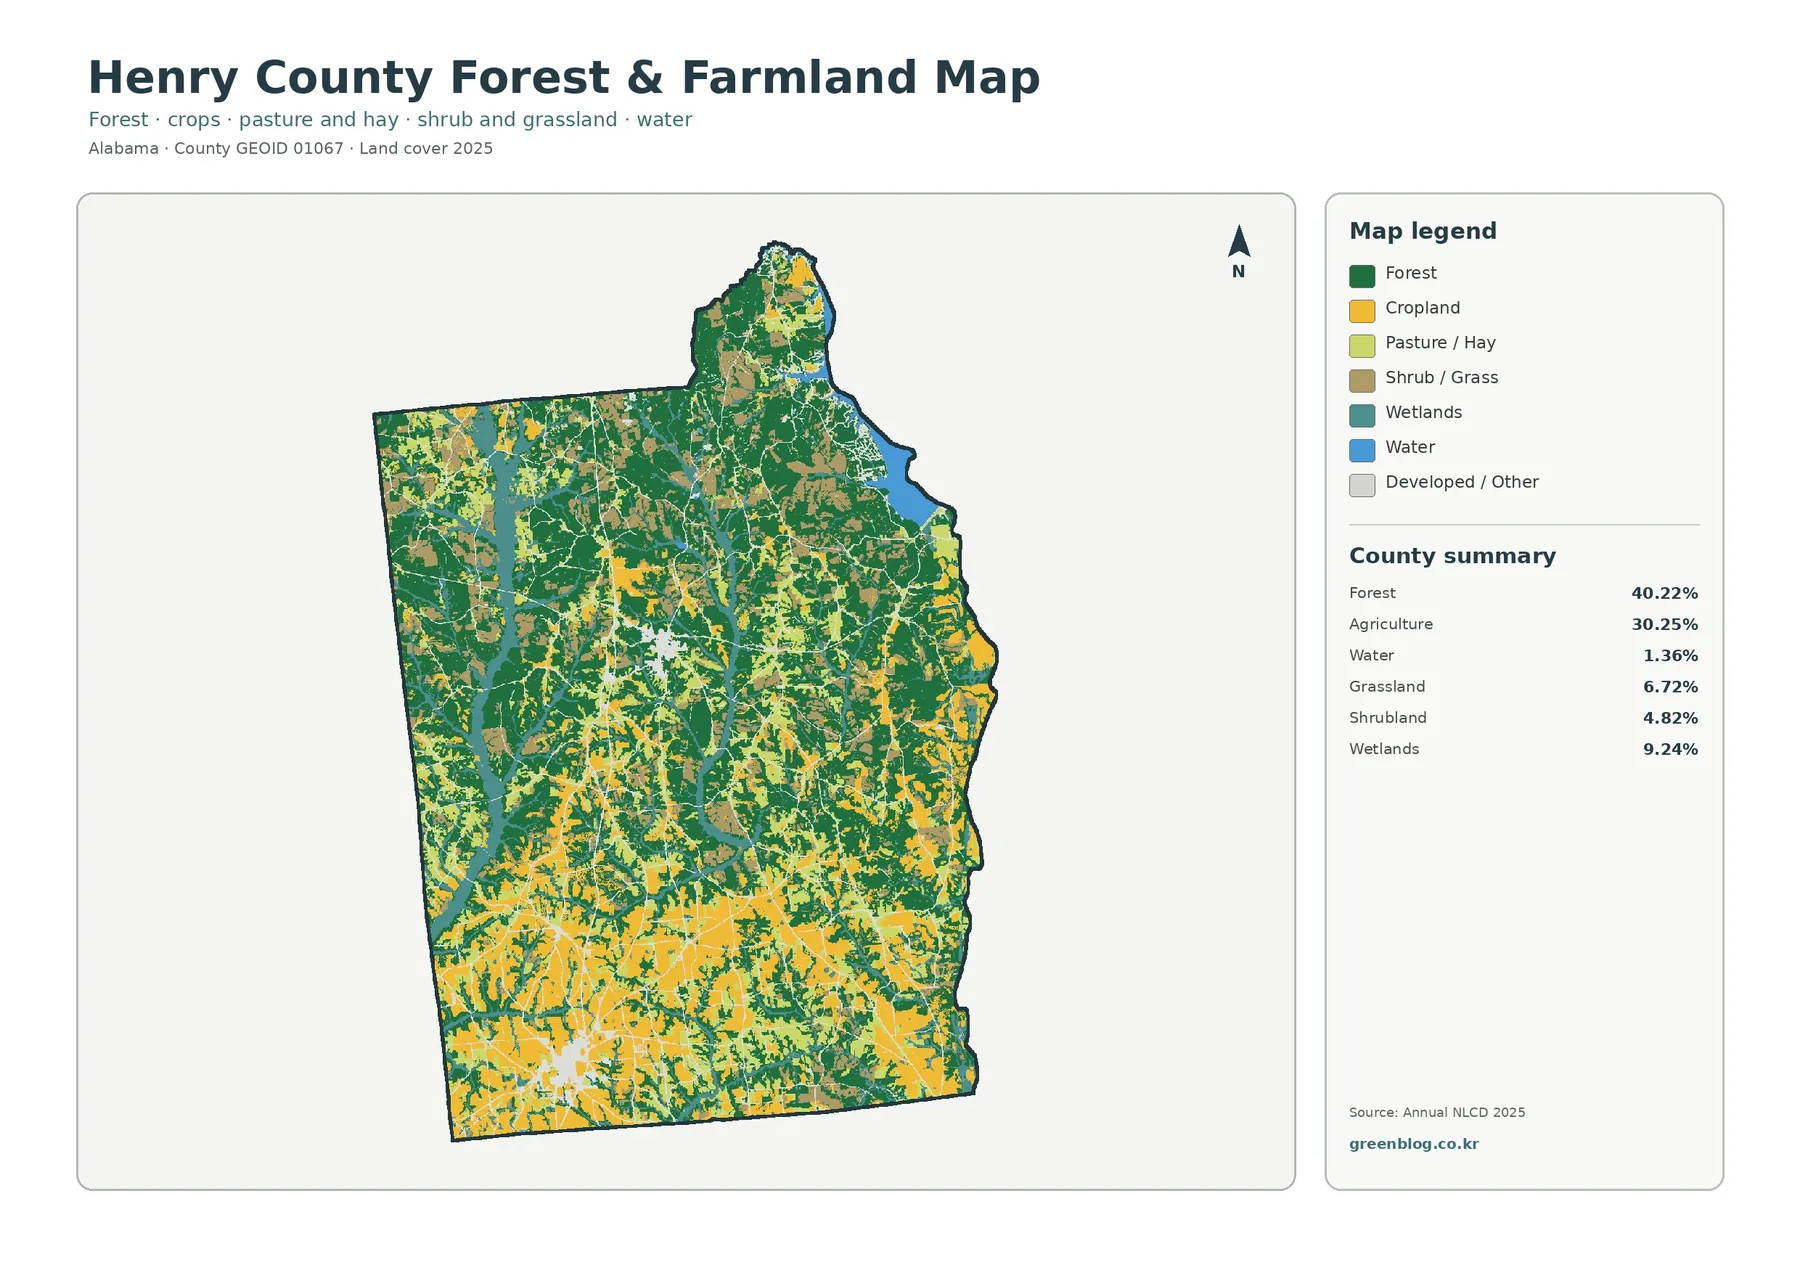
Large farm blocks dominate the southern part of the image. Cropland colors occur beside lighter pasture or hay, and both are broken by narrow wooded strips and wet areas. The pattern becomes more fragmented toward the center, where fields occupy openings within a more continuous forest matrix. In the north, the same agricultural colors remain present but cover less connected ground.
Near the eastern side, water and wetland cover add another layer to the farm–forest pattern. Official Walter F. George project data from the U.S. Army Corps of Engineers places project features in Henry County along the Alabama–Georgia border. That official reference confirms the county’s connection to a major regional water body, but it does not justify naming every visible blue cell in the land-cover image without a dedicated hydrography layer.
For practical land-management questions, the map is only a starting point. The Alabama Cooperative Extension System maintains the Henry County Extension Office in Abbeville and provides local agricultural expertise. A raster classification can show where cropland, pasture, forest, or wetland cover is concentrated, but it cannot identify the owner, crop contract, timber plan, zoning district, or legal use of a specific parcel.
Where hard surfaces cluster inside a mostly rural county
Pavement, rooftops, and similar hard surfaces are measured separately through fractional imperviousness. The countywide mean is 1.27%, and just 0.31% of the county is mapped at 50% or greater imperviousness. Those numbers are much lower than the 7.24% developed land-cover share because developed cells can include lawns, trees, soil, and other surfaces that still absorb water.
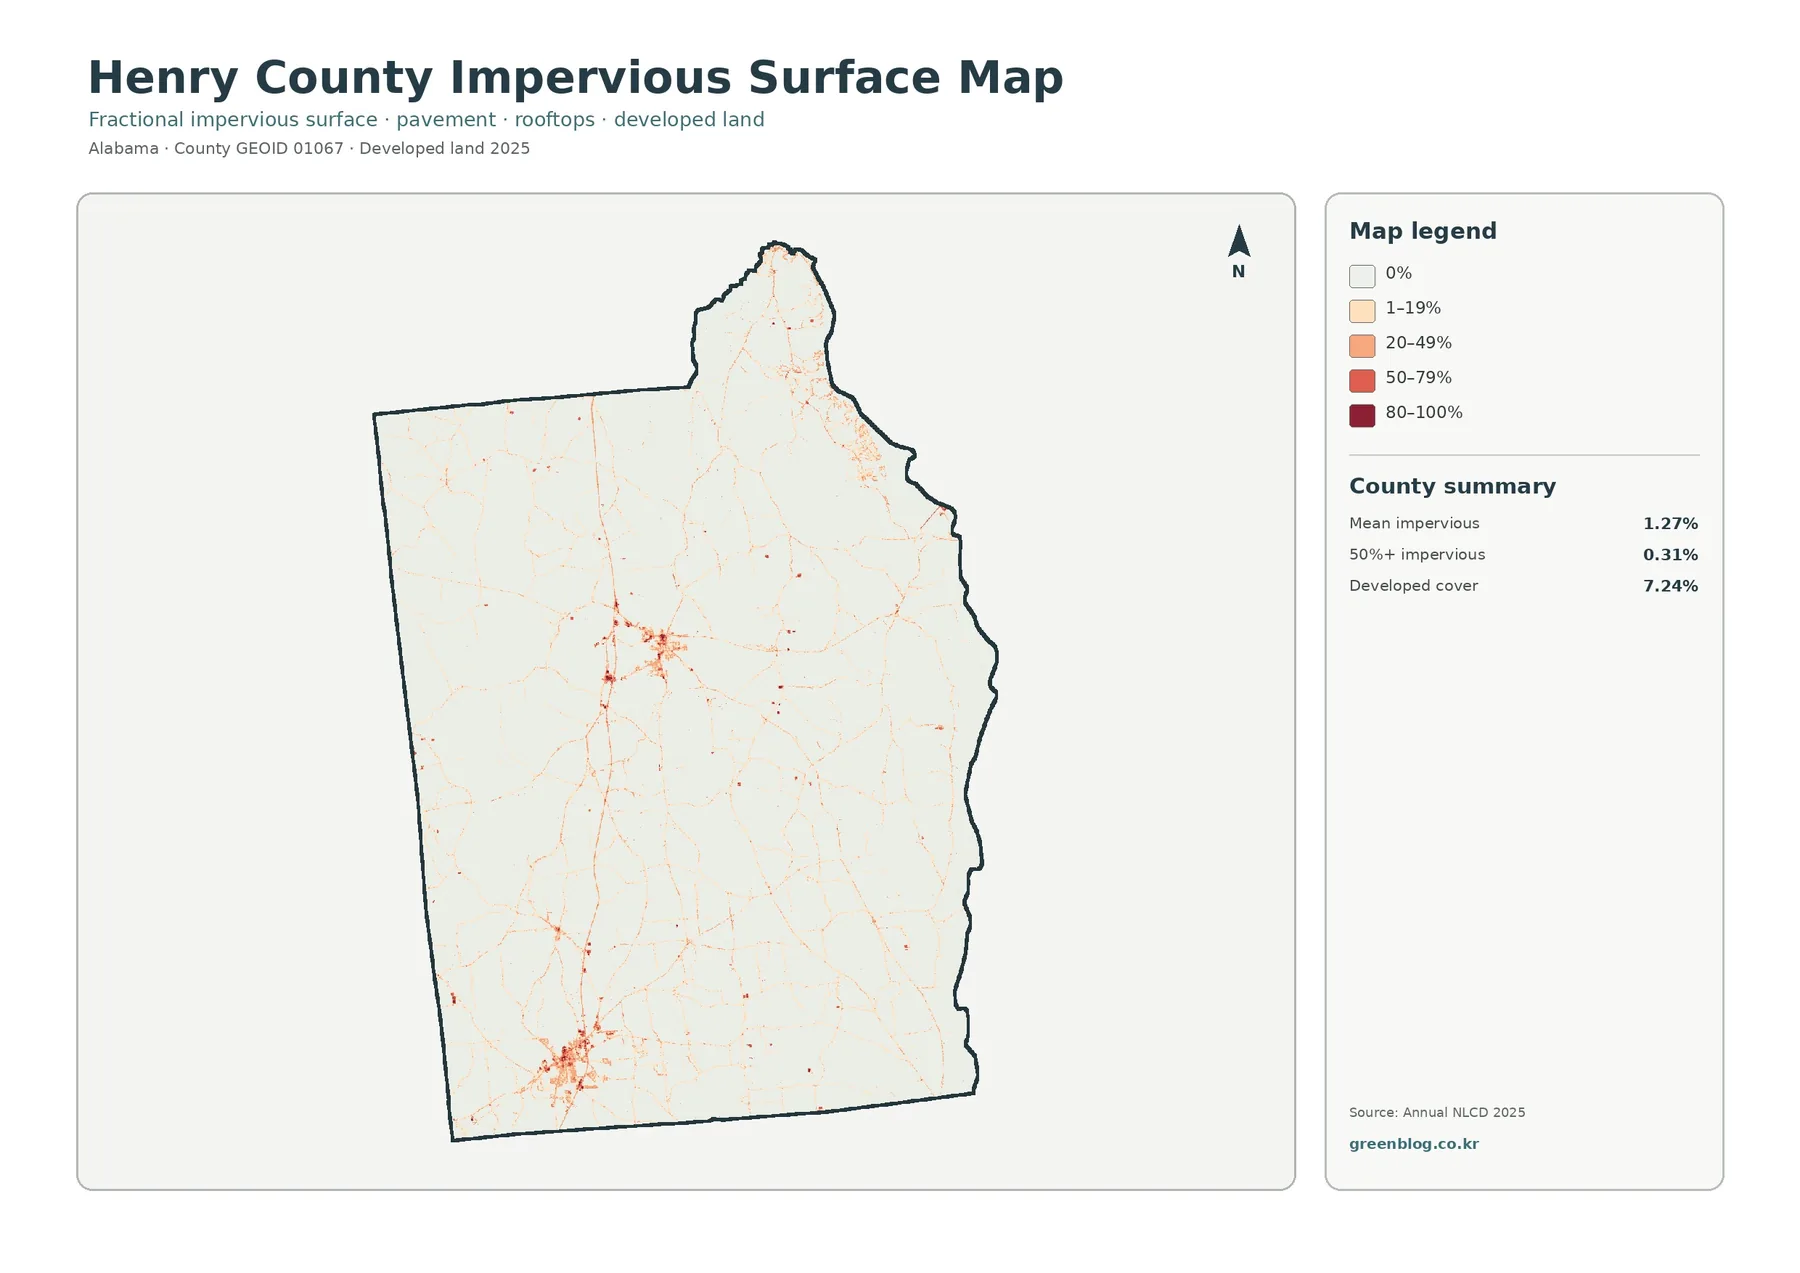
Most of the impervious image is pale. Darker cells collect around the same two broad settlement concentrations visible in the general land-cover map, while thinner orange and red lines extend along connecting routes. The contrast is useful: developed land is visible in several places, yet the area with very high hard-surface coverage remains quite small.
This map should not be treated as a road or drainage plan. It does not show storm sewers, culverts, detention basins, parcel boundaries, street names, or the outline of individual buildings. A darker raster cell simply estimates that a larger fraction of that cell is covered by hard surface. That makes the map suitable for broad development-intensity or stormwater discussions, not site engineering.
What the 1985–2025 comparison really shows
The endpoint comparison marks cells whose mapped class in 1985 differs from the class assigned in 2025. Across the county, 38.89% of cells fall into a difference category. The supplied breakdown identifies 1.45% as to developed, 10.00% as forest loss, 5.37% as agricultural loss, and 21.36% as other class difference. Wetland difference is included in the legend, but no separate countywide percentage is supplied for it.
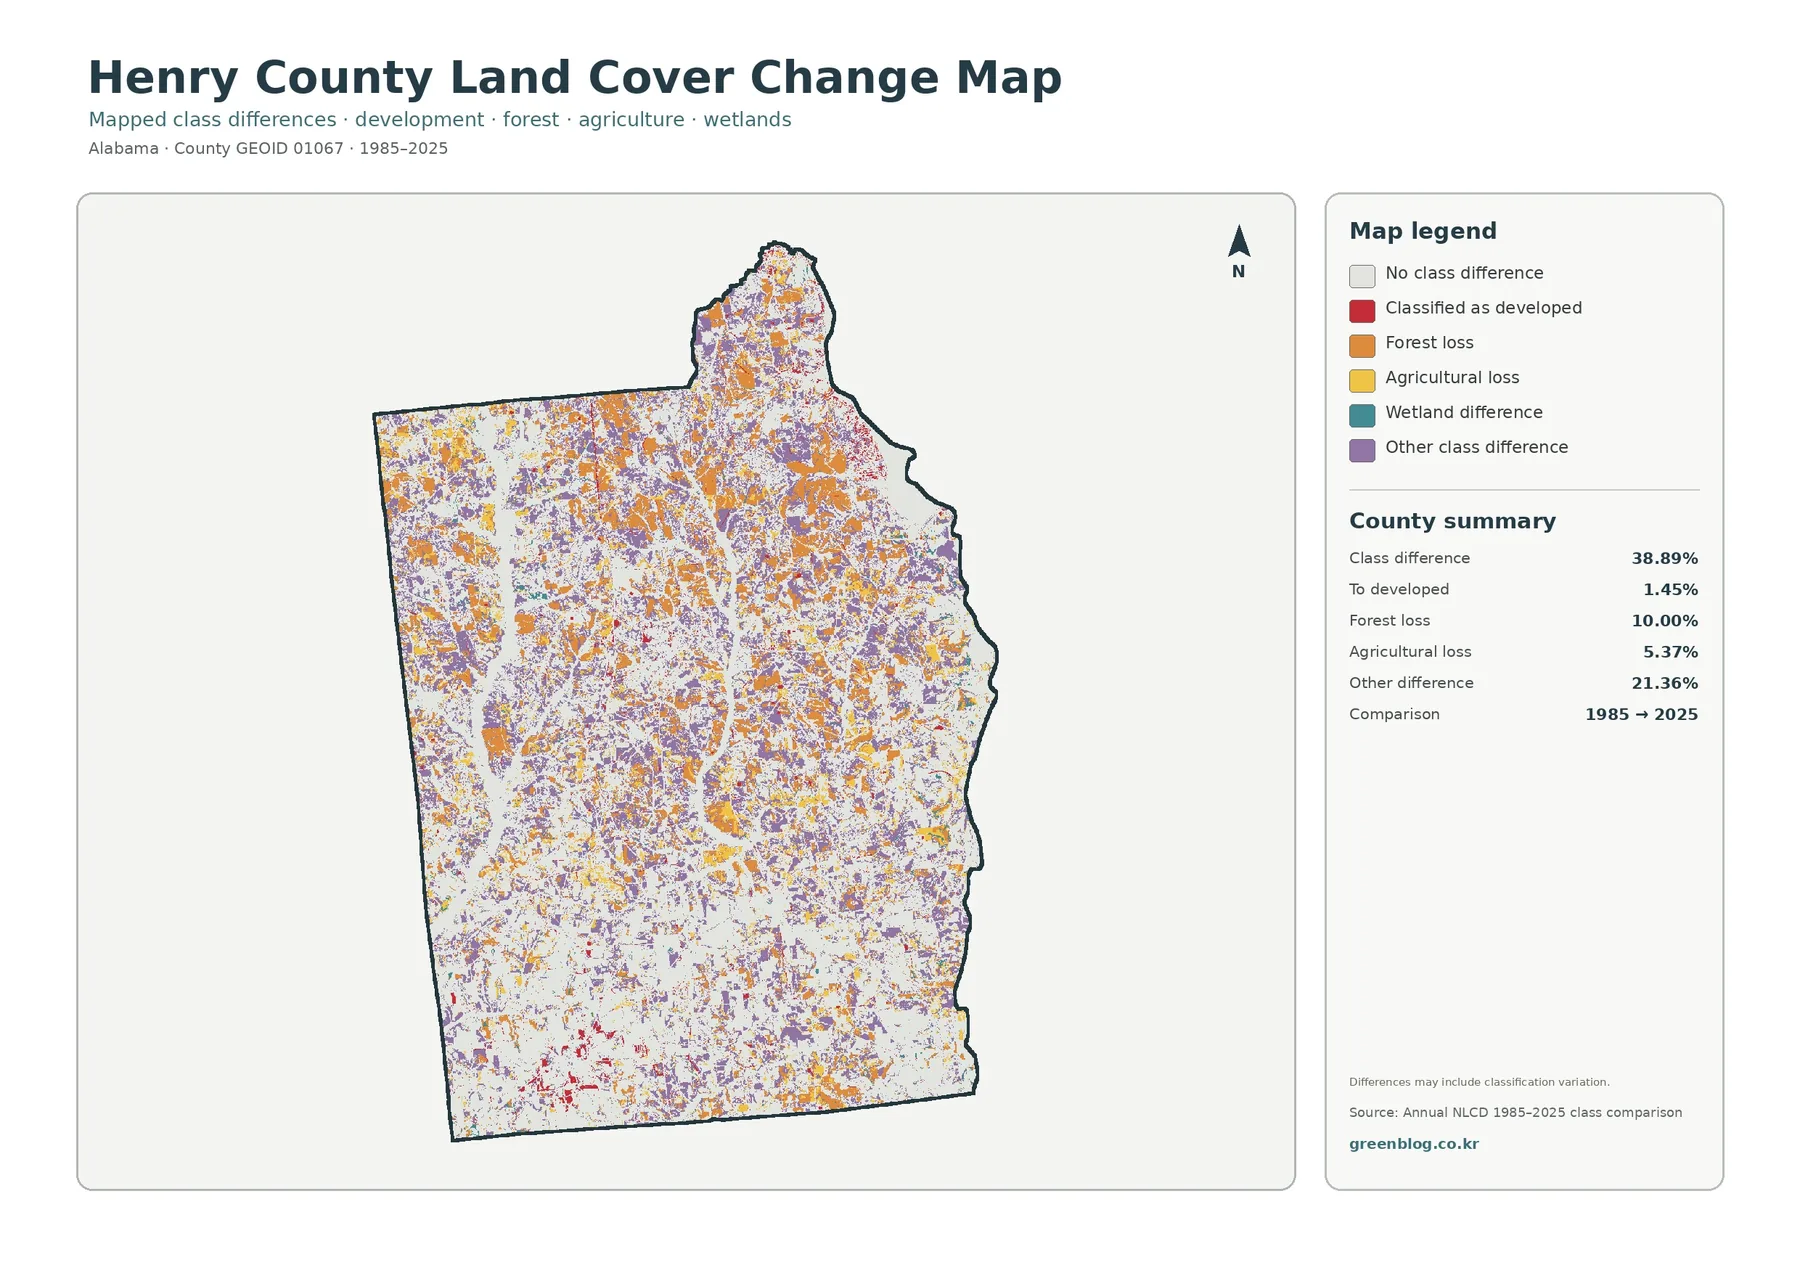
Orange and purple difference cells are widespread across the upper and central portions of the map, with additional patches in the south. Red to-developed cells are much less common and tend to appear near existing developed concentrations or along narrow traces. In other words, the map does not support an interpretation in which urban expansion explains most of the 38.89% endpoint difference.
A class difference is a clue, not a complete history. Each Annual NLCD raster cell represents a generalized surface class, so mixed pixels may contain trees, fields, roads, buildings, or wet ground at the same time. Seasonal vegetation, image conditions, sensors, and classification methods can also affect the assigned label. Real clearing, regrowth, construction, or agricultural change may be present, but the two endpoints do not reveal the exact cause or year.
A stronger historical check would compare intermediate Annual NLCD years or older aerial photographs for the places where difference cells are concentrated. Local forestry, agricultural, or planning records can add context after that. Using the change map as a screening layer is more reliable than treating the full 38.89% as a direct physical conversion rate.
Match each map to the question it was designed to answer
The general map answers “what covers the ground in 2025?” The forest-and-farmland view asks a more focused rural-landscape question. Imperviousness measures how much hard surface is contained within each cell. The endpoint comparison asks whether the 1985 and 2025 classes match. Keeping those questions separate prevents a current developed cell from being mislabeled as newly developed.
The same distinction applies to percentages. Current developed cover is 7.24%, the to-developed endpoint category is 1.45%, and mean imperviousness is 1.27%. Forest is 40.22% today, while forest-loss cells account for 10.00% of the endpoint comparison. These values should not be added or subtracted to invent a single development or deforestation rate.
For county-to-county work, compare the same map type and year on both sides. A 2025 forest percentage belongs beside another 2025 forest percentage, and an impervious mean should be compared with another impervious mean. That simple rule makes classroom charts, county profiles, and presentation graphics much easier to explain.
Download the original Henry County JPG set
The downloadable ZIP contains the four original Henry County JPG maps that correspond to the WebP previews on this page. Each uses the same county extent and orientation, so the set works well as a sequence: overall cover, rural cover, hard-surface concentration, and 1985–2025 endpoint differences.
Each supplied JPG is 2480 × 1754 pixels. The package treats that as the original source resolution rather than enlarging the images to claim extra detail. If a large print is planned, check the legend and small labels at the intended physical size before final output.
Why a county raster cannot replace parcel or field data
Annual NLCD land cover is raster data, meaning the county is divided into grid cells and each cell receives one representative class. At roughly 30-meter land-cover resolution, small roads, field edges, tree lines, stream banks, and buildings can share a cell. A sharp color boundary in the image is therefore not a surveyed property line.
The current-cover maps represent the supplied 2025 classification. Changes after 2025 are outside these images. The historical map compares only two endpoints, so a place that changed more than once and later returned to its original class may look unchanged in the final two-date comparison.
Land cover is also different from legal land use. Agricultural color does not establish zoning or farm ownership, forest does not identify timber rights, developed cover does not grant building permission, and wetland cover does not replace a jurisdictional wetland determination. Parcel, permitting, engineering, and environmental decisions require the appropriate current records or field information.
Frequently Asked Questions
What is the largest 2025 land-cover class in Henry County?
Forest is the largest class in the supplied 2025 summary at 40.22%. Agriculture follows at 30.25%, wetlands at 9.24%, developed land at 7.24%, and grassland at 6.72%. The map shows that forest is more continuous in the north and center, while agriculture becomes much broader in the south.
Why is developed cover 7.24% while mean imperviousness is only 1.27%?
They measure different things. Developed land is a categorical cover class and can include trees, lawns, and bare soil. Imperviousness estimates the fraction covered by hard surfaces such as pavement and rooftops. Henry County’s mean imperviousness is 1.27%, and 0.31% of the county is mapped at 50% or greater imperviousness.
Does 38.89% class difference mean that 38.89% of Henry County was physically transformed?
Not necessarily. It means that 38.89% of mapped cells received different classes in the 1985 and 2025 endpoint comparison. The map explicitly warns that classification variation may be included. Some differences may represent real change, while others can reflect mixed pixels, imagery conditions, or classification methods.
Map File Information
The ZIP contains four original Henry County JPG maps: 2025 land cover, forest and farmland, impervious surface, and mapped class differences from 1985 to 2025.
- File Type: ZIP containing four JPG images
Related Maps
- Autauga County Alabama Land Cover Map
- Baldwin County Alabama Land Cover Map
- Barbour County Alabama Land Cover Map
Sources and data
- MRLC Annual NLCD Data — official access point for Annual NLCD land-cover and developed-surface products.
- USGS Annual NLCD Land Cover Classification — official descriptions of the mapped land-cover classes.
- Henry County: Cities and Towns — county source identifying Abbeville as the county seat and Headland as the largest city.
- Alabama Cooperative Extension System: Henry County — county-specific agricultural and land-management resource.
- U.S. Army Corps of Engineers: Walter F. George Pertinent Data — official regional water reference with Henry County project information.
Green Map creates custom-edited map images using open geographic data sources such as geoBoundaries, Natural Earth, OpenStreetMap, and government open data.
These maps are edited visual materials, not raw data files, and are provided for education, documents, presentations, and graphic reference.